

Conditional Formatting (CF) helps visually highlight important trends and patterns in charts and tables using rule-based color formatting. You can apply thresholds, ranges, and color scales to emphasize performance changes, outliers, and key metrics across supported visualization types. When a Report widget is added to a Dashboard, its Conditional Formatting rules are copied automatically. Changes made in the Dashboard remain local and do not affect the original Report. Conditional Formatting is supported for Line, Area, Column, Horizontal Bar, Multiseries, Table, and Map Charts.
Enabling Conditional Formatting
To add Conditional Formatting:
1. Open the chart or table editor.
-20260513-044835.gif?cb=33bbf67c824e52e1afb6d838bee398d2)
2. In the Widget tab, locate the Conditional Formatting section.
-20260513-050412.gif?cb=5a5cb7ad57421b08d988945813f0710d)
3. Expand the section and turn the toggle ON.
4. Existing rules become active immediately once enabled.
Configuring Rules
Each rule applies formatting to a selected metric based on defined conditions.
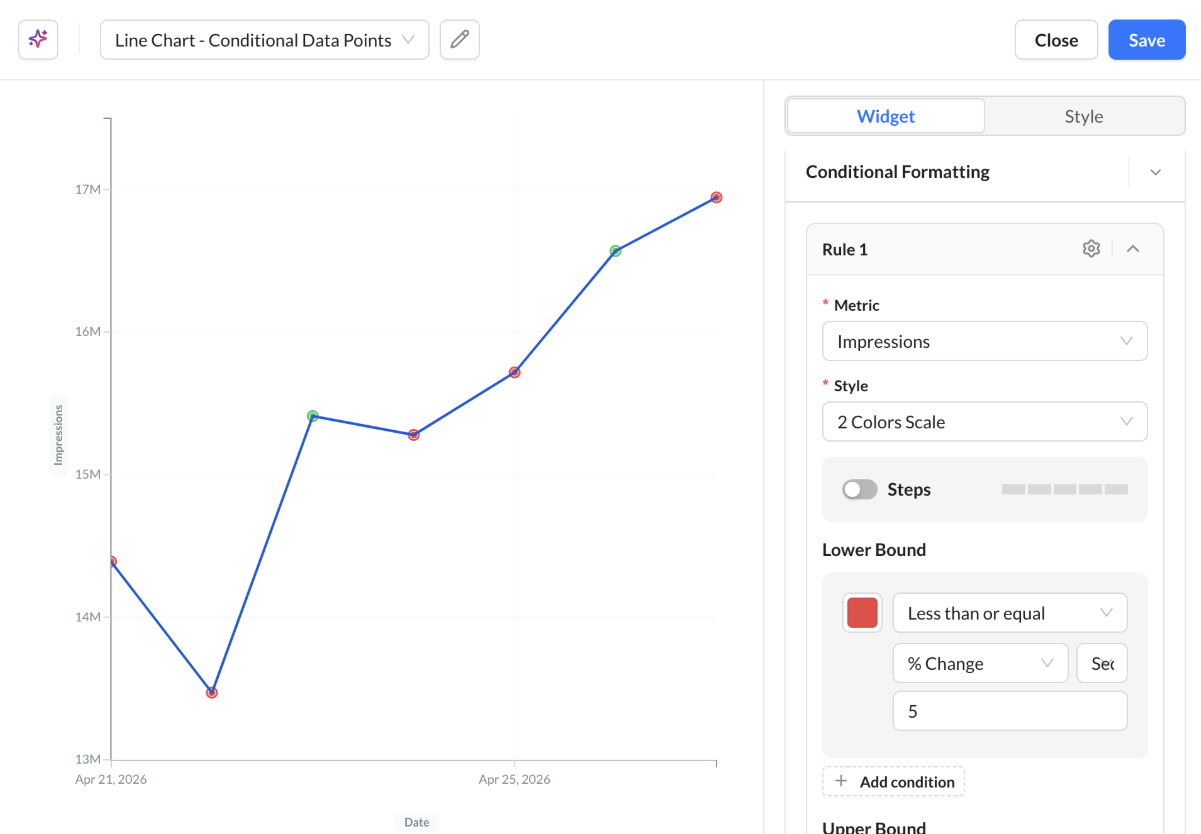
To create a rule:
1. Click Add Rule.
2. Select the metric to evaluate.
3. Choose a color scale style.
4. Define threshold conditions.
5. Save the rule.
You can create multiple rules for the same widget and reorder them to control rule priority.
If multiple rules overlap, the highest-priority rule is applied first.
Metric Selection
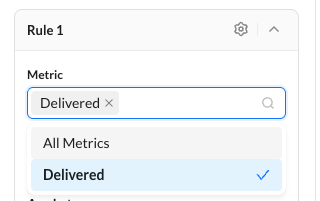
Charts and Maps
-
Rules apply to one metric at a time.
Tables
-
Rules can apply to:
-
Individual metrics
-
Multiple selected metrics
-
All Metrics
-
Rules created for a specific metric override an existing All Metrics rule for that metric.
Color Scale Styles
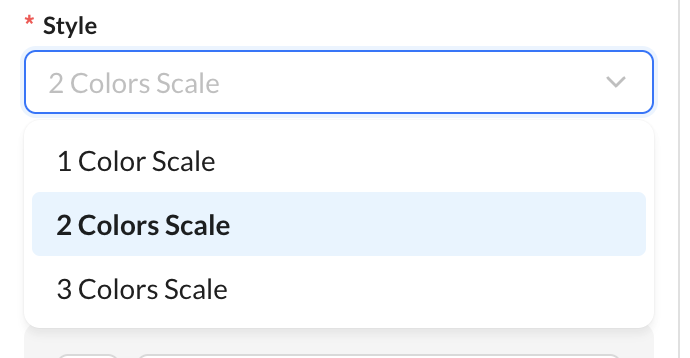
|
1 Color Scale |
|
|---|---|
|
2 Color Scale |
|
|
3 Color Scale |
|
Changing the style resets previous threshold values for that rule.
Steps Toggle
When Steps is enabled, gradients are displayed as distinct color bands instead of smooth transitions.
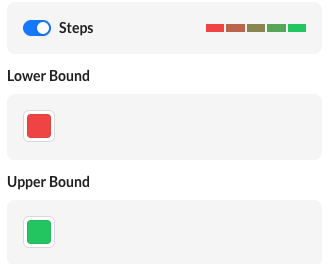
This is useful for clearly separated categories such as Low, Medium, High
Threshold Conditions
Each rule can contain one or more threshold endpoints:
-
Lower Bound
-
Midpoint
-
Upper Bound
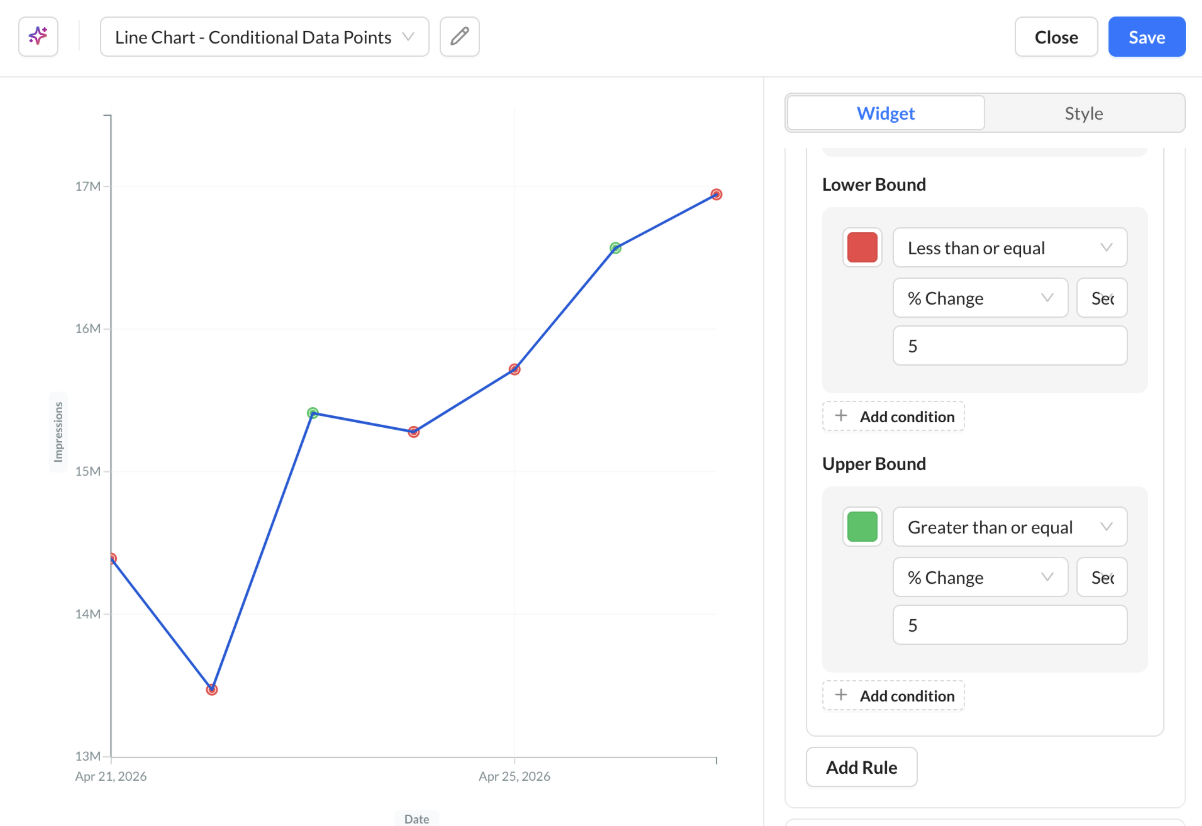
Each endpoint may contain multiple conditions joined with AND, OR
Supported comparison types include:
|
Type |
Description |
|---|---|
|
Input Value |
Compare against a manually entered value |
|
Average / Median / Min / Max |
Compare against a statistical aggregate |
|
% Change |
Compare against sequential or average percentage change |
|
Percentile |
Compare values using percentile ranking |
|
Metric Comparison |
Compare one metric against another |
Supported operators:
-
Less than
-
Less than or equal
-
Greater than
-
Greater than or equal
Table-Specific Formatting
Tables support additional formatting controls. You can apply formatting to table cells or text values using metric-based rules.
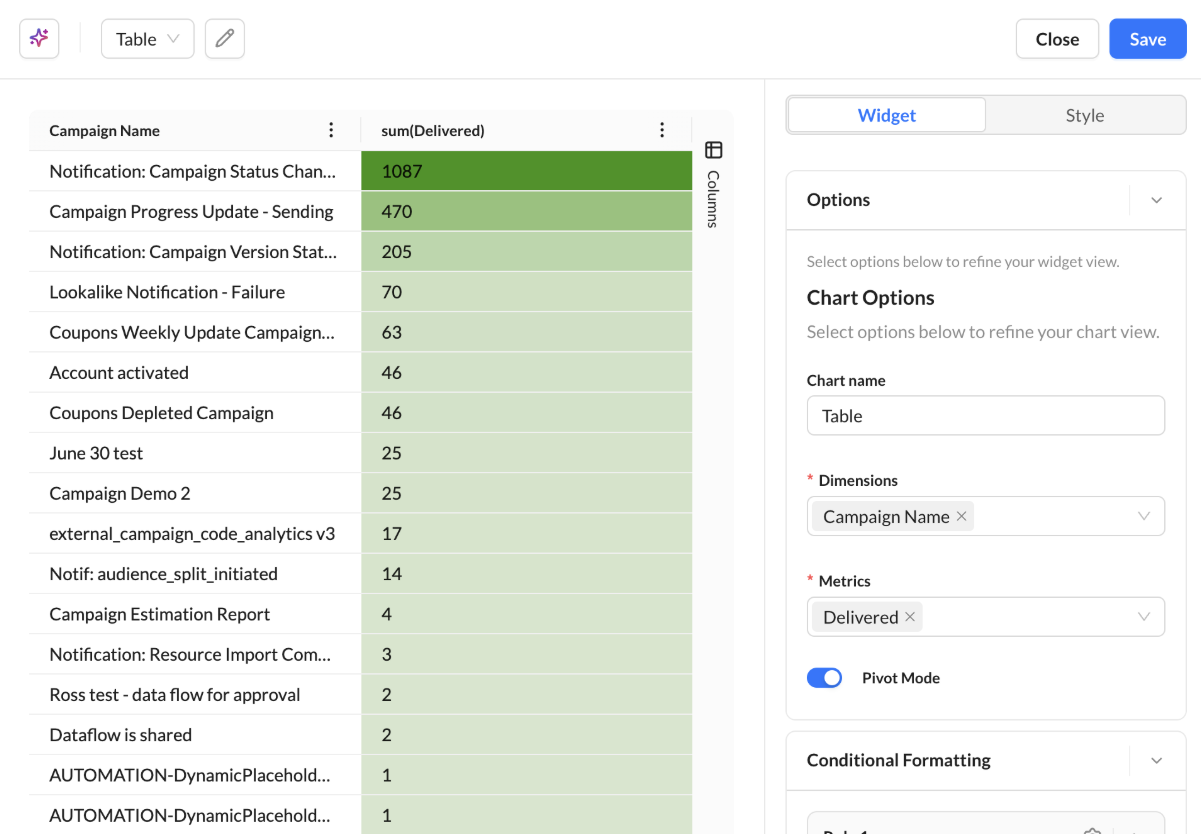
-
You can apply color to the table cell background.
-
You can apply color to the metric value text.
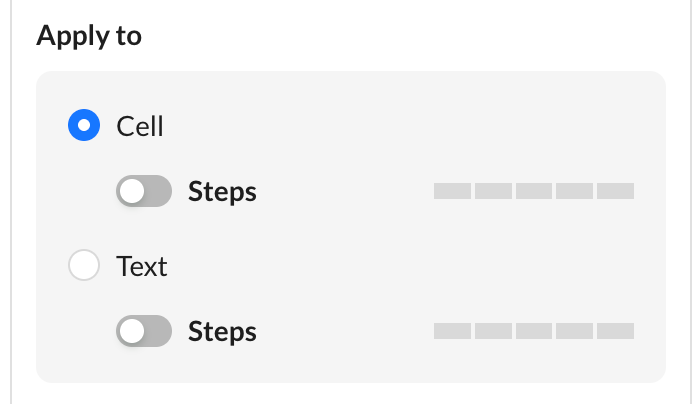
Both modes support independent Step toggles.
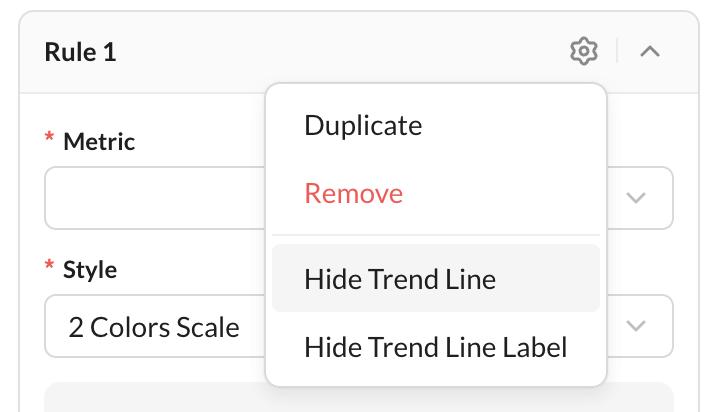
Trend Lines
Available for chart visualizations only.
Trend line options allow you to:
-
Show or hide a trend line
-
Show or hide trend line labels
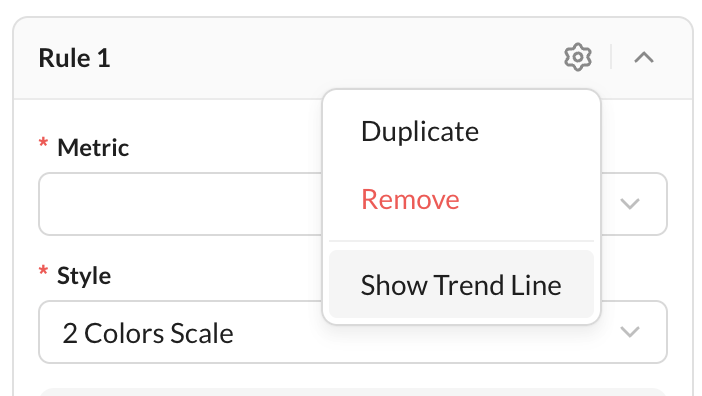
Trend lines are supported only for compatible threshold types, such as Average, Median, and Input values.