

Creating Dashboards
To build a multi-widget, visual overview of your data, click on the blue Create button in the top right corner and choose Dashboard from the dropdown.
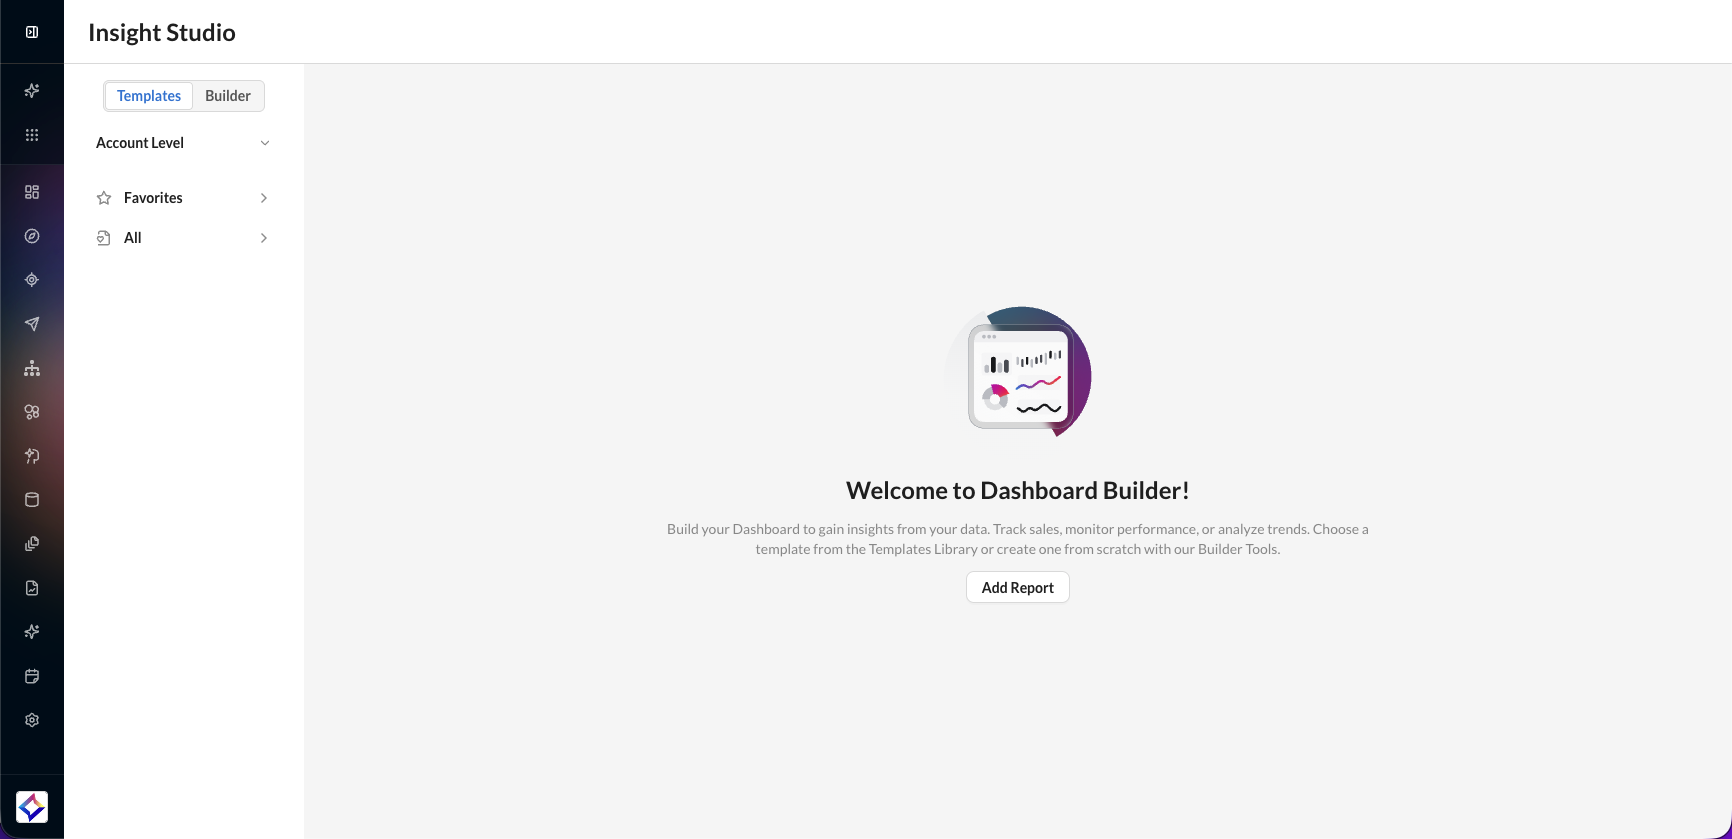
Step 1: Configure Dashboard
Enter a dashboard name, a short description outlining its purpose, and select one or more reports using the checkboxes to include them in the dashboard.
-20250722-130550.gif?cb=6279383d6af5d612ec5477e15282ee5a)
Step 2: Select Fields
Define the fields that will serve as dashboard-level filters, enabling consistent filtering across all included reports.
-20250722-133237.gif)
-
Select a Primary Report that will serve as the source for global filters.
-
Under Dimensions or Metrics, choose the fields that will be used as dashboard filters.
-
Select the corresponding Secondary Reports to prepare for filter mapping in the next step.
These selections lay the foundation for linking filters across datasets with different schemas.
Step 3: Configure Filters
Establish mappings between the dashboard filters (from the Primary Report) and the corresponding fields in each Secondary Report.
-20250722-133301.gif?cb=4aaec4cffaf4f05216f3c0544a2898df)
-
In the Secondary Reports section, select fields that match or align with the Primary Report filters.
-
This mapping ensures that filters applied at the dashboard level are propagated uniformly across all selected reports.
By aligning filter fields, you maintain data consistency and accuracy across your entire dashboard view.
Step 4: Review Summary
In the final step, review your dashboard configuration before saving.
-20250722-134251.gif?cb=faf294b9d89040c4ed7dee140be6564e)
-
Click on Save to finalize and create your dashboard.
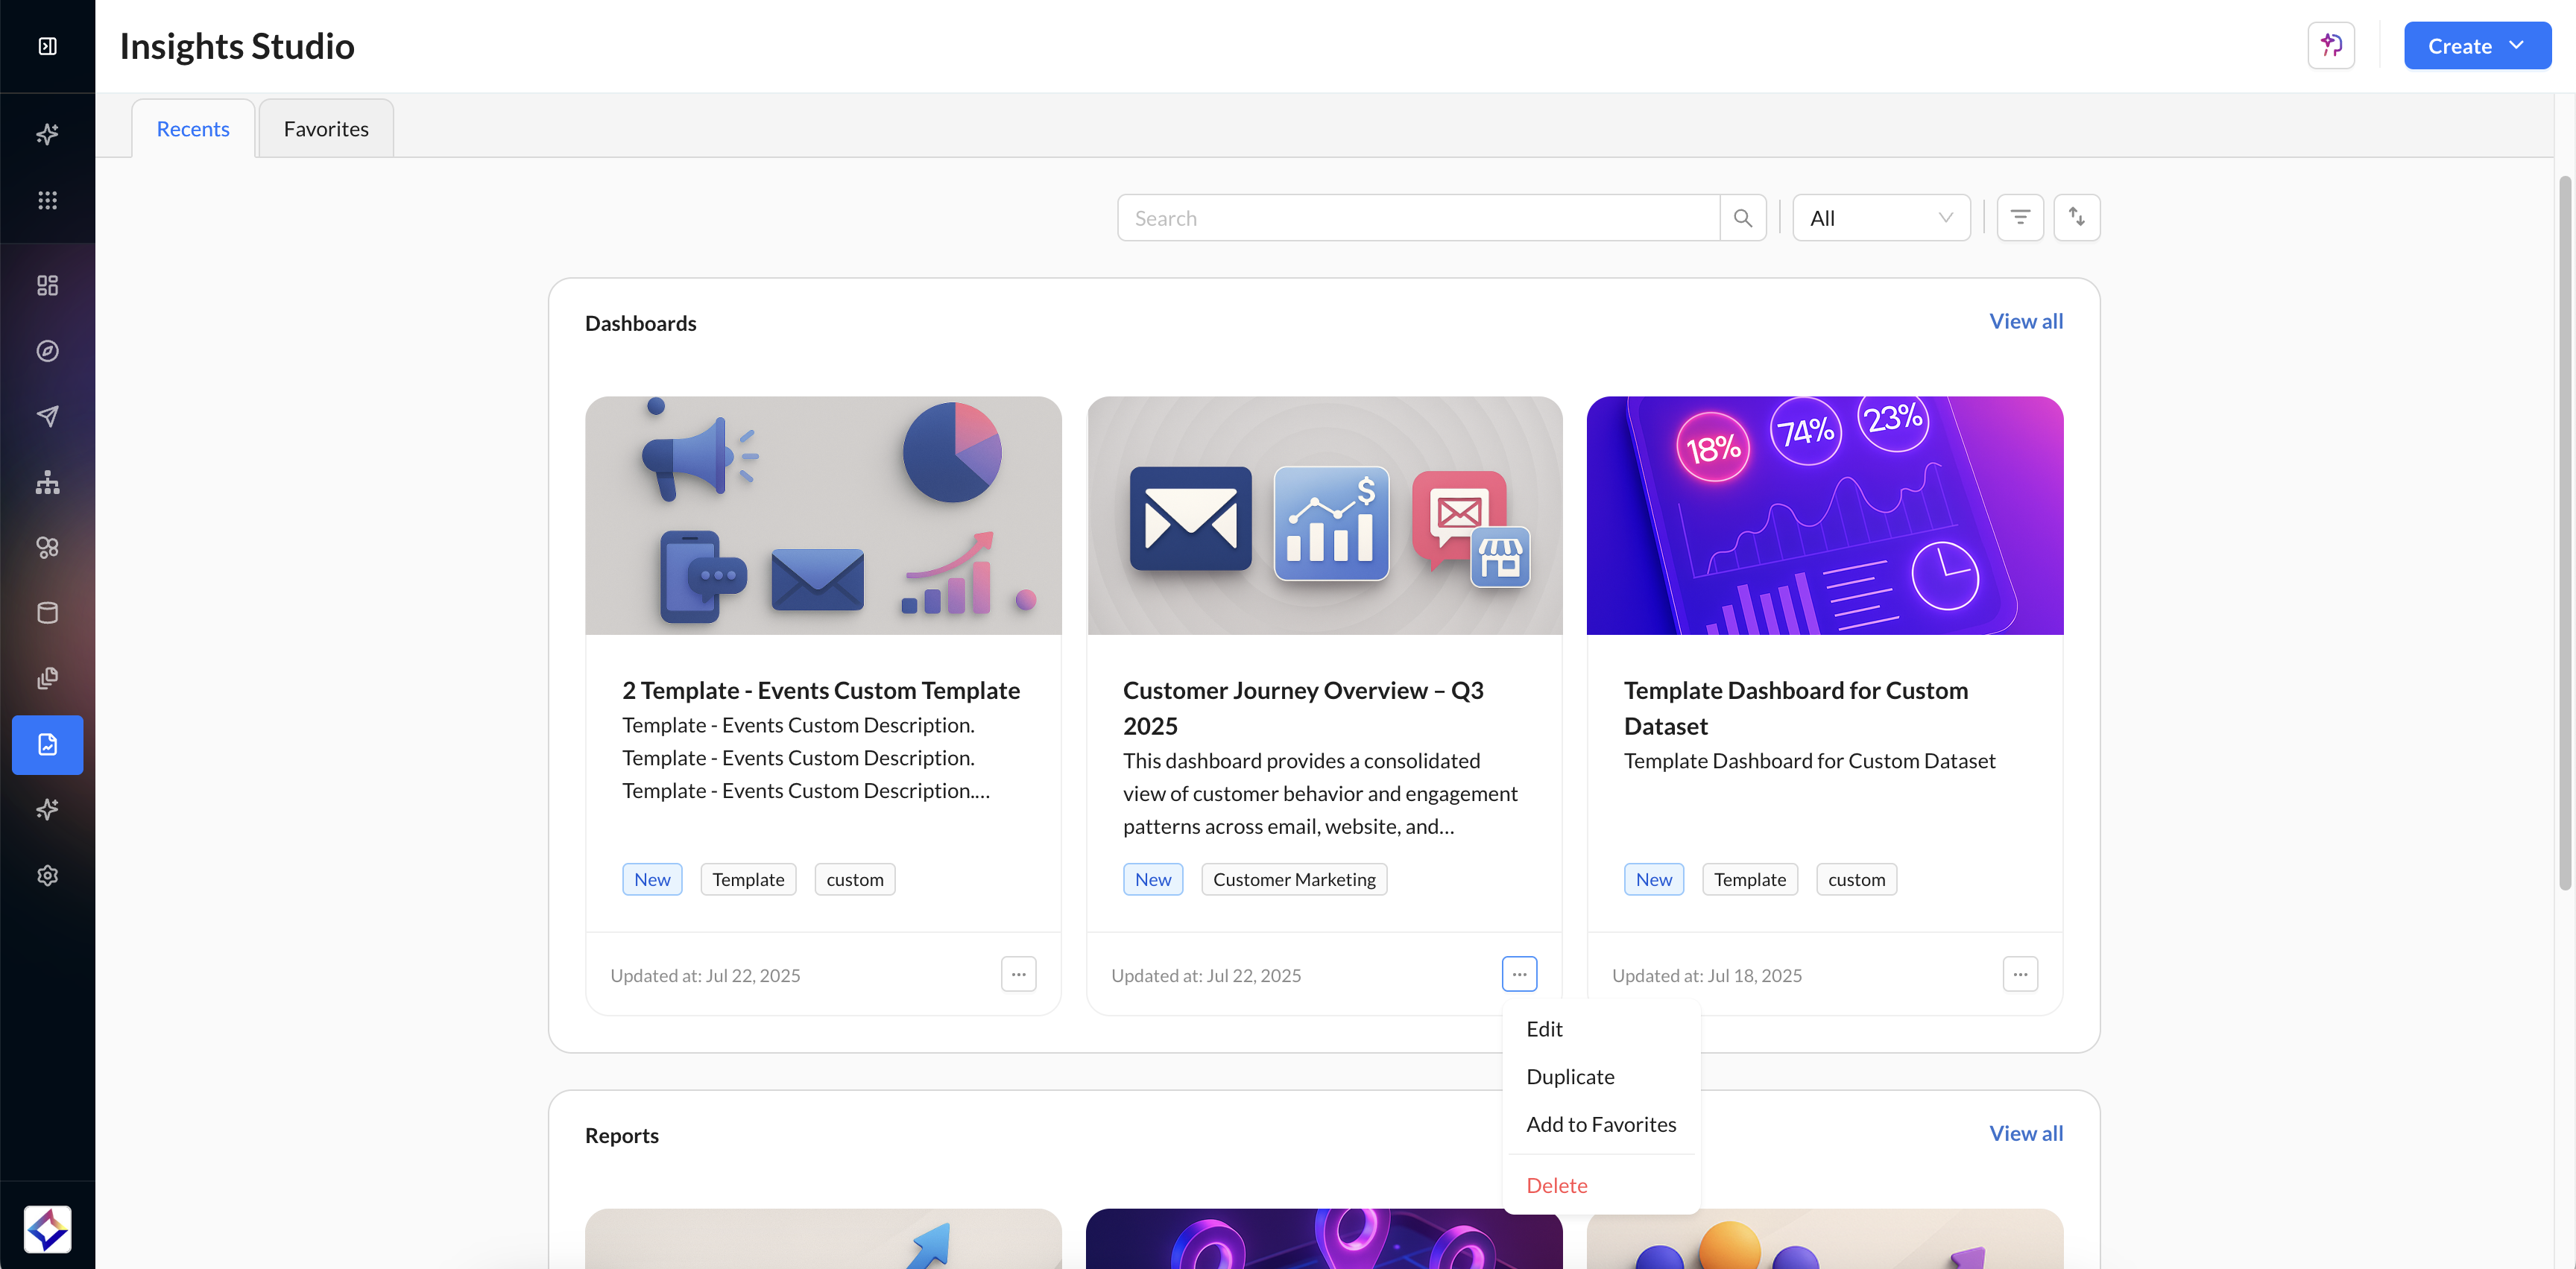
After saving your dashboard, you’re redirected to the Insights Studio home screen, where your newly created dashboard appears under Dashboards > Recents.
-
From here, you can:
-
Open the dashboard to view and interact with live data
-
Edit dashboard configurations and filters
-
Favorite, share, or duplicate the dashboard
-
Apply global filters and visualize metrics using pre-configured widgets
-
Dashboard Workspace & Navigation
The Insights Studio dashboard experience provides a streamlined workspace for creating, managing, and interacting with dashboards.
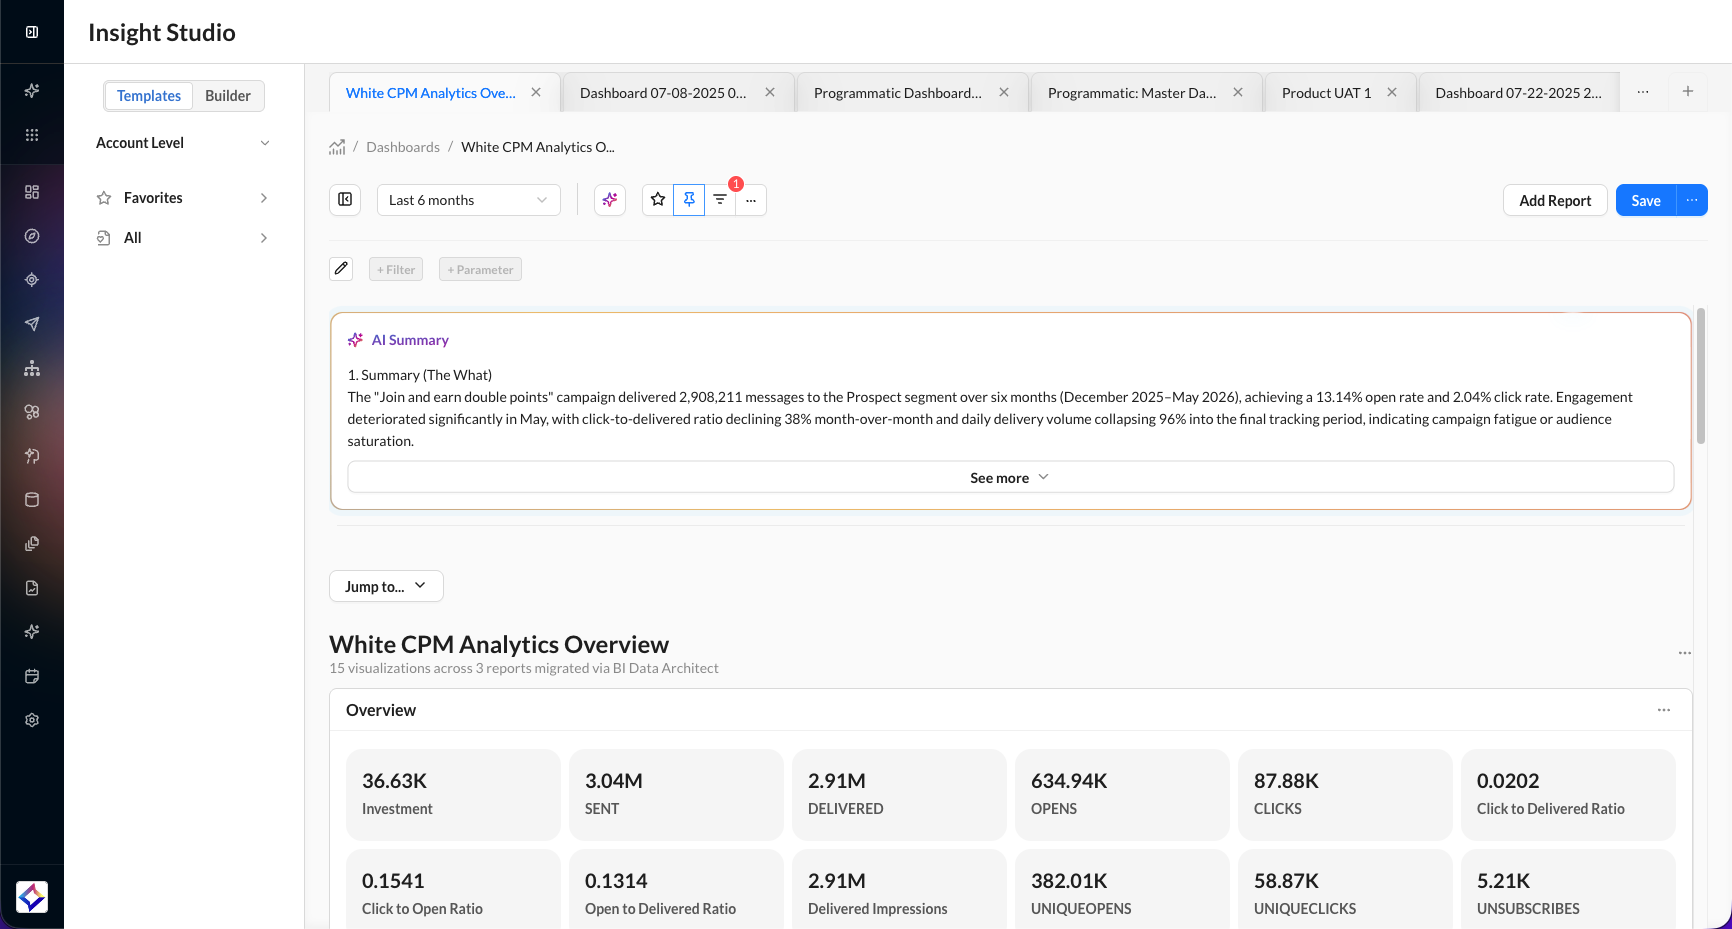
Key interface areas include:
-
Insight Studio Top Bar for navigation and workspace context
-
Dashboard Tabs for switching between multiple open dashboards
-
Action Bar for filters, date ranges, saving, and dashboard actions
-
Widget Canvas displaying dashboard visualizations and reports
-
Overview Panel for AI-generated dashboard summaries and key insights
The unified workspace allows users to manage dashboard interactions without leaving the current view.
Using the Action Bar
The Action Bar provides centralized dashboard controls for filtering, saving, and managing widgets.
-20260520-090635.gif?cb=0d1d99f955af0ca334400776a551c650)
Available controls include:
-
Date Range Picker for applying a global dashboard time range
-
Filter Controls for adding and managing dashboard filters
-
Favorite to bookmark dashboards for quick access
-
More Actions (⋯) for additional dashboard settings
-
Add Report to add new widgets to the dashboard
-
Save to persist dashboard layout and configuration changes
Widget Layout & Resizing
Dashboard widgets can be resized and customized independently to support different visualization needs.
-20260520-090924.gif?cb=1b35349b3bc311d67520f6752bc9f194)
Dashboard Owners & Admins can also personalize their dashboards by dragging and dropping metrics into a custom layout.
-20260520-093500.gif?cb=c5b17a5b383ac513ae23d0b110bee469)
Using the Filter Tray
The Filter Tray is a persistent dashboard-level filter bar shown above the dashboard canvas.
In-View Filters
Before a filter can appear in the Filter Tray, it must be configured in the Filter Controls panel. Open it by clicking the pencil icon to the left of the + Filter button in the Filter Tray.
-20260520-091519.gif)
In-View Filters allow dashboard owners and editors to expose selected filters directly within the dashboard Filter Tray for interactive use by viewers.
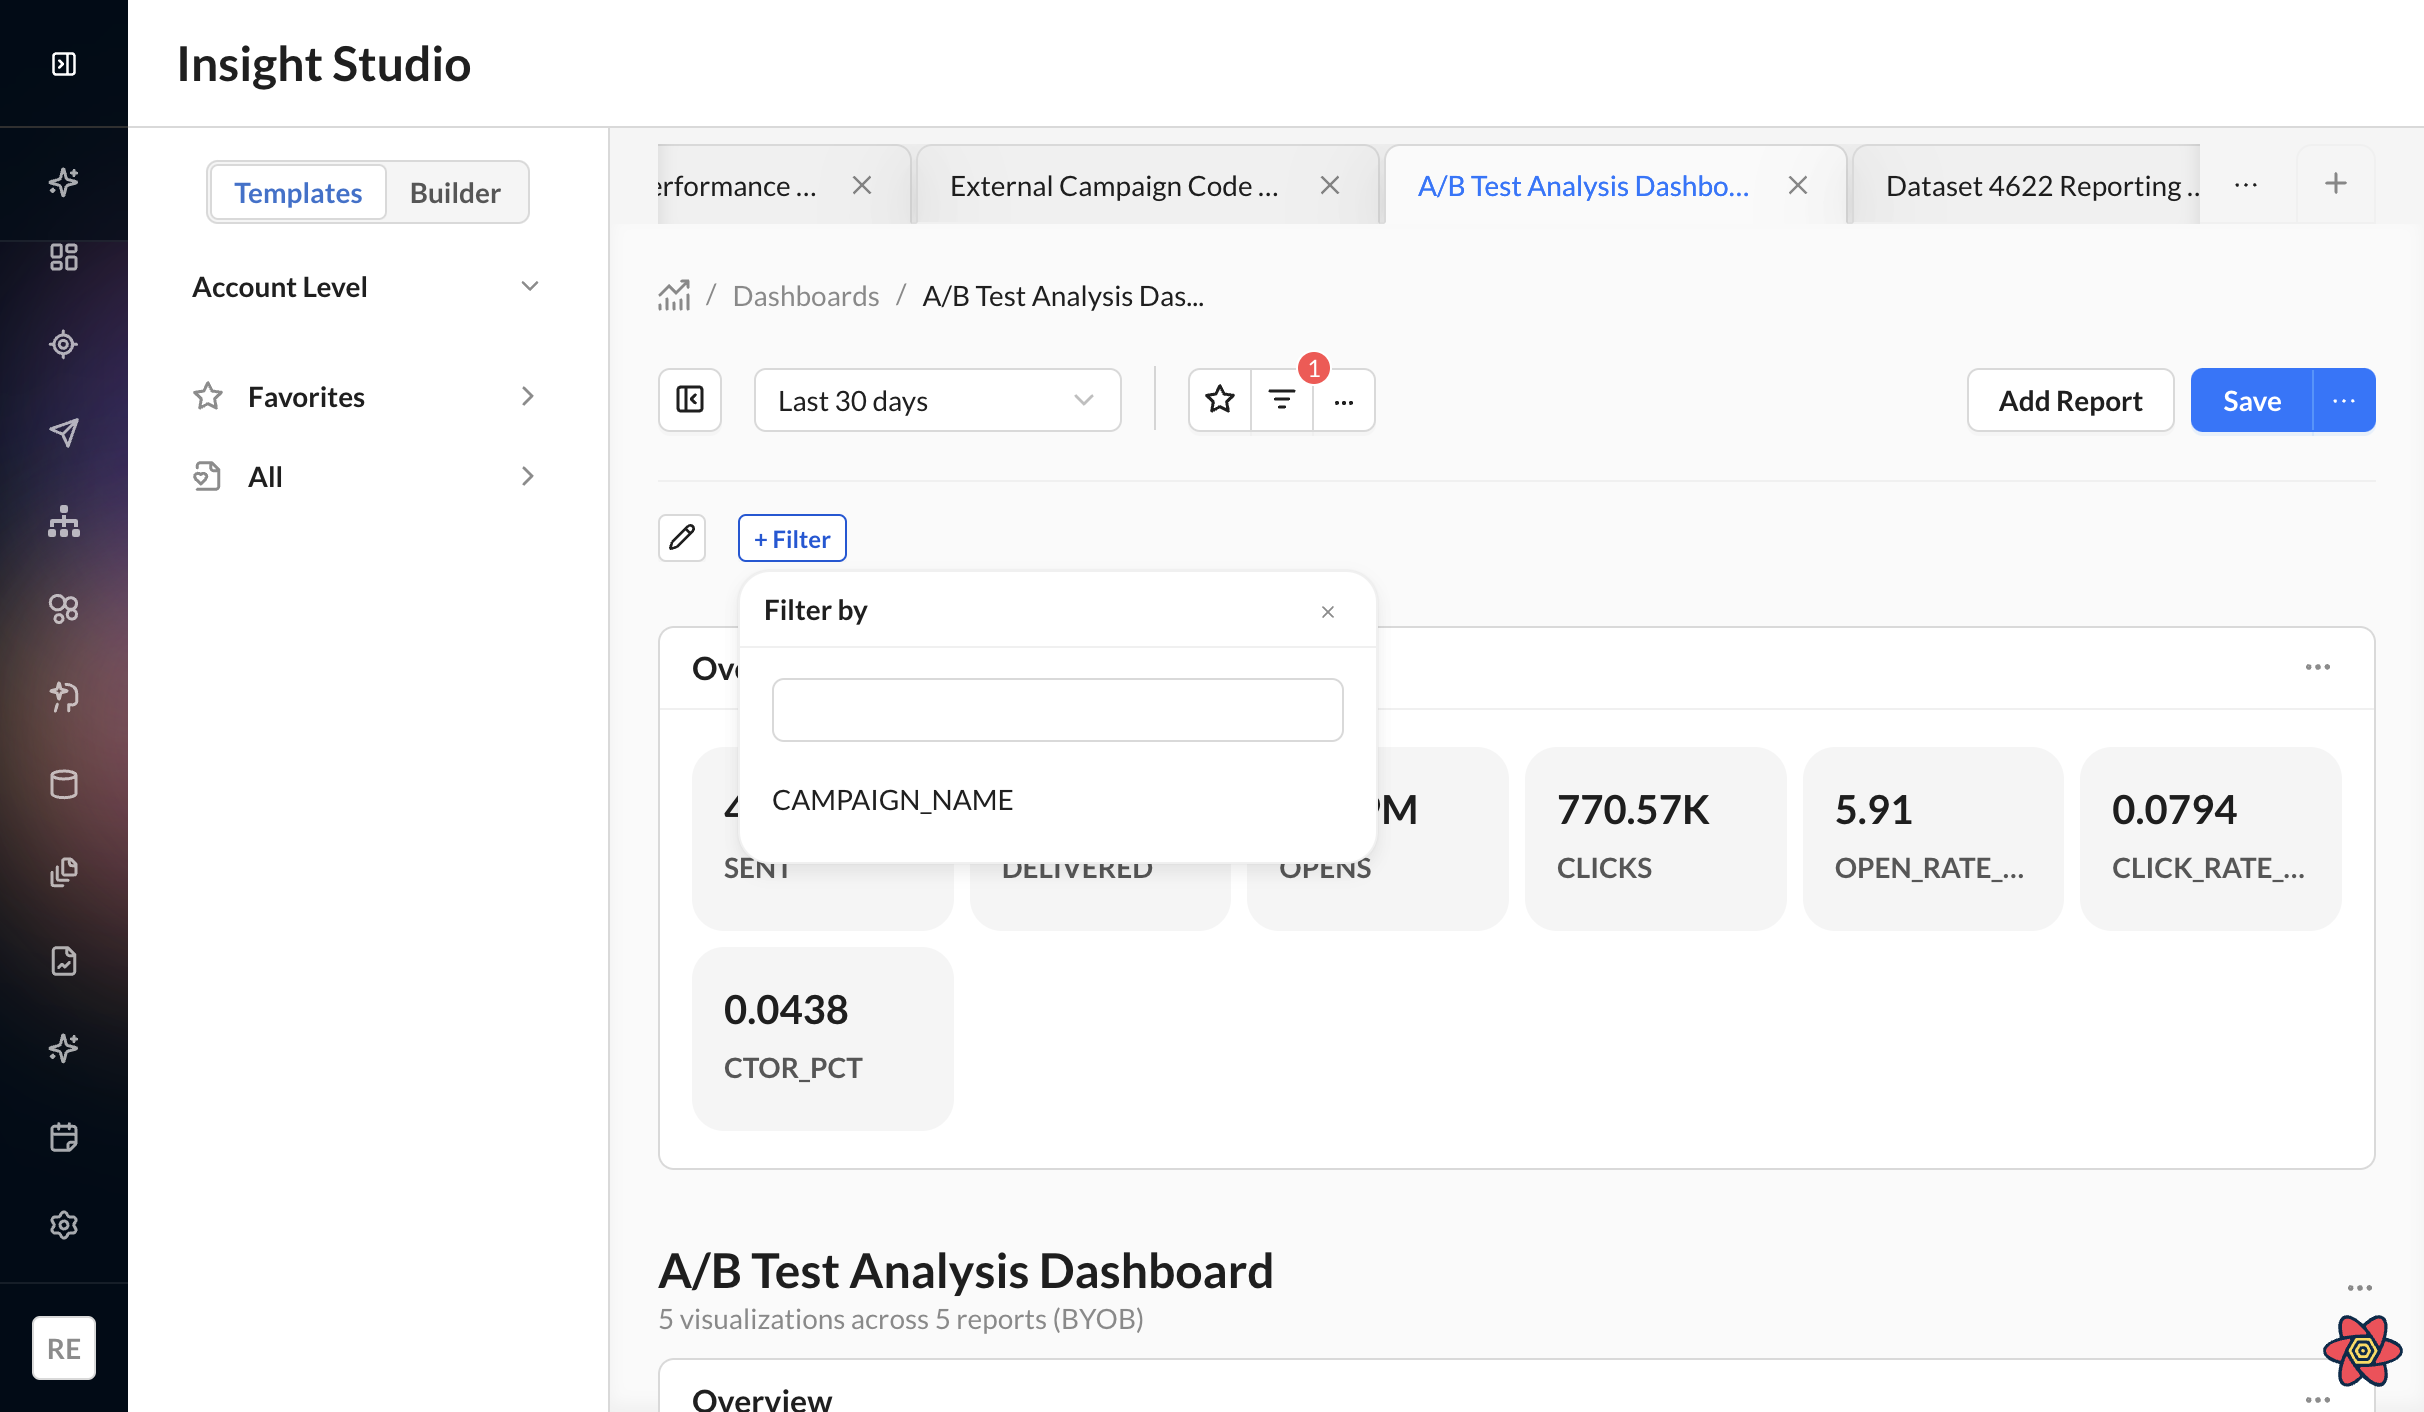
These filters appear as clickable filter chips at the top of the dashboard and allow users to filter across all widgets simultaneously, apply temporary Includes/Excludes or range-based filtering, and explore dashboard data without modifying the saved dashboard configuration
Dashboard owners can configure which filters are available through the Filter Controls panel.
Clicking a dimension filter tag opens a filter popover where you can:
-
Switch between Includes (show selected values) and Excludes (hide selected values)
-
Search and select specific dimension values
-
Apply filters across all widgets on the dashboard
-
Cancel changes without updating the dashboard view
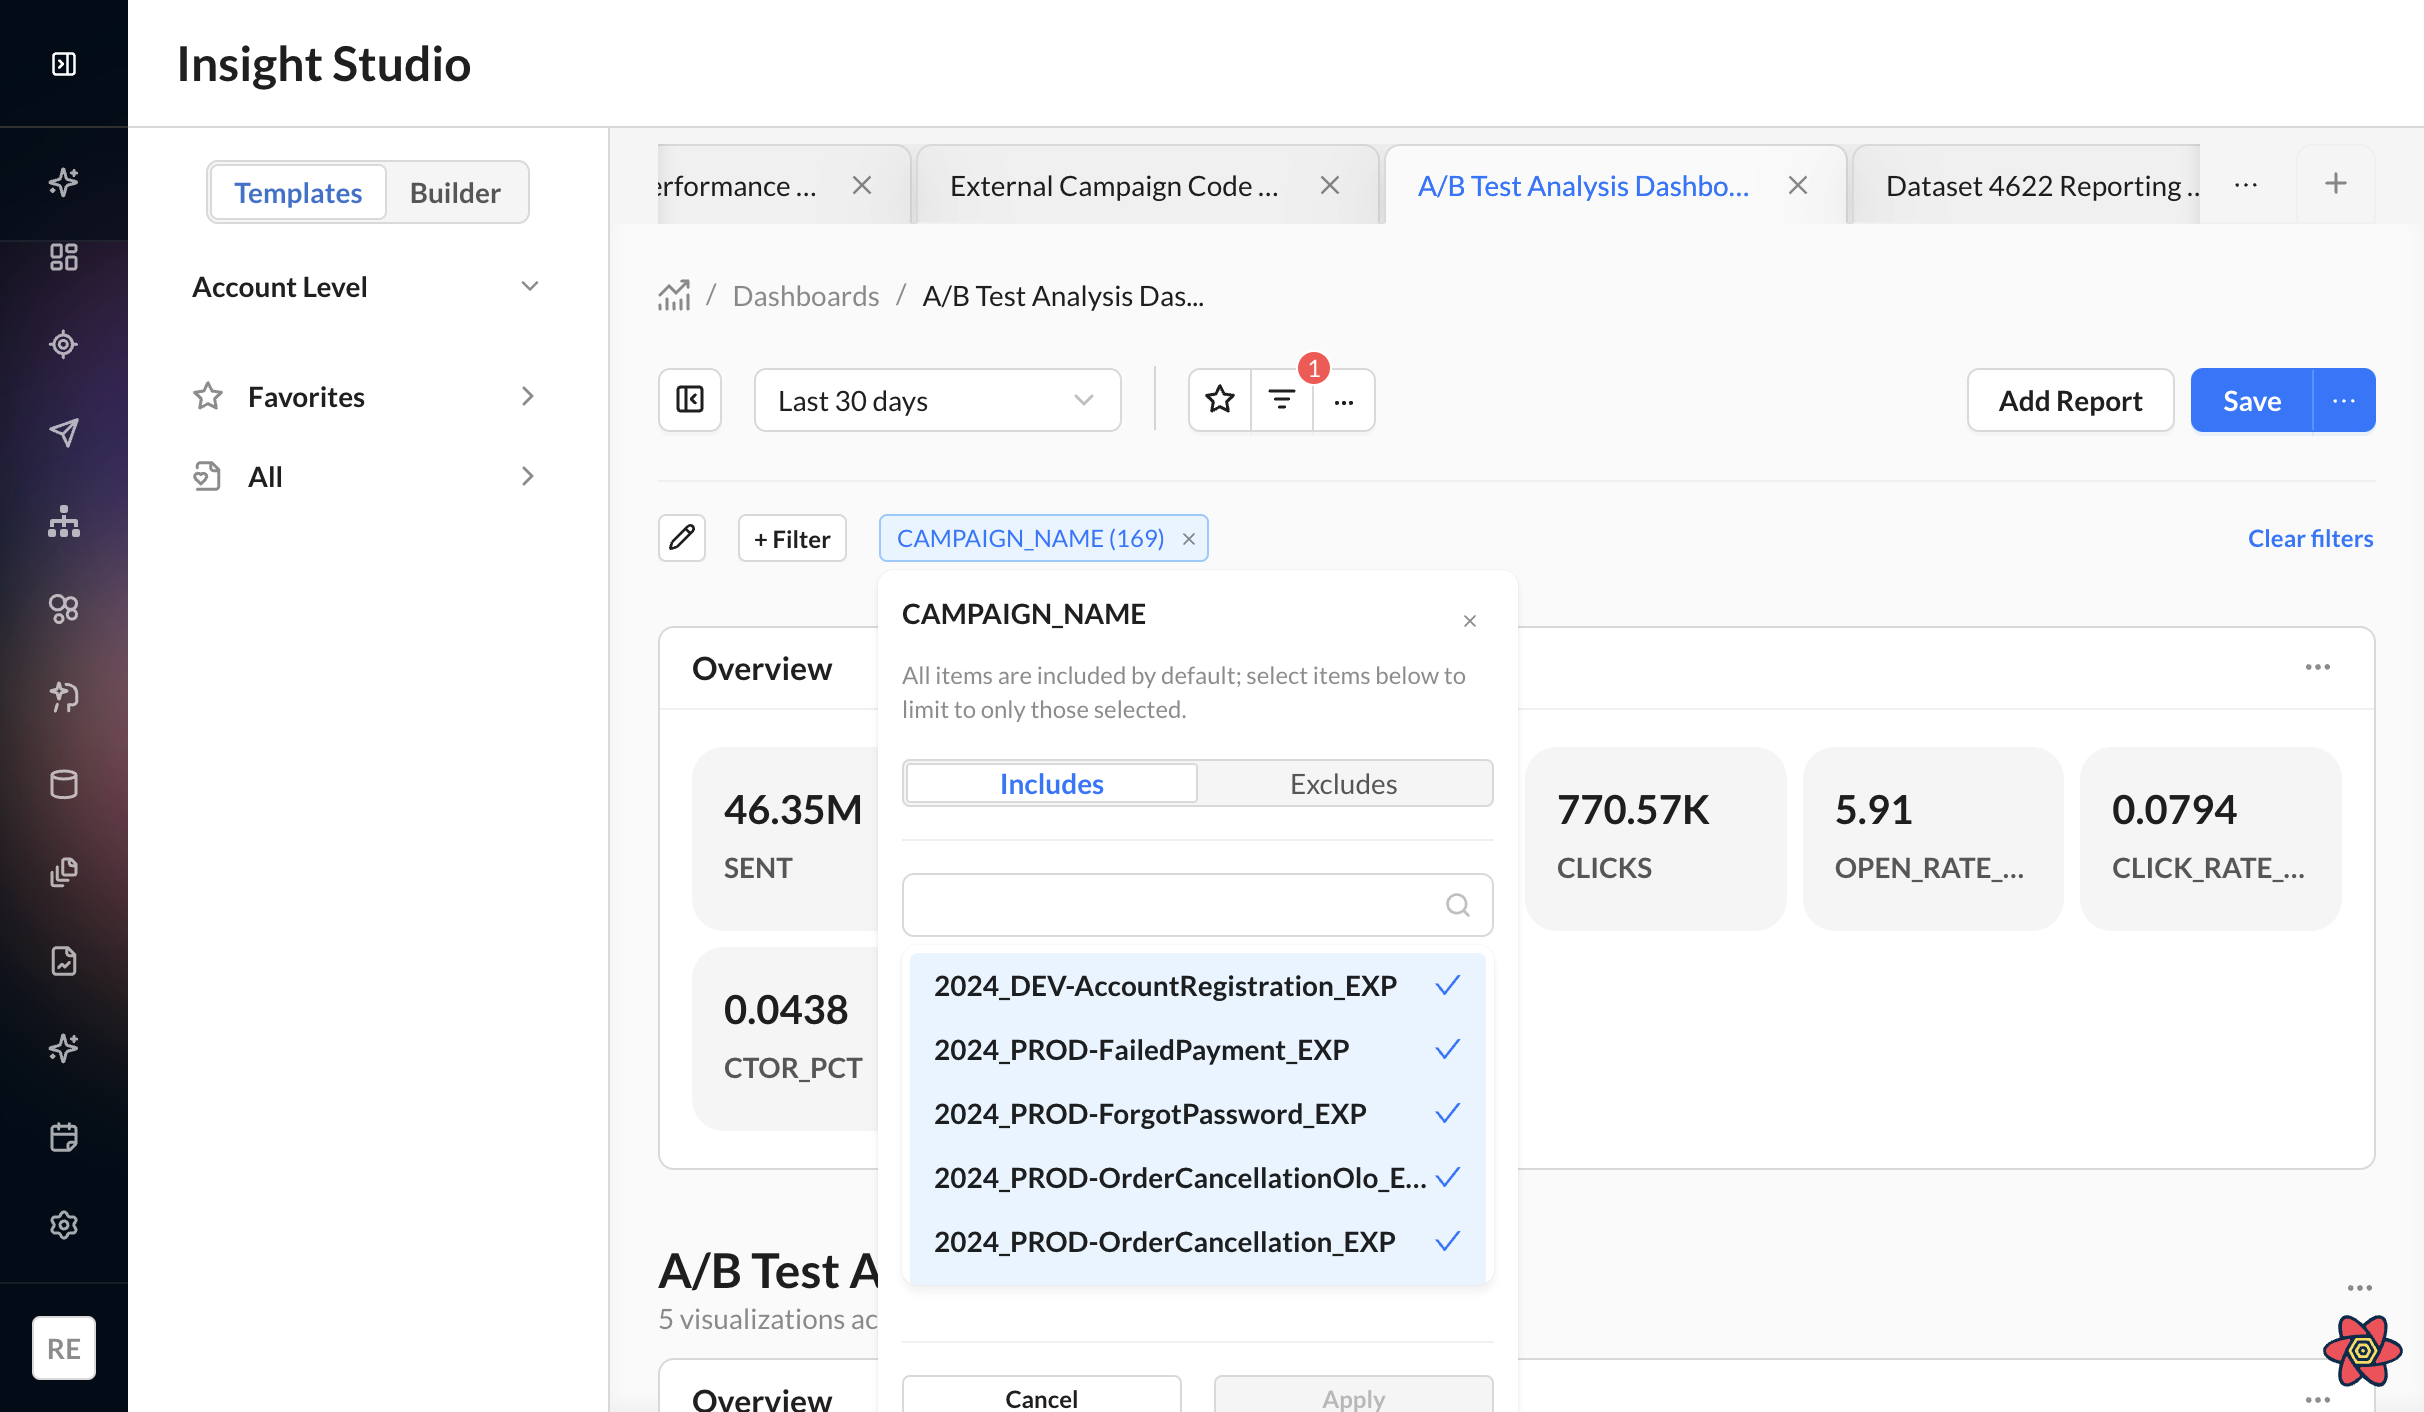
Available filter values are automatically scoped based on the filter logic configured by the dashboard owner. For example, if the owner configured a filter using “contains email", users only see values matching that criterion within the filter selection list.
Metric filters open a Range Filter popover instead, showing a numeric slider with min/max inputs. The slider bounds are derived from the operator values configured by the owner (e.g. 'in range 100–5000' becomes the slider's hard min and max).
Read-Only Mode
Dashboard owners and authorized Admin Users can place dashboards into Read-Only Mode to prevent structural edits while still allowing interactive filtering.
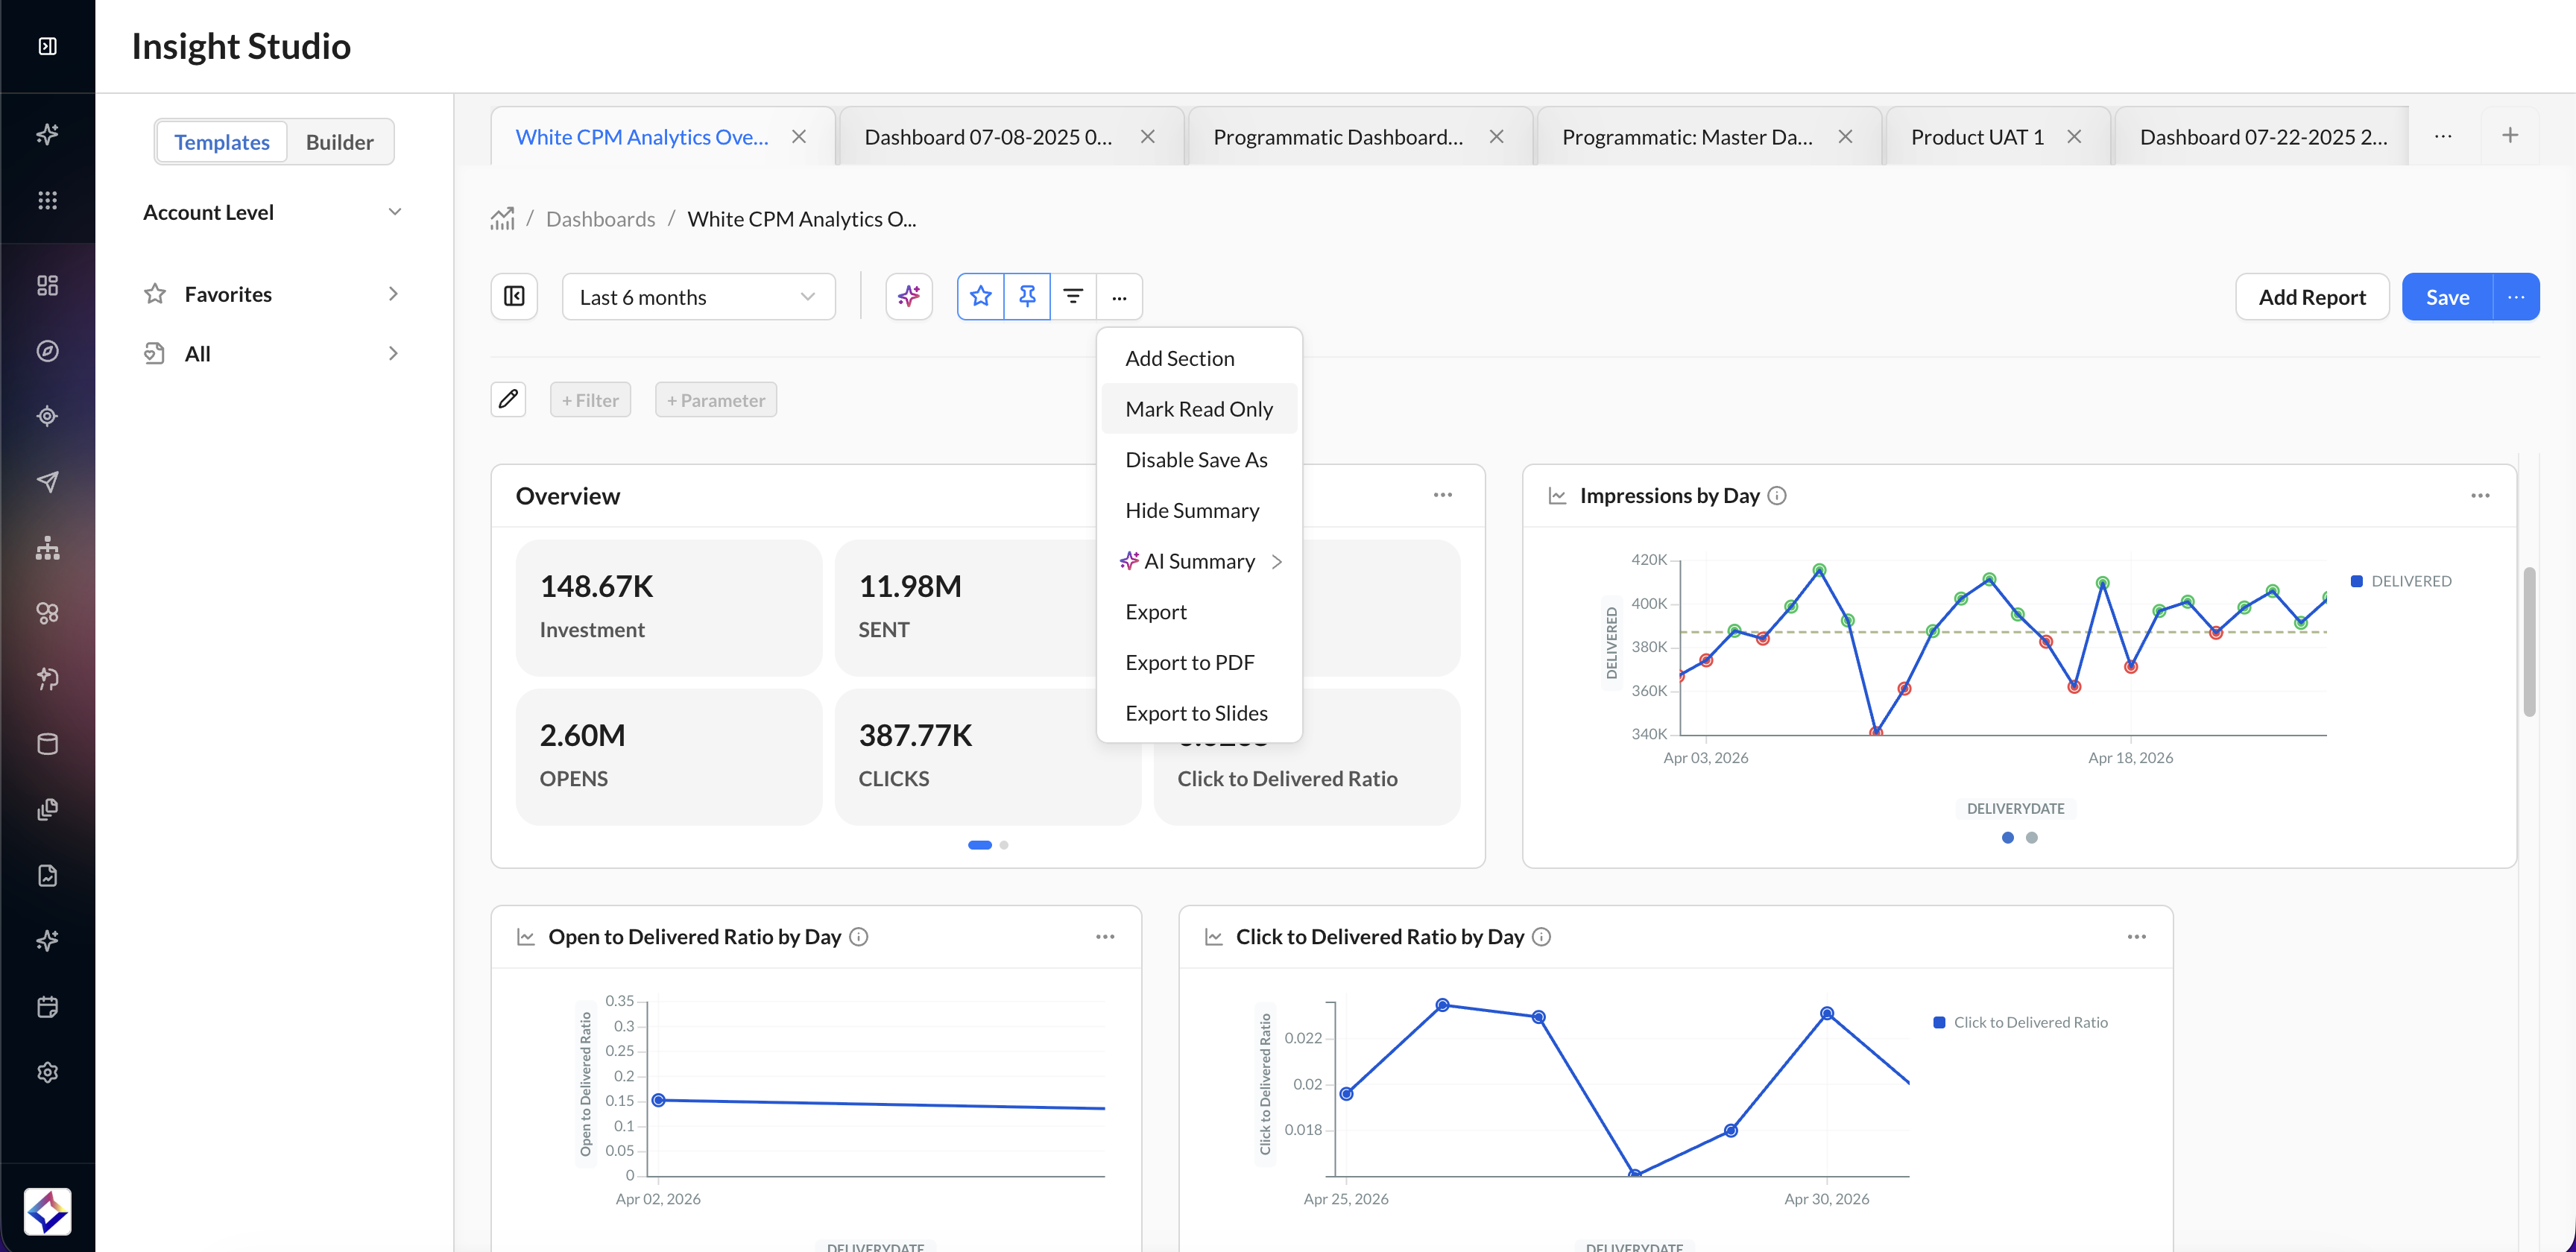
In Read-Only Mode:
-
Dashboard layouts cannot be modified
-
Widgets cannot be rearranged or removed
-
Filter configuration panels are hidden
-
Users can still apply In-View Filters through the Filter Tray
-
Dashboard interactions remain fully functional for exploration and analysis
This mode is designed to provide a safe, shareable dashboard experience for non-editor users.
Even when a dashboard is locked:
-
You can apply temporary filters
-
Filter changes remain session-based unless saved by an owner
-
Dashboard defaults remain unchanged
-
Viewers can reset filters at any time
Disable Save As
Dashboard owners and Admin Users can disable dashboard duplication using the Disable Save As option in the dashboard overflow menu.
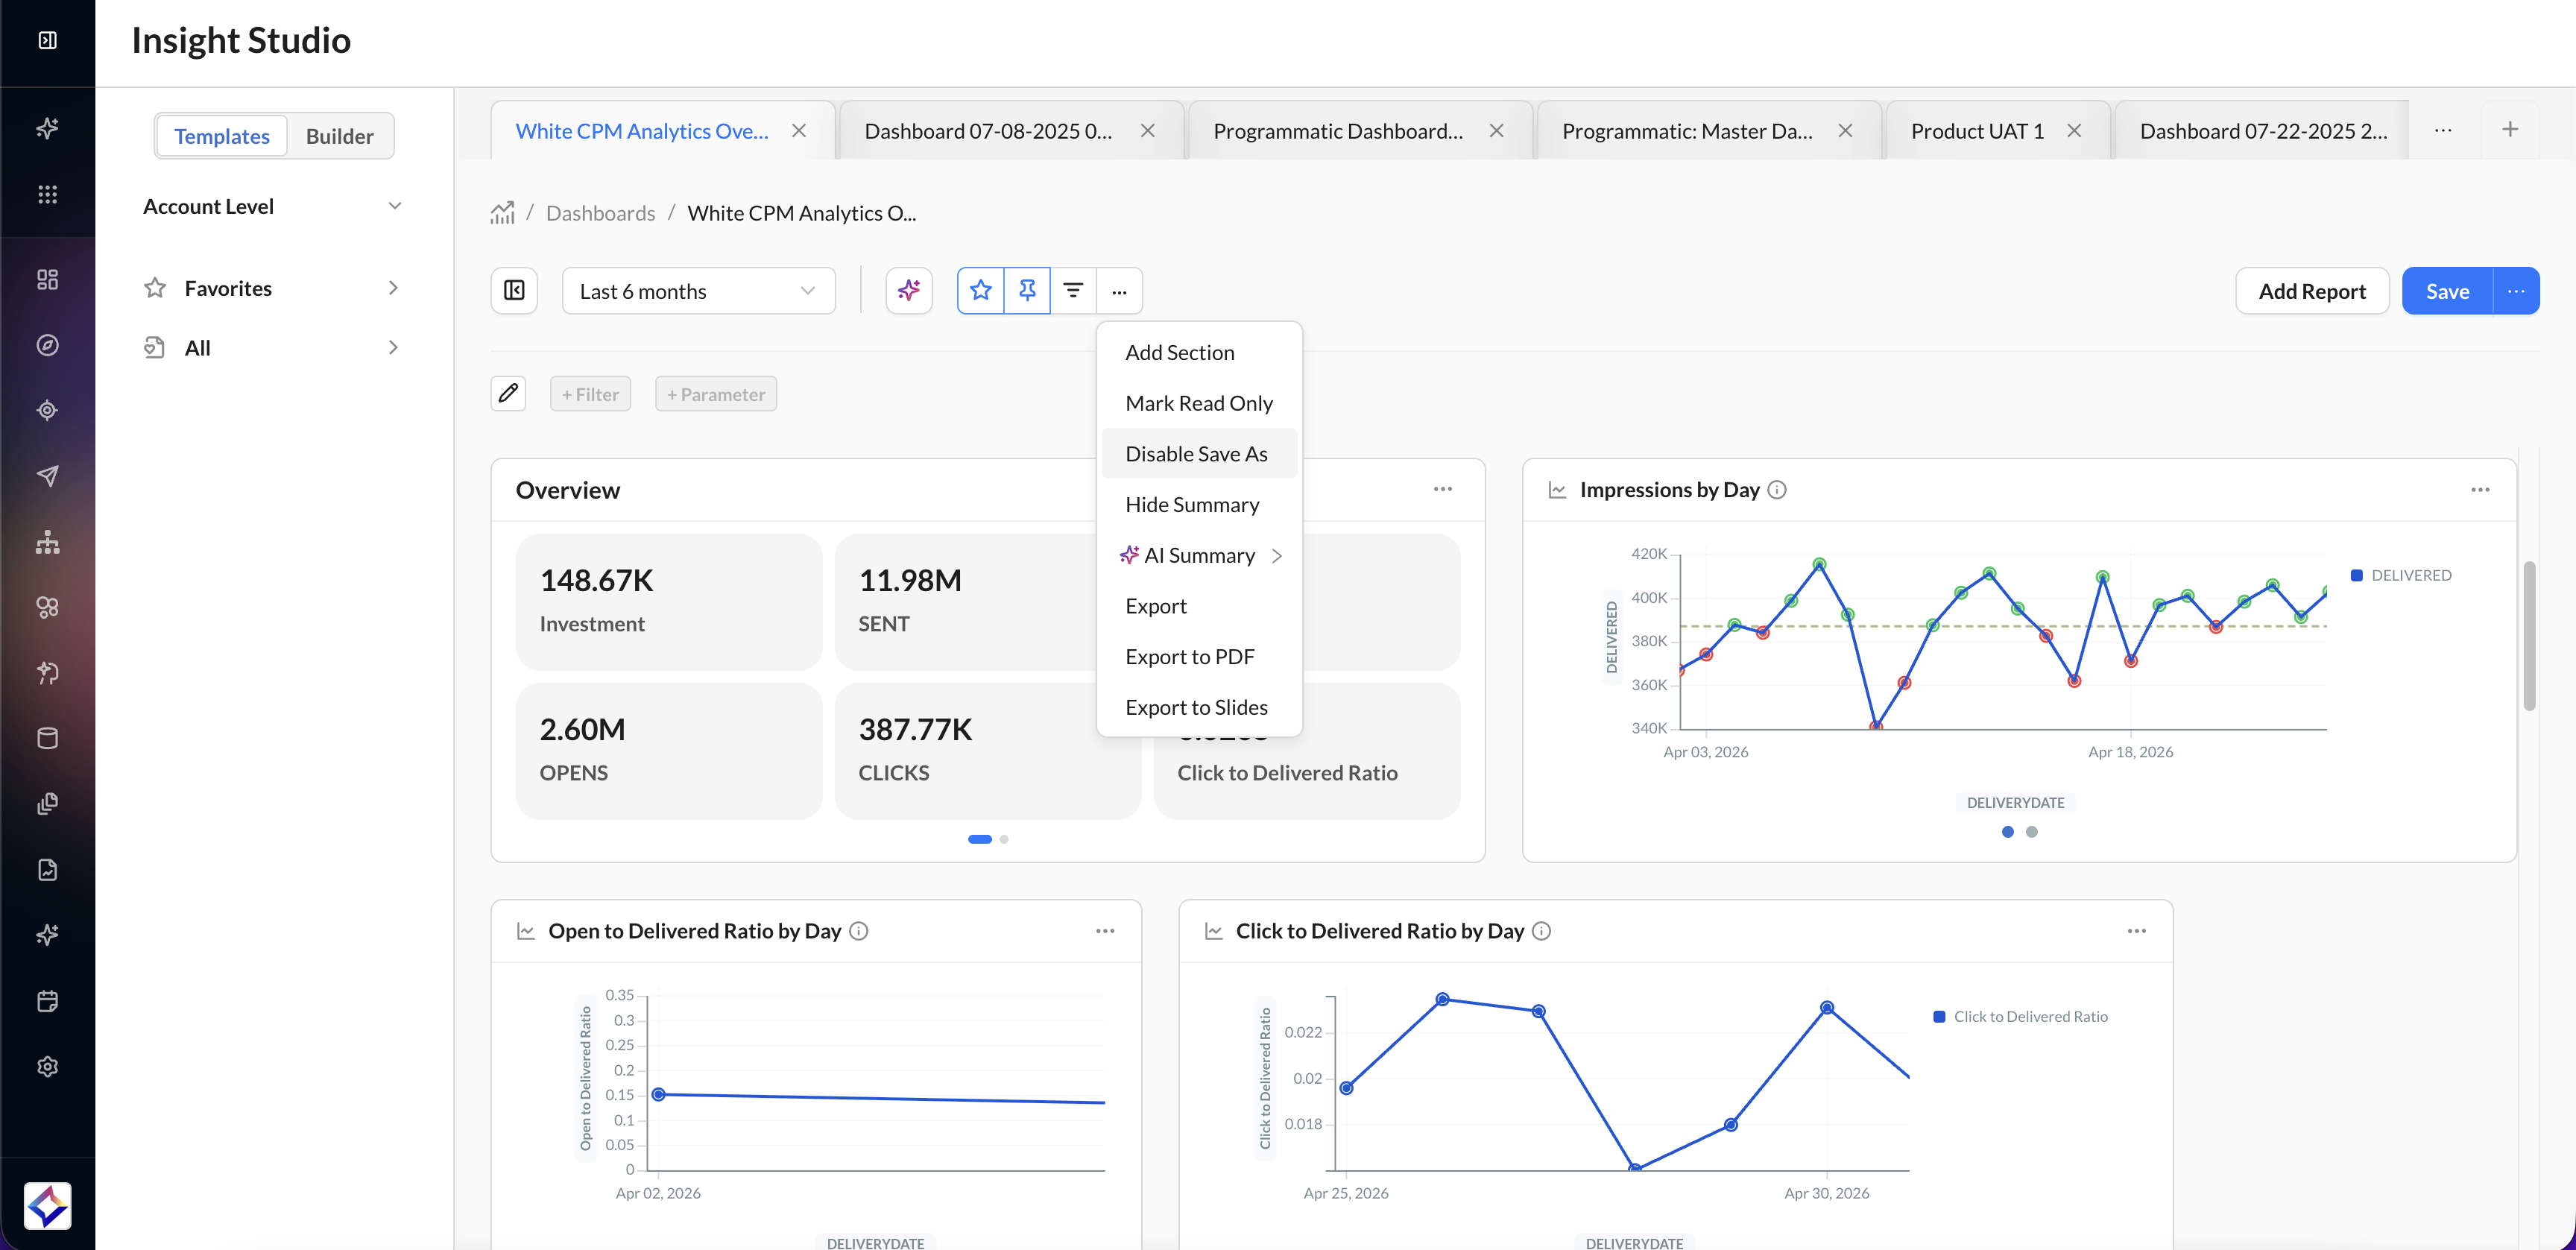
When enabled:
-
Non-owners cannot duplicate the dashboard
-
The dashboard automatically becomes read-only
-
The Save As action is disabled for viewers
-
Owners and Admin Users retain full editing access
This feature helps preserve governed dashboard experiences and prevents unauthorized copies.
Athena Briefs
Insight Studio dashboards support Athena briefs, which are AI-generated summaries, at both the dashboard and widget levels.
-20260701-184259.gif)
-
Athena briefs can be configured to display the insights and trends most relevant to your dashboard and visualization needs.
Athena Briefs are not available for dashboards in Read-Only mode.