

Pivot Tables help transform flat report data into an interactive cross-tabulated view, making it easier to compare metrics across dimensions such as Campaign, Channel, Audience Segment, or Date.
Pivot mode enables fast comparative analysis directly within Report Builder without exporting data externally.
Pivot Tables are available for Table widgets in both:
-
Report Builder
-
Dashboard views
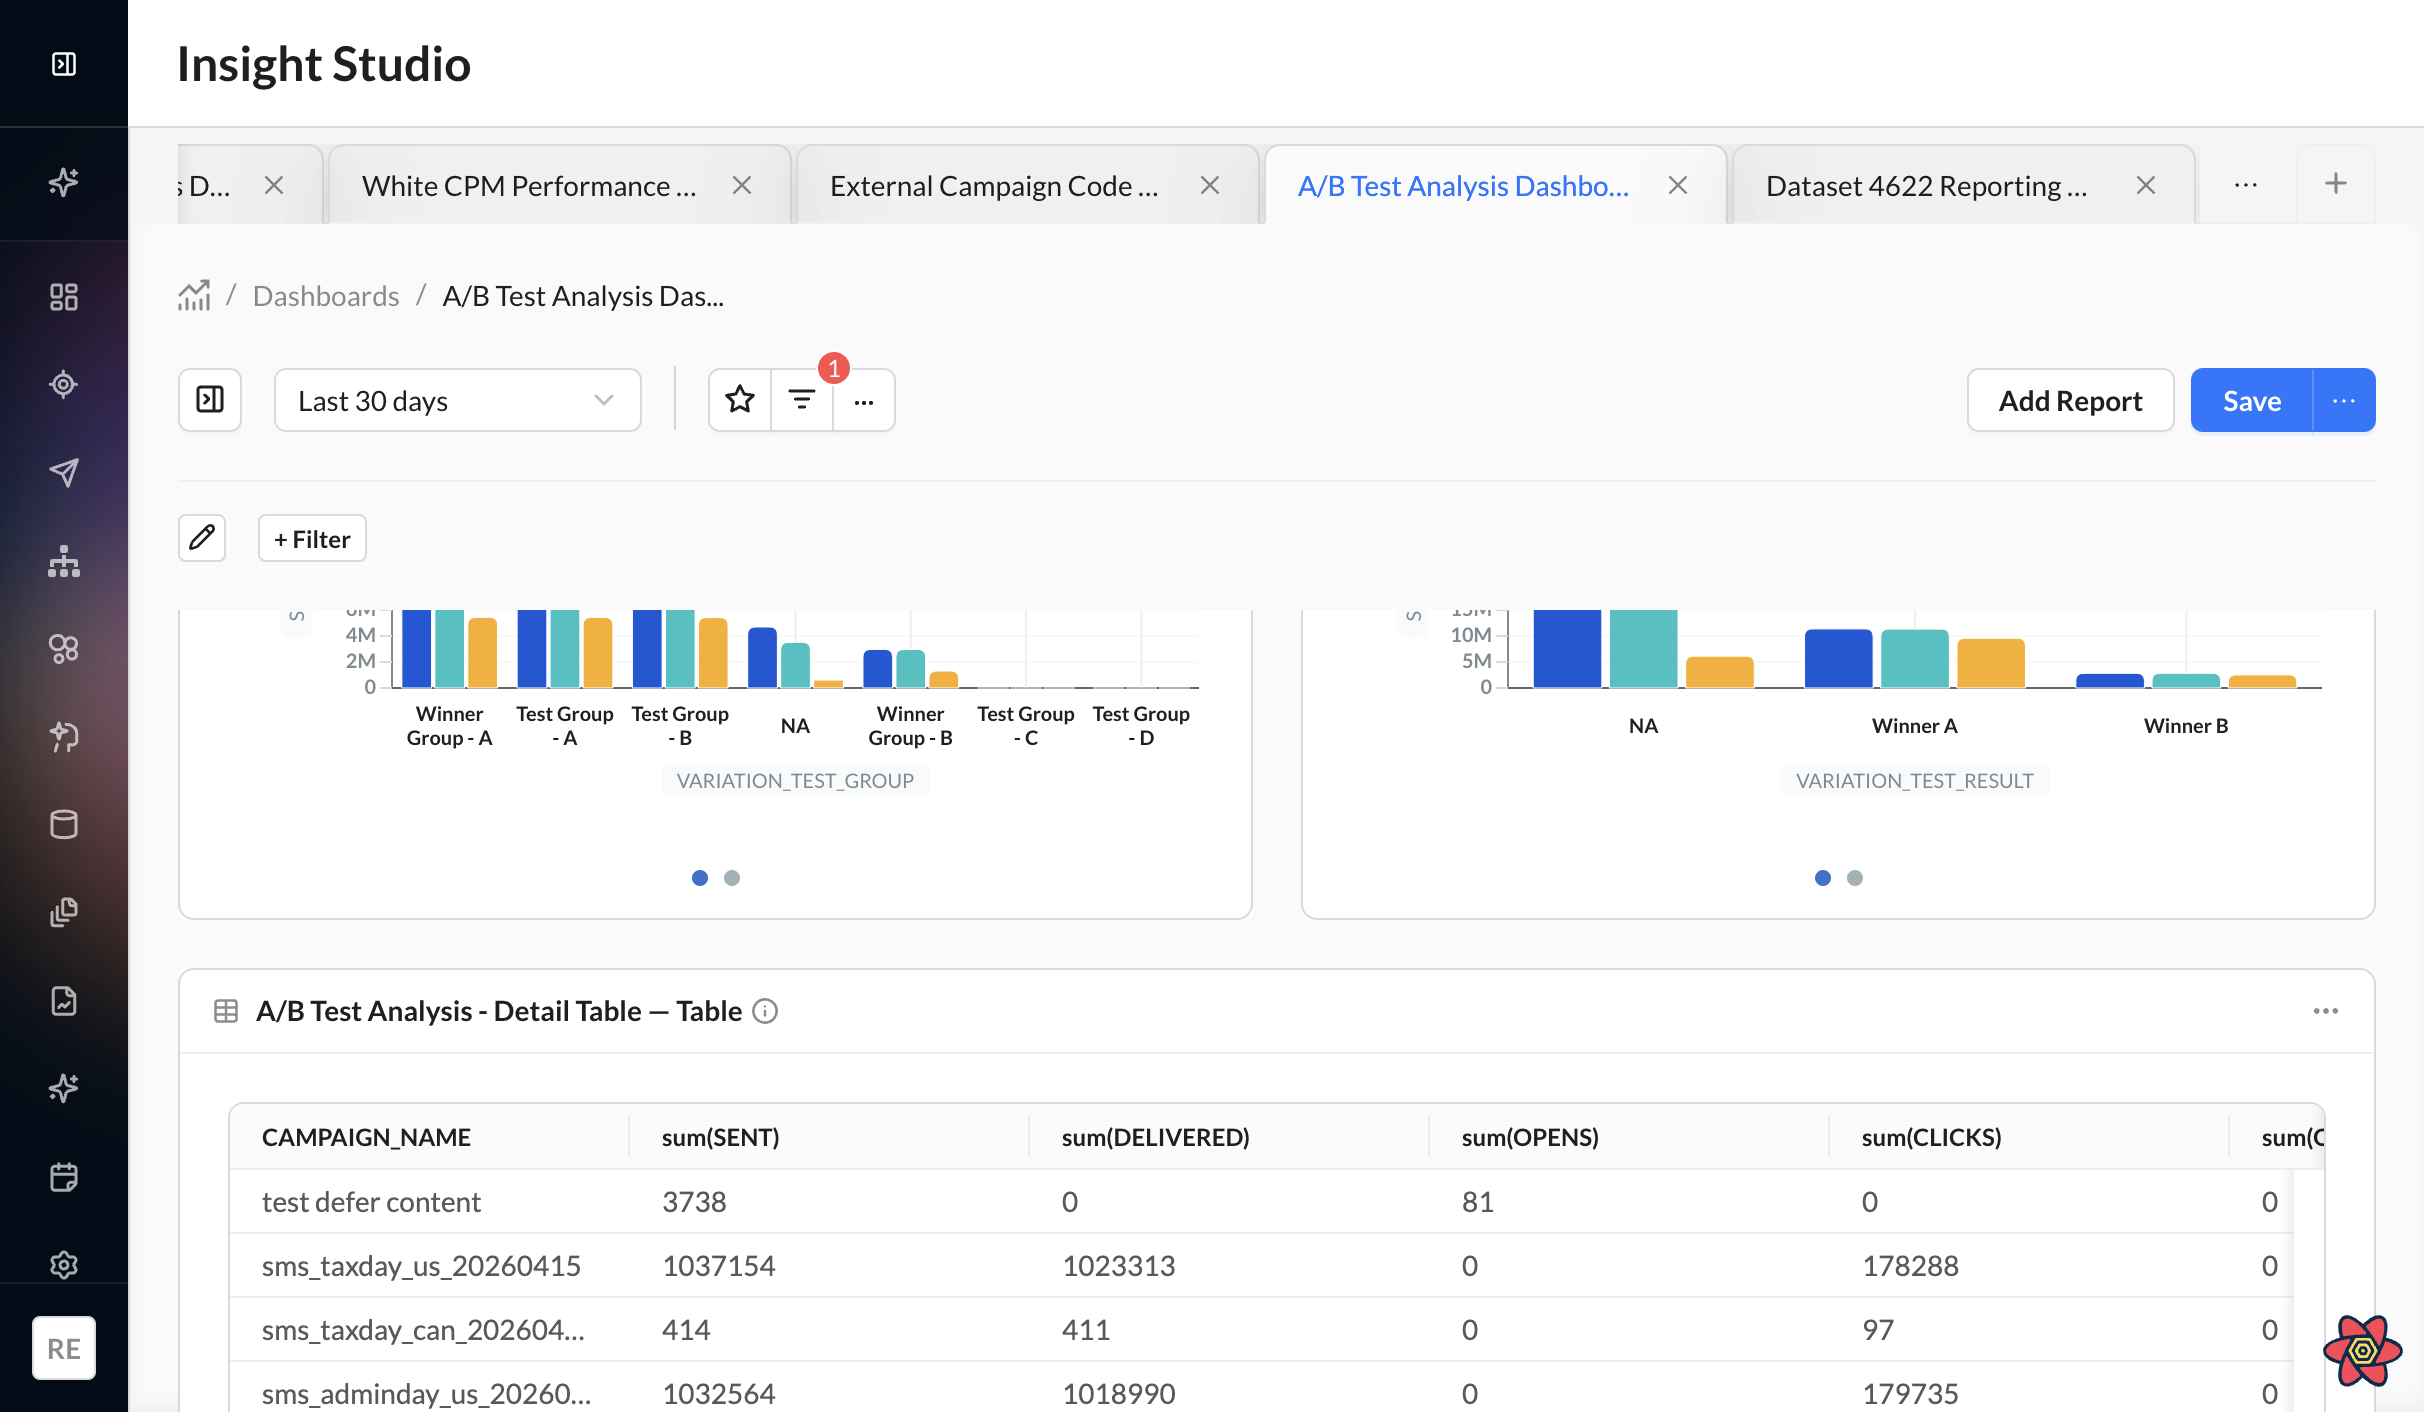
Standard Table vs Pivot Table
Standard Table
Displays data in a traditional tabular layout where:
-
Each row represents a record
-
Each column represents a metric or dimension
Pivot Table
Displays aggregated data across row and column groupings, helping identify trends and comparisons more easily.
Pivot Tables dynamically update based on:
-
Row Groups
-
Pivot Columns
-
Aggregated Metrics
Enabling Pivot Mode
To switch a table widget from Standard Table to Pivot Table,
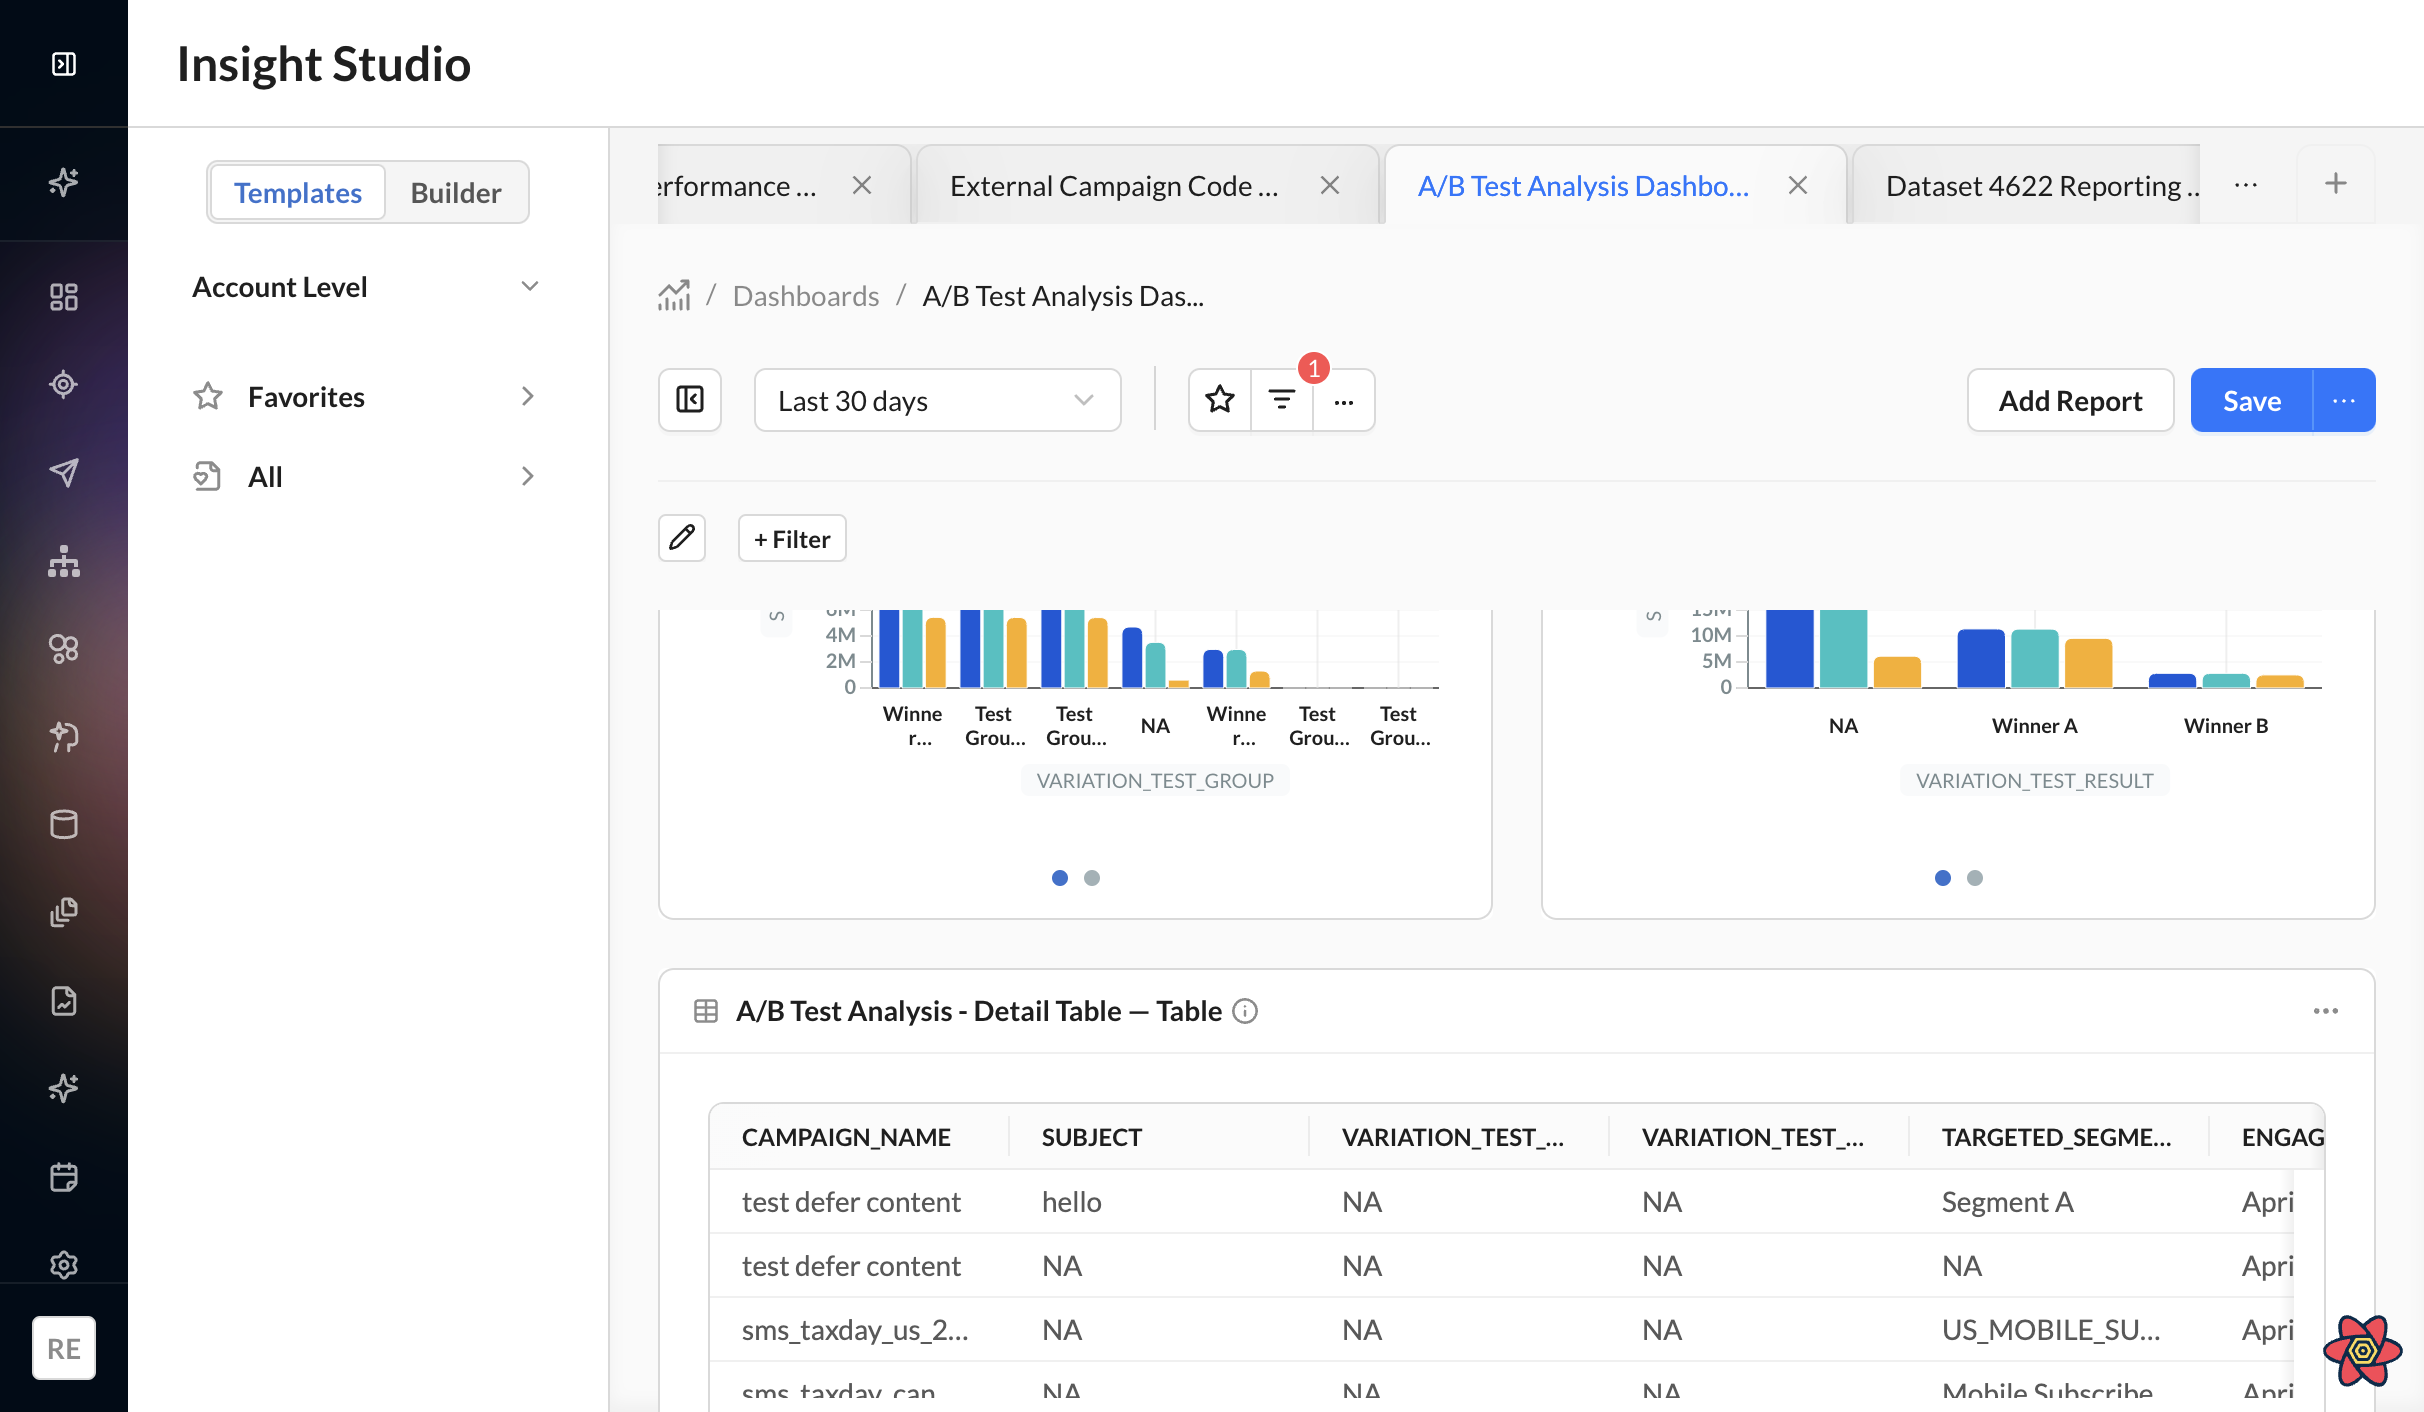
1. Hover over the widget tile to reveal the action bar.
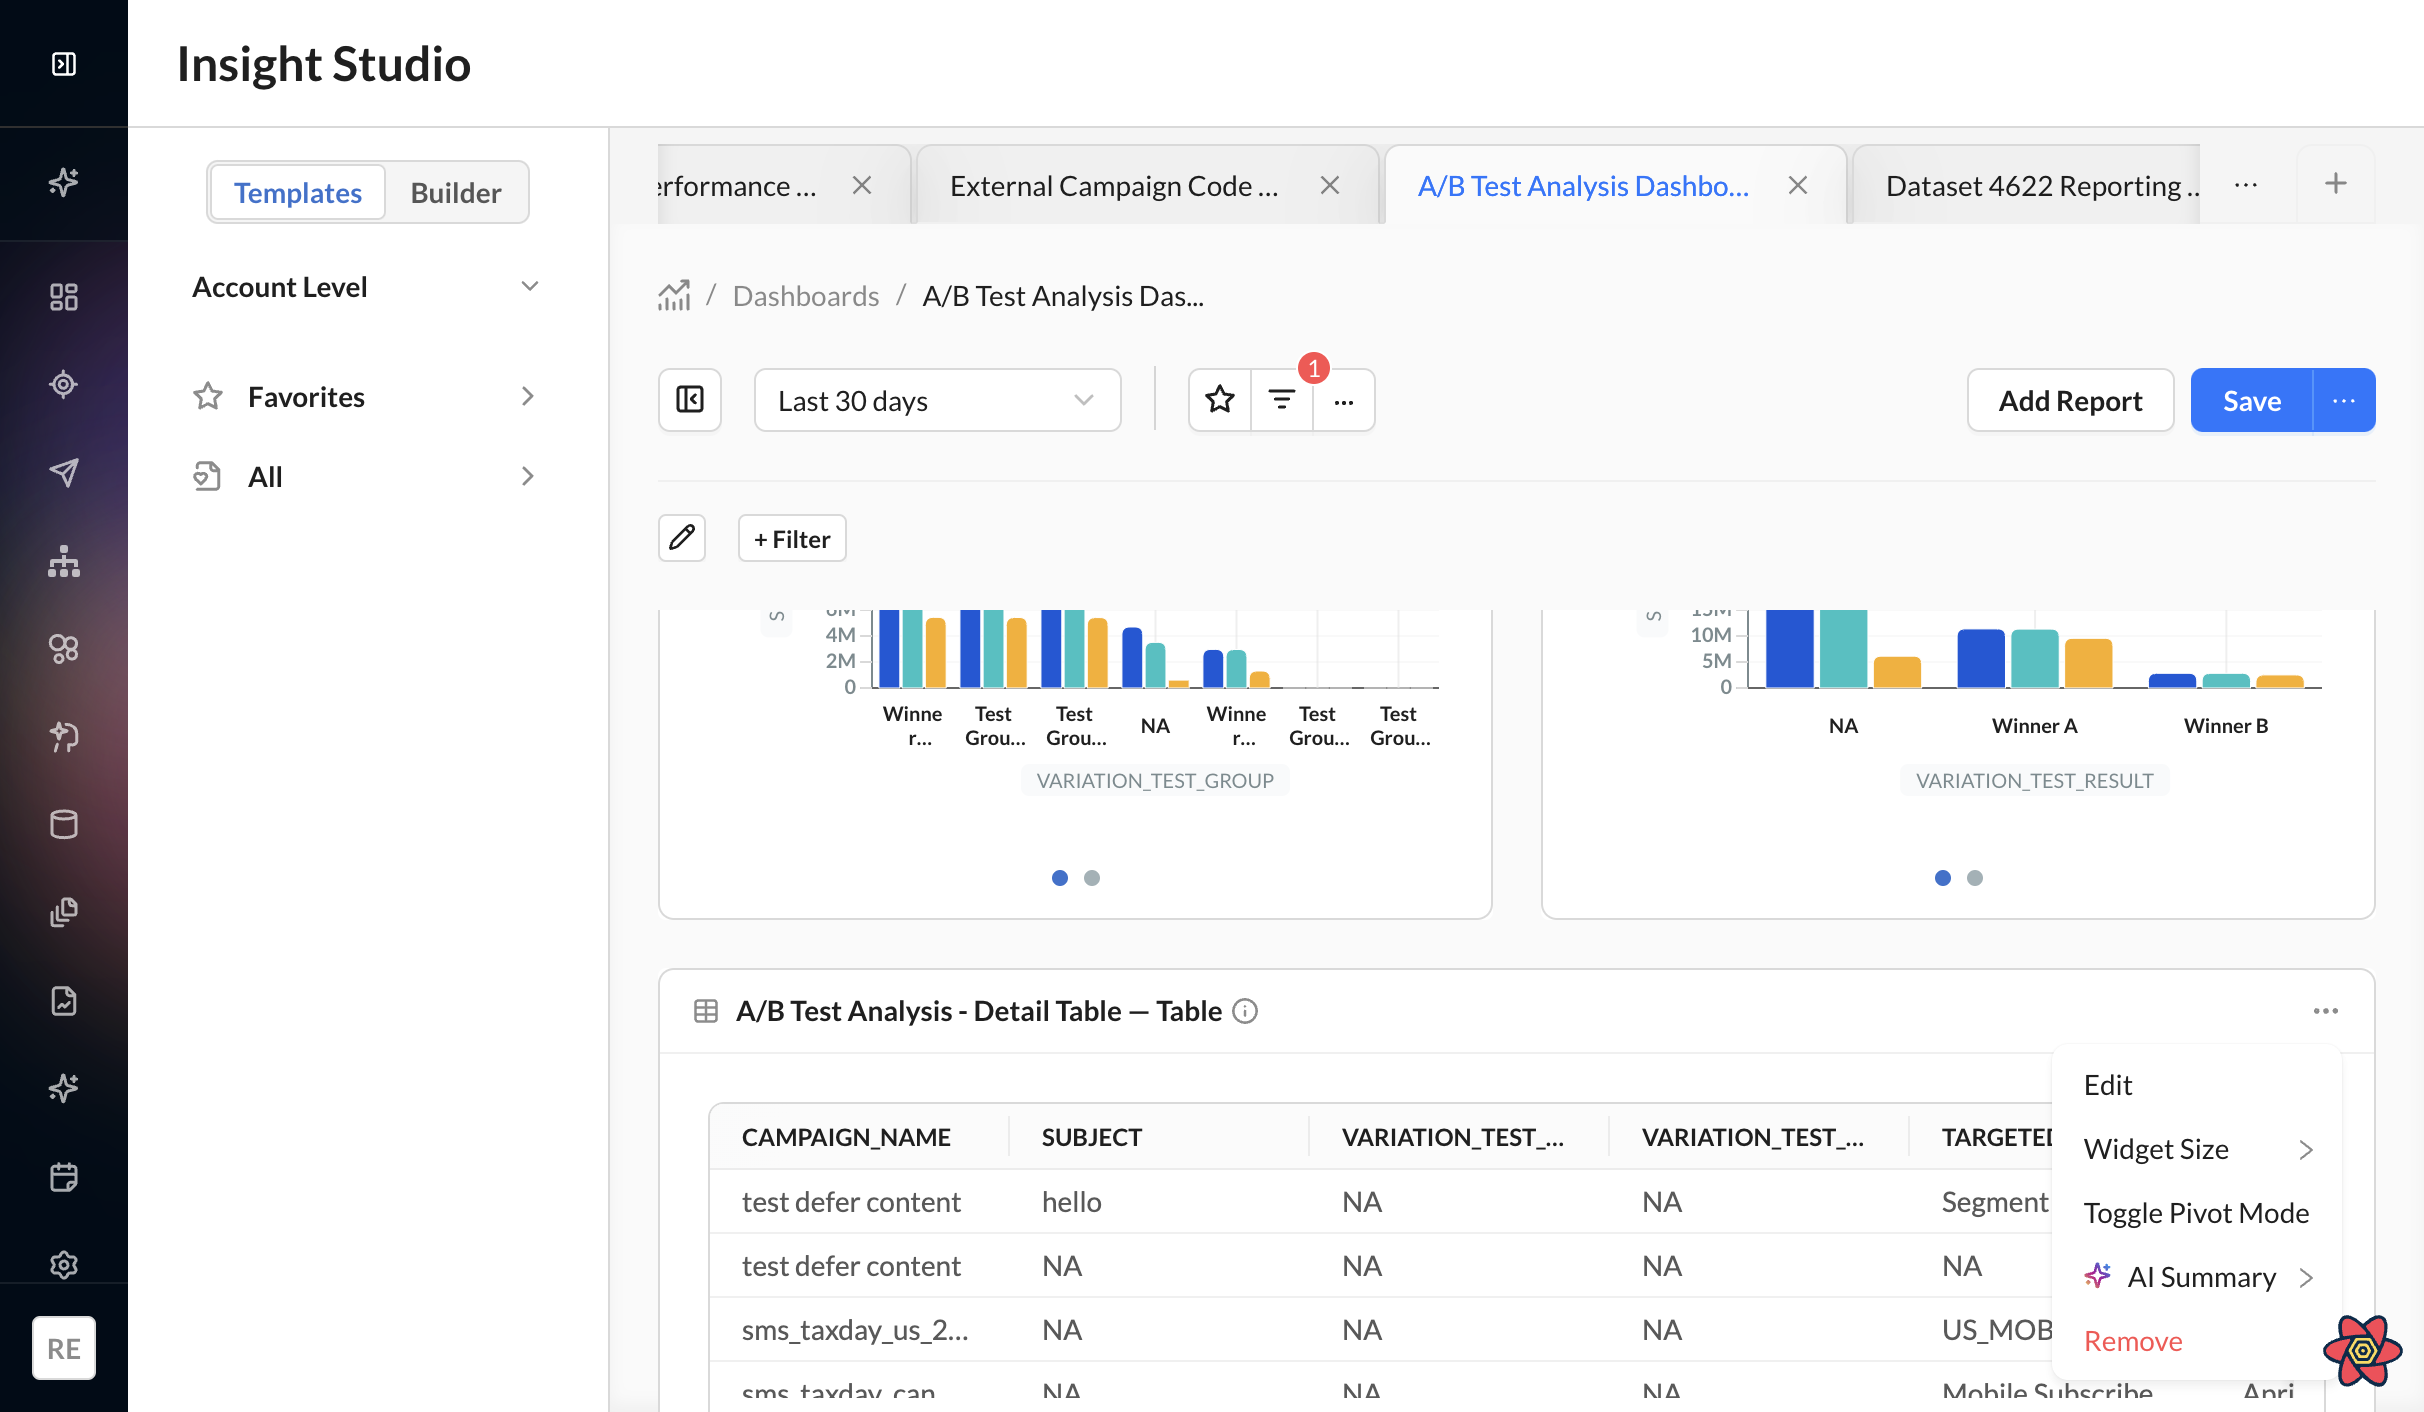
2. Click the ⋯ (three-dot) overflow menu icon in the top-right of the tile.
3. Select Toggle Pivot Mode from the dropdown.
-20260518-101127.gif?cb=11fcee8600e03b907017f3fb8aa9d1aa)
-
The widget will reload in Pivot Table mode.
-
To return to Standard Table mode, open the same menu and select Toggle Standard Mode
Pivot functionality is supported only for Table Widgets in Report Builder and Dashboard views.
Pivot Table Layout
Pivot Tables are built using three core areas:
|
Area |
Purpose |
|---|---|
|
Row Groups |
Organizes rows using dimensions |
|
Pivot Columns |
Creates dynamic column headers |
|
Values |
Displays aggregated metrics |
Configuring a Pivot Table
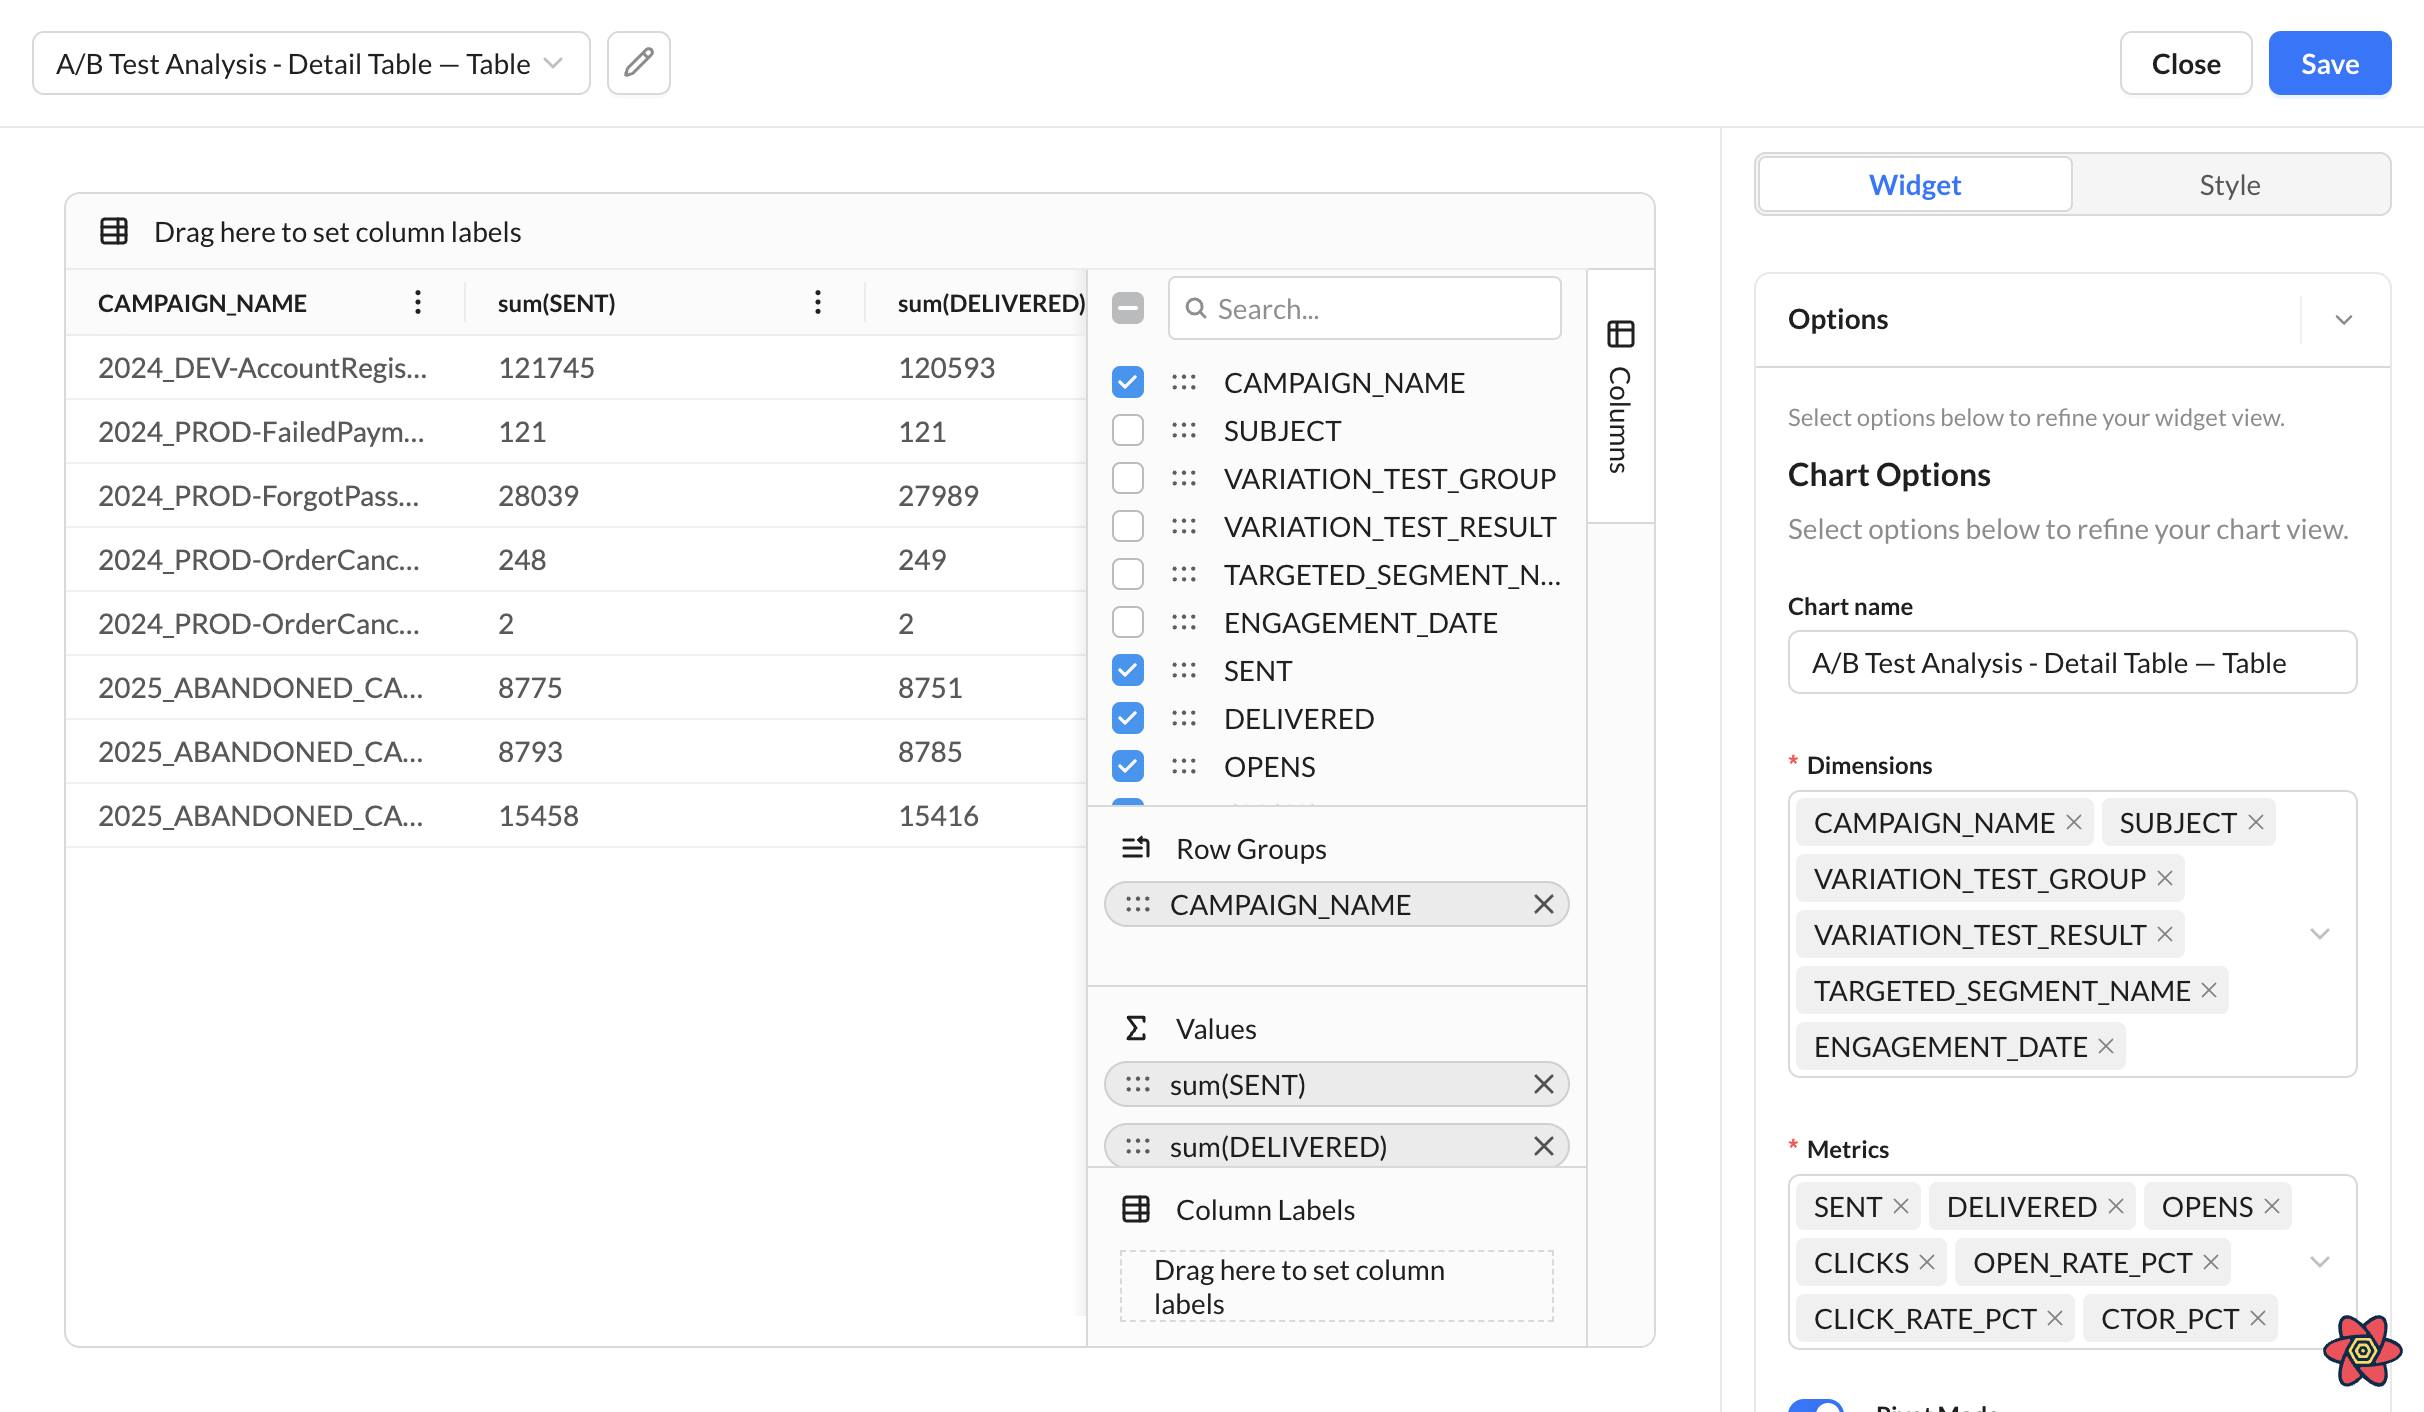
The most advanced editing experience is available in the full-screen table editor.
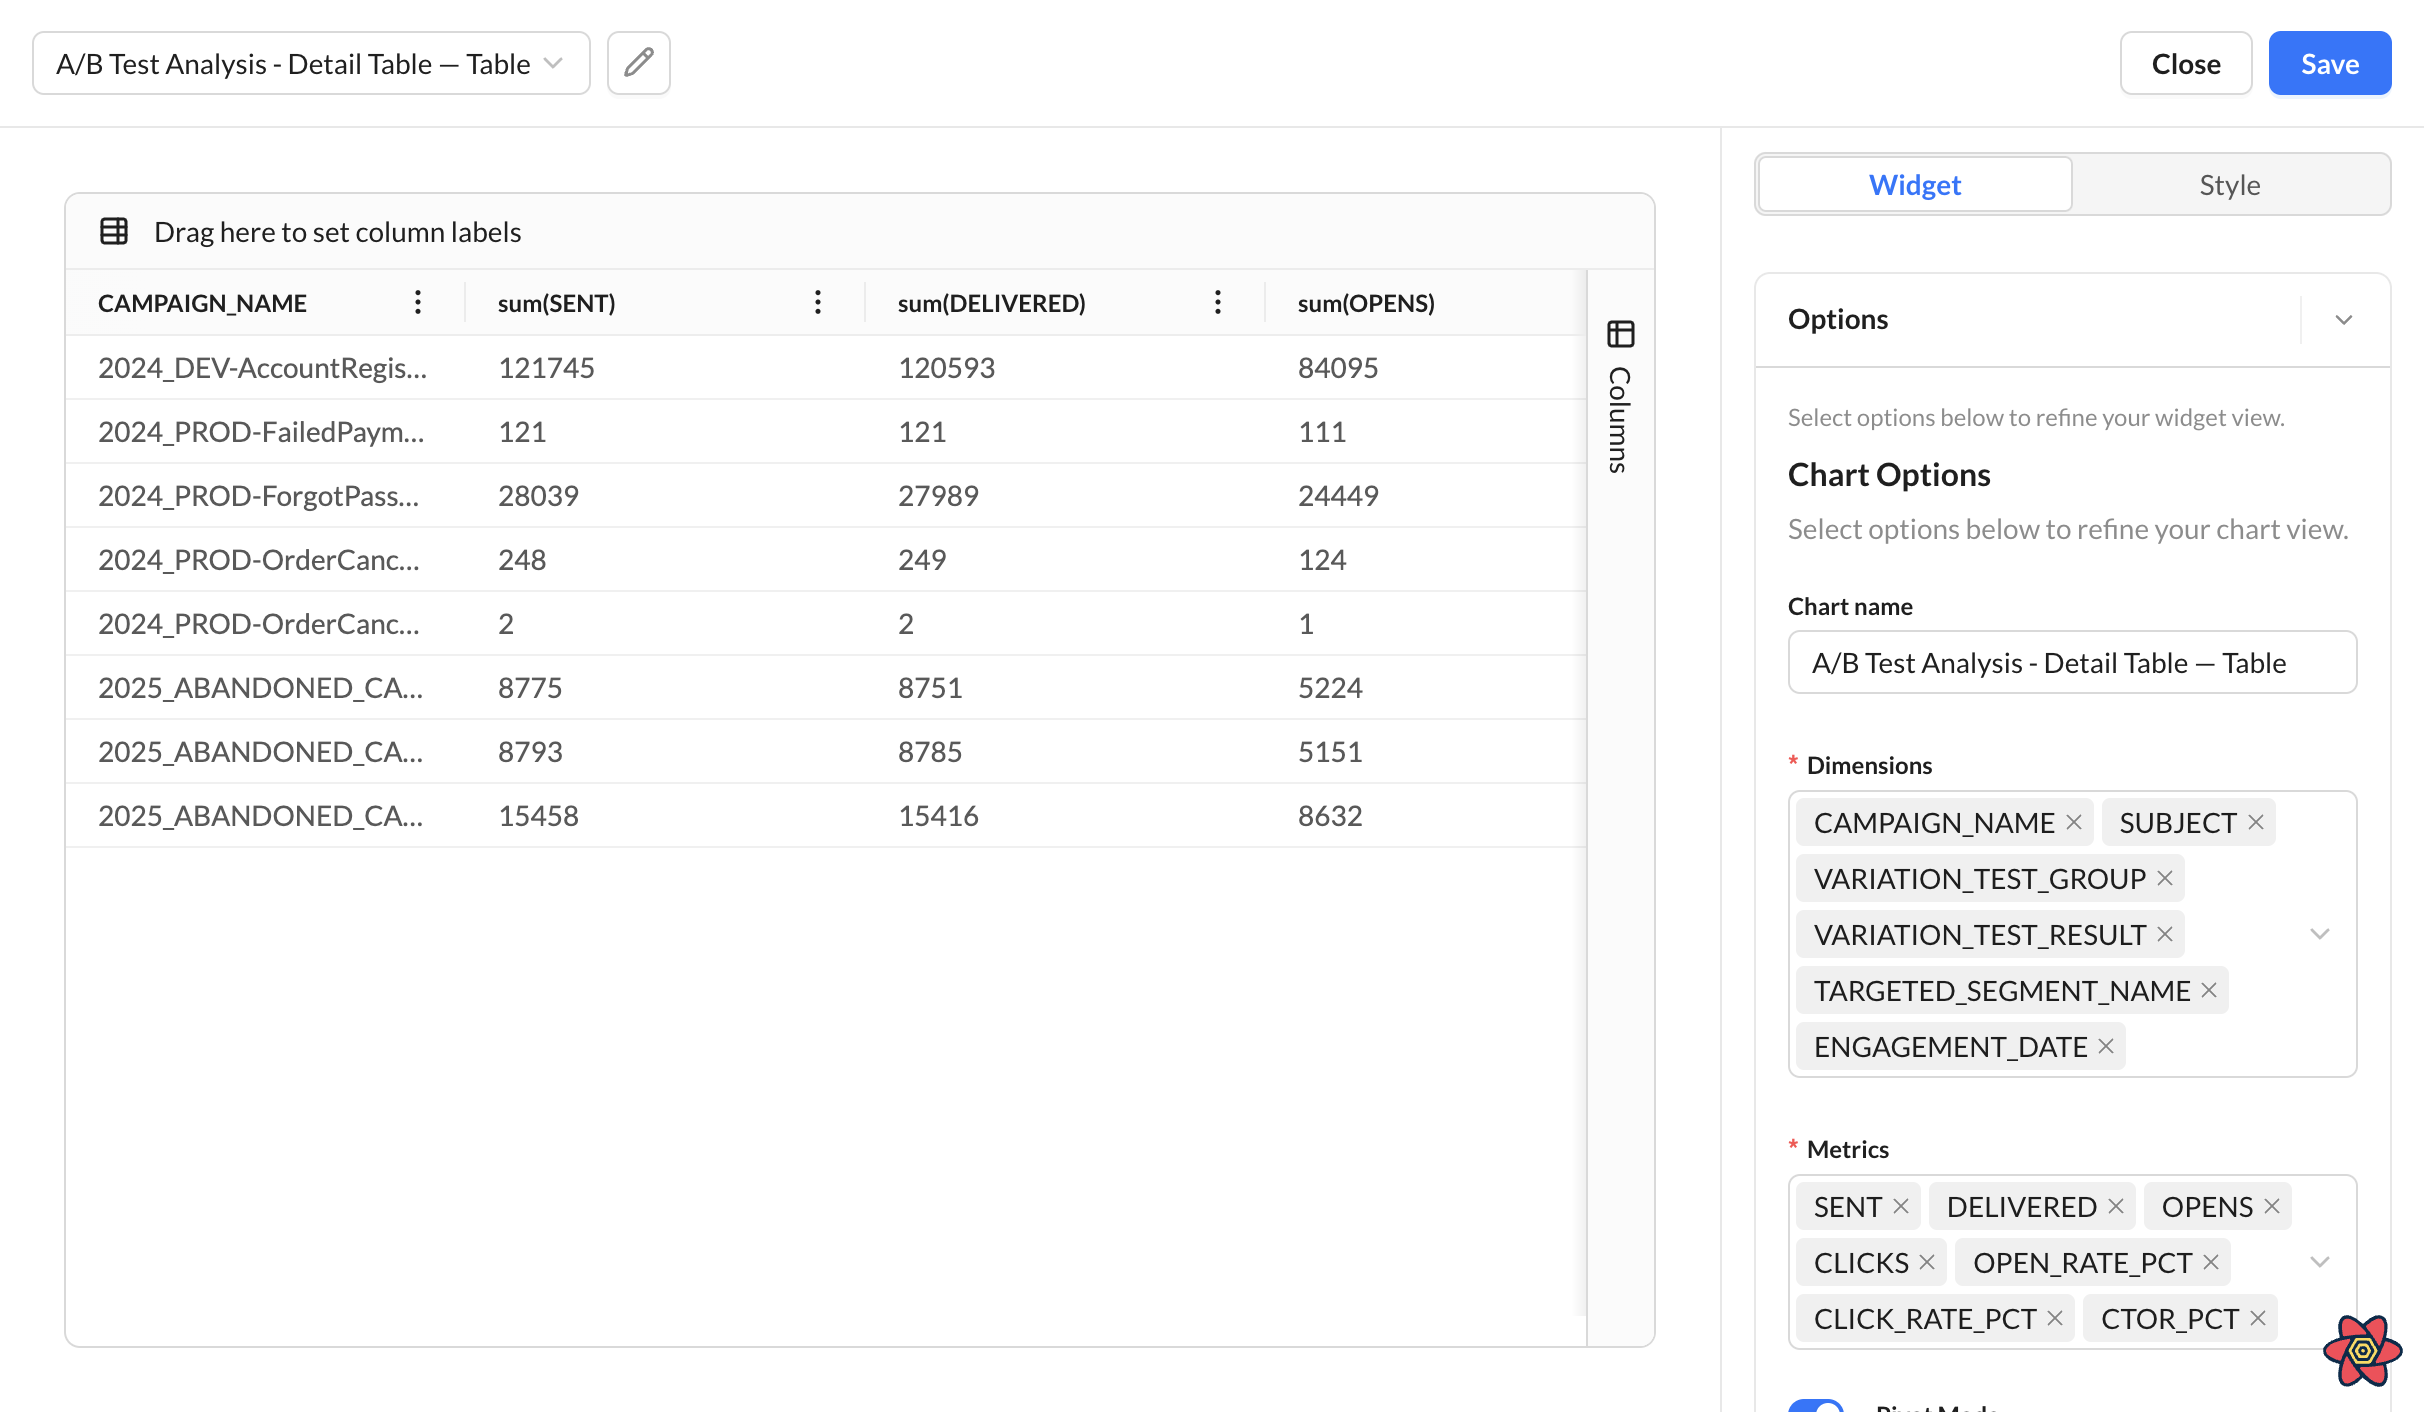
To configure a Pivot Table:
1. Open the widget in full-screen mode.
2. Use the Columns Panel to drag and organize fields.
3. Add:
-
Dimensions into Row Groups or Pivot Columns
-
Metrics into Values
Changes are reflected immediately in the table preview.
Row Groups
Row Groups define how records are organized vertically.
Examples:
-
Campaign
-
Audience Segment
-
Region
Multiple Row Groups can create hierarchical views for deeper analysis.
Pivot Columns
Pivot Columns define the horizontal grouping structure.
Examples:
-
Date
-
Channel
-
Device Type
Distinct values automatically become column headers.
Metric Aggregations
Values in Pivot Tables are aggregated automatically using supported functions.
|
Function |
Description |
|---|---|
|
Sum |
Adds all values |
|
Count |
Counts records |
|
Average |
Calculates the mean value |
|
Min |
Displays the smallest value |
|
Max |
Displays the largest value |
Configuration Limits
To maintain readability and performance, Pivot Tables support:
|
Configuration |
Maximum |
|---|---|
|
Row Groups |
3 |
|
Pivot Columns |
2 |
|
Metric Values |
10 |
Saving Pivot Configurations
Pivot settings are saved with the widget, including:
-
Pivot mode
-
Row groups
-
Pivot columns
-
Aggregated metrics
Saved configurations automatically reload when reopening the report or dashboard.
Exporting Pivot Tables
Pivot Tables support exporting the current view to:
-
CSV
-
Excel
Exports preserve the pivoted structure and layout visible in the table.
Best Practices
-
Use Row Groups for hierarchical organization.
-
Use Pivot Columns for side-by-side comparisons.
-
Keep the number of metrics focused for easier readability.
-
Use full-screen editing for more advanced configurations.
-
Export Pivot Tables when sharing summarized insights externally.