Skip table of contents

Insights Studio

image-20250721-135638.png

In a world awash with data, making the right decisions hinges on how well you understand it. Reporting has long been the cornerstone of performance analysis, helping teams uncover the why behind outcomes and identify the what’s next. It starts with collecting and reviewing key information across specific functional areas where performance can be measured, analyzed, and improved. From this analysis, actionable insights emerge, empowering users to diagnose problems and craft effective solutions.

Enter Insights Studio, ZMP’s dynamic, self-serve reporting tool built to put the power of data exploration directly into your hands. Whether you're tracking customer engagement, analyzing programmatic performance, diving into prospect marketing, or understanding website behavior, Insights Studio enables you to build customized reports across all of it. You can choose from hundreds of metrics and dimensions, apply robust filters, and define fixed or dynamic date ranges, all while visualizing your data in a way that’s both meaningful and easy on the eyes.

With Insights Studio, it’s not just about seeing the data. It’s about seeing what matters.


Understanding the Layout

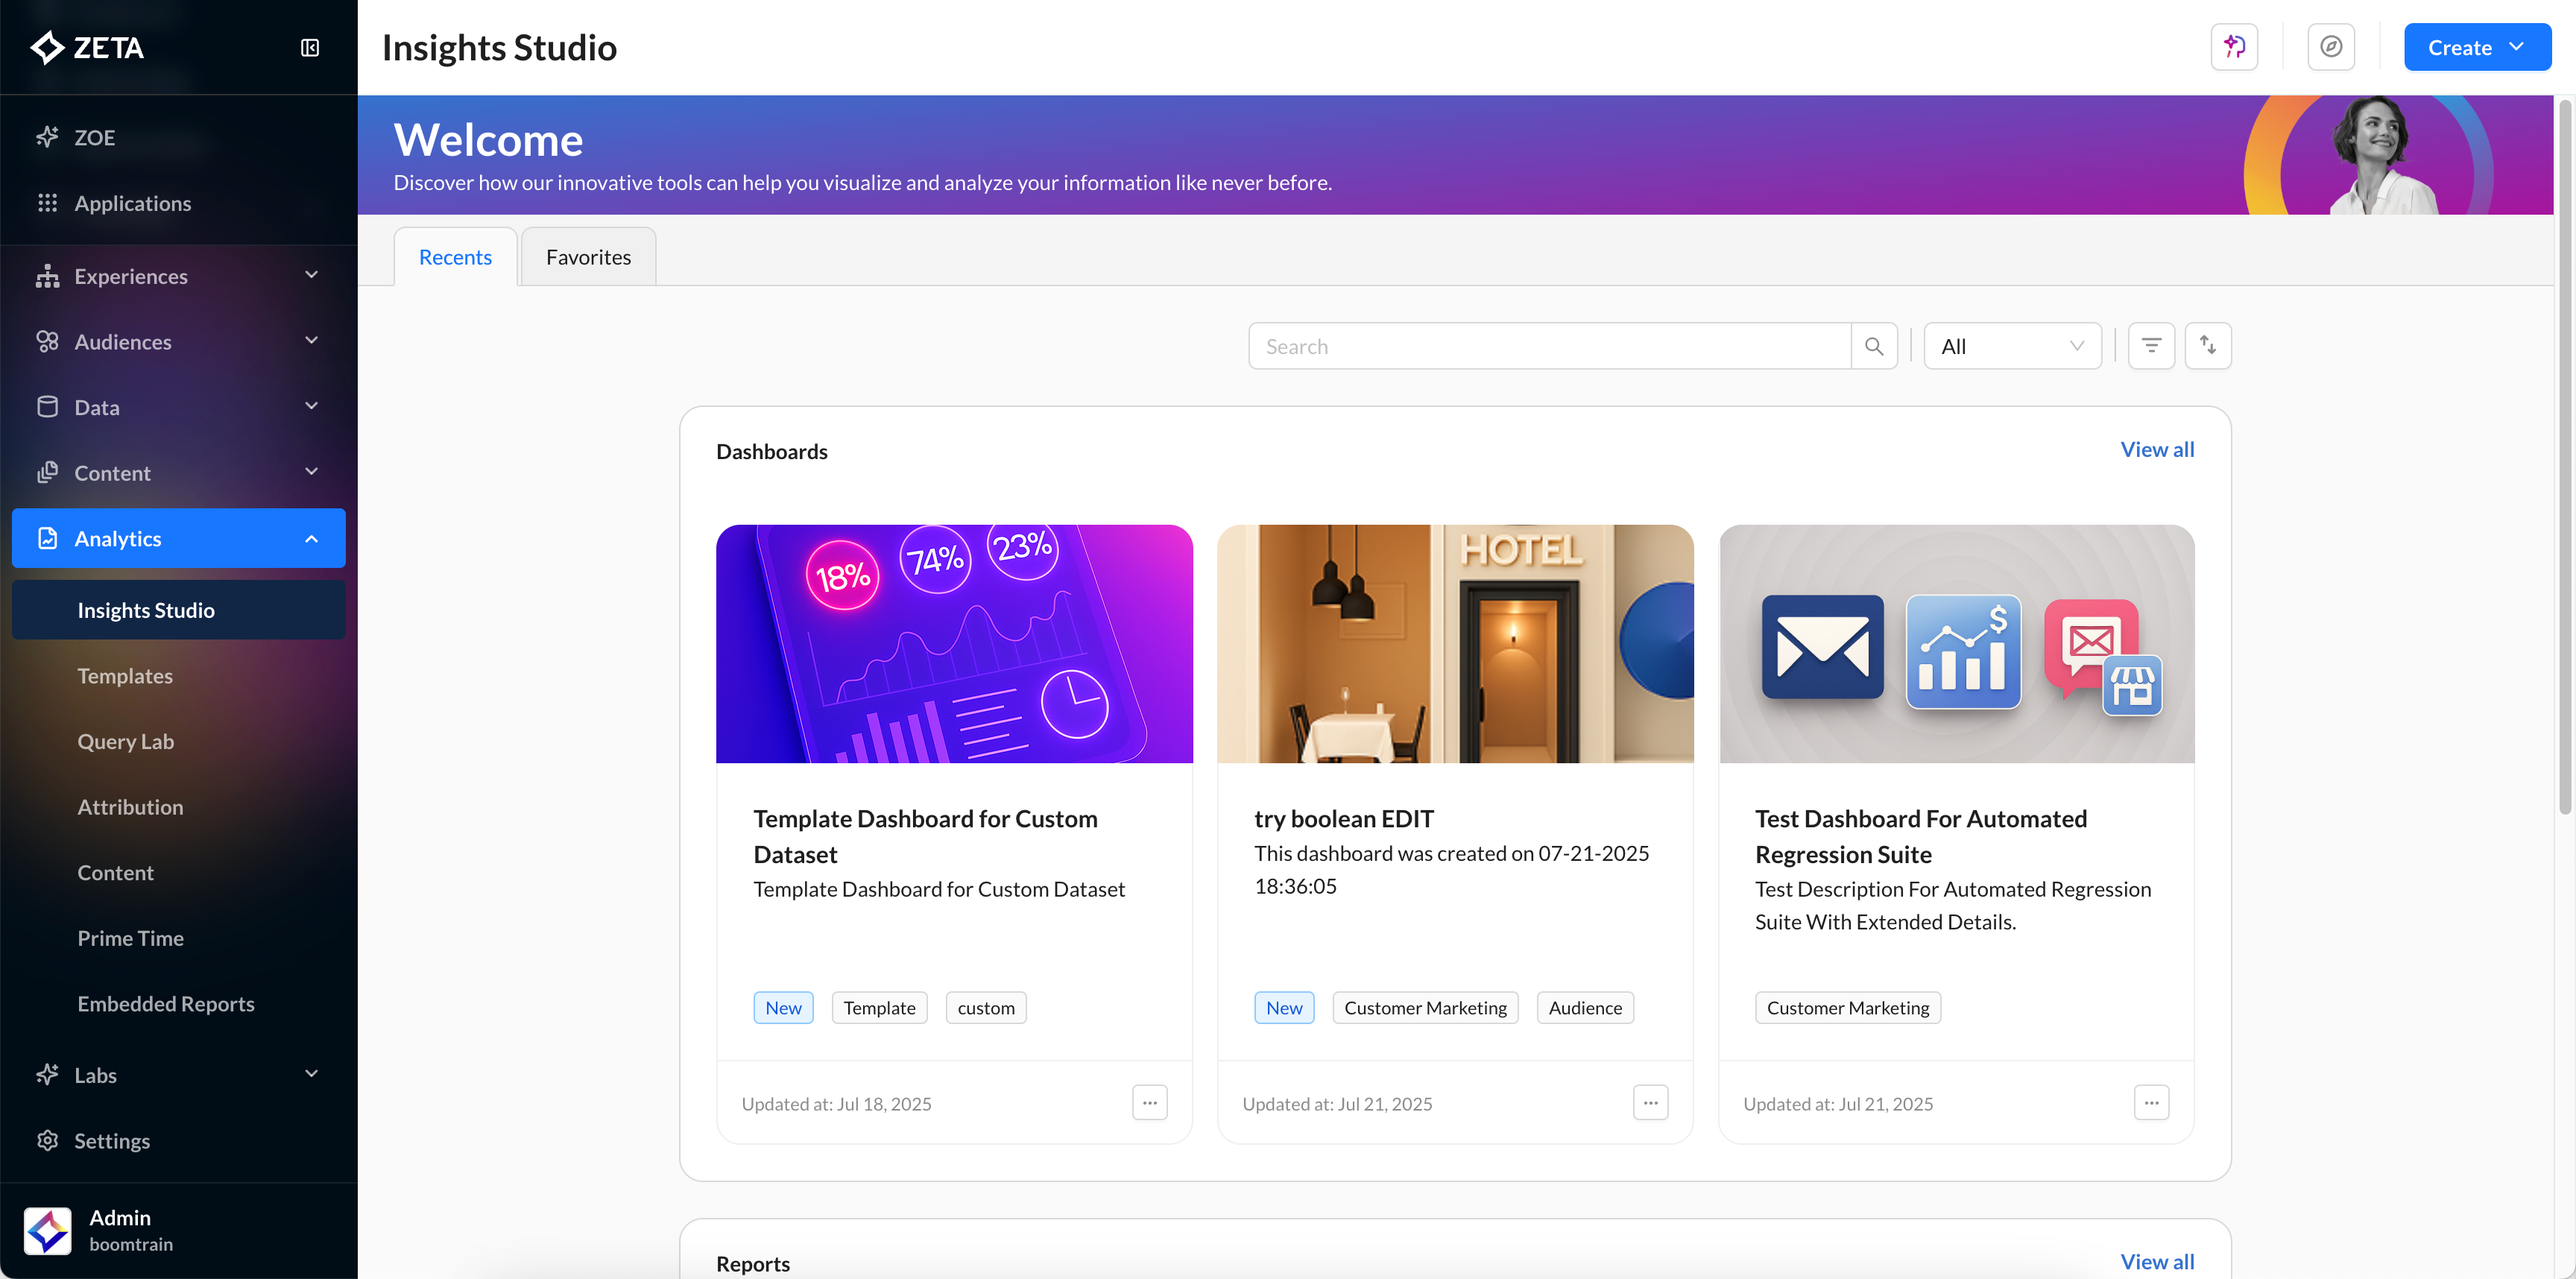
1. To get to the Insights Studio, navigate to Analytics > Insights Studio from the menu on the left.

image-20250721-140636.png
  • Once inside, you’ll see two primary sections:

    • Dashboards – For visualizing key data through dynamic tiles, charts, and graphs.

    • Reports – For more detailed, table-based, ad hoc reporting.

2. Use the Recents and Favorites tabs at the top to quickly find what you’ve worked on recently or marked for easy access.

2025-07-22_11-58-04 (1)-20250722-062837.gif

3. At the top of the page, you’ll find a search bar and filter options. Use these to locate specific dashboards or reports by keyword or category. You can also sort your results in ascending or descending order for quick navigation.

2025-07-22_12-56-36 (1)-20250722-072742.gif

Creating Dashboards

To build a multi-widget, visual overview of your data, click on the blue Create button in the top right corner and choose Dashboard from the dropdown.

image-20250722-073849.png

Step 1: Configure Dashboard

Enter a dashboard name, a short description outlining its purpose, and select one or more reports using the checkboxes to include them in the dashboard.

2025-07-22_18-34-21 (1)-20250722-130550.gif

Step 2: Select Fields

Define the fields that will serve as dashboard-level filters, enabling consistent filtering across all included reports.

2025-07-22_18-56-07 (2)-20250722-133237.gif
  • Select a Primary Report that will serve as the source for global filters.

  • Under Dimensions or Metrics, choose the fields that will be used as dashboard filters.

  • Select corresponding Secondary Reports to prepare for filter mapping in the next step.

These selections lay the foundation for linking filters across datasets with different schemas.

Step 3: Configure Filters

Establish mappings between the dashboard filters (from the Primary Report) and the corresponding fields in each Secondary Report.

2025-07-22_19-02-46 (1)-20250722-133301.gif
  • In the Secondary Reports section, select fields that match or align with the Primary Report filters.

  • This mapping ensures that filters applied at the dashboard level are propagated uniformly across all selected reports.

By aligning filter fields, you maintain data consistency and accuracy across your entire dashboard view.

Step 4: Review Summary

In the final step, review your dashboard configuration before saving.

2025-07-22_19-11-28 (1)-20250722-134251.gif
  • Click on Save to finalize and create your dashboard.

After saving your dashboard, you’re redirected to the Insights Studio home screen, where your newly created dashboard appears under Dashboards > Recents.

  • From here, you can:

    • Open the dashboard to view and interact with live data

    • Edit dashboard configurations and filters

    • Favorite, share, or duplicate the dashboard

    • Apply global filters and visualize metrics using pre-configured widgets


Creating Reports

To create a customizable, data-rich report, click the blue Create button in the top-right corner and choose Report from the dropdown.

Data

When you begin creating a new report, the builder opens with the Data section by default. This is where you define the foundation of your report by selecting the dataset it will be built on.

image-20250722-135246.png

The Data Panel allows you to choose from the following dataset categories:

Standard Datasets

Custom Datasets

Saved Queries

These are Zeta-provided, ready-to-use datasets derived from campaign activity and platform tracking.

If your account has any datasets configured specifically for your needs, they will appear under this tab. These are tailored to your organization’s data schema and business requirements.

Any prebuilt or frequently used data queries saved from past report builds will be listed here for quick reuse.

image-20250723-052942.png
Available Standard Datasets
  • Customer Marketing

  • Media Activation

  • Customer Data Management

  • Events

  • Website - In Page

  • Website - Overlay

image-20250723-052955.png
  • Click Create New Dataset to define a new dataset query in Query Lab.

Advanced users will have the option to edit and add aggregate metrics to the custom dataset. The updated dataset will also be available to other users in the account.

Speak with your Account team if your team would like to get access to the Edit capability.

image-20250723-053011.png
  • Click Open Query Lab to build and save a new query directly from the lab.

Dimensions

The Dimensions tab is where you can select all the dimensions you would like included in your report.

image-20250723-054206.png

The Metrics & Dimensions Dictionary is always available for your reference.

Metrics

The Metrics tab is where you can select all the metrics you would like included in your report.

image-20250723-054550.png

The Metrics & Dimensions Dictionary is always available for your reference.

Filters

Once you have made your metric and dimension selections, you can filter your data in the Filters tab.

Apply any global filters to refine data for analysis, e.g., specific Campaign, Channel, etc. You can add more filters by selecting the Add Filter button. When adding a new filter, you can adjust the and/or operator.

2025-07-23_11-30-40 (1)-20250723-060243.gif
Available Operators

Operator

Criteria

Equals

Use to find an exact match

is less than

Eliminates records with a higher numerical value than entered

is less than or equal to

Eliminates records that are higher or equal to the numerical value than entered

is greater than

Eliminates records with a lower numerical value than entered

is greater than or equal to

Eliminates records with a lower or equal numerical value than entered

value exists

Use to find a value within a field that also includes other values

value does not exist

Use to find results excluding the value you enter within a field that also includes other values

In range

Use to find results within a range while excluding the values that fall outside of the entered range.

contains

Use for fields that include your search string, but sometimes also include other information

starts with

Use when you know what your value starts with, but not the exact text

does not contain

Use for fields that do not include your search string

ends with

Use when you know what your value ends with, but not the exact text

is one of

Use to find an exact match in fields that also include other information

contains one of

Use for fields that include your search string, but sometimes also include other information

  • Unsupported filters for Programmatic reports include: Does not contain, Contains one of, Starts with, Ends with, Lesser than or equal, Greater than or equal, Between.

  • OR logic is not supported for Programmatic reports; only AND conditions are allowed.

  • Some metric filters accept only numeric values.

Forecasts

In the Forecasts tab of the Builder, you can select metrics from a limited list to forecast 1, 7, or 30 days out for Customer Marketing or Media Activation reports. 

2025-07-23_11-43-29 (1)-20250723-061438.gif
Forecastable Metrics

Forecastable Metrics in Customer Marketing: 

  • Click Rate

  • Conversions

  • Opens

  • Sent

In order to forecast these metrics, you must also have at least one of these dimensions selected. If you do not, the Builder will autoselect them for you. Removing the required dimension will remove the forecasted metric as well. 

  • Campaign ID

  • Channel Name (only Email and SMS)

 Forecastable Metrics in Media Activation: 

  • Impressions

  • Click Rate

  • Conversion Rate

 In order to forecast these metrics, you must also have at least one of these dimensions selected. If you do not, the Builder will autoselect them for you. Removing the required dimension will remove the forecasted metric as well. 

  • Device

  • Hour

  • Deliver Channel 

Parameters

Depending on the data type you selected in the Data tab, you may see an additional tab called Parameters. In this tab, you can make additional selections specific to that dataset. 

image-20250723-062028.png

Narrative

Navigate back to the Narrative section to view a clear, auto-generated summary of the report you’ve been building. As you configure parameters such as the dataset, metrics, dimensions, filters, and date range, the narrative updates dynamically to reflect your selections.

2025-07-23_11-56-48 (1)-20250723-062726.gif
  • The colored pills are interactive. Metrics, dimensions, filters, and forecasts can all be removed by hovering over the pill. When you click on data, dates, and visualizations from the narrative, you will be taken to that specific tab.


Once selections are made, a data table preview will appear, displaying the filtered dataset for developing the report.

2025-07-23_11-59-40 (1)-20250723-063040.gif
Dates

Dynamic Date Ranges

Definition

Today

Data available for today, the day the report is built. 

Yesterday

The day before the day the report is built. 

Last 2 days

Last 2 days, including the current day.

Last 3 days

Last 3 days, including the current day.

Last 4 days

Last 4 days, including the current day.

Last 5 days

Last 5 days, including the current day.

Last 6 days

Last 5 days, including the current day.

Last 7 days

Last 7 days, including the current day.

Last Week

All days in the previous Monday - Sunday week, counting the Monday - Sunday that the current day falls within.

Last 14 days

Last 14 days, including the current day.

Last 28 days

Last 28 days, including the current day.

Last 30 days

Last 30 days, including the current day.

This month

All days in the current month, including the current day.

Last month

All days in the previous month.

Last 2 months

Last 2 months, including the current month.

Last 3 months

Last 3 months, including the current month.

Last 6 months

Last 6 months, including the current month.

Last year

All days since the same day in the previous year, including the current day (last 365 days).

Previous year

All months in the previous calendar year (in 2025, this would pull all months of 2024).

Week to date

All days in the current week, including the current day. Weeks are defined as Monday - Sunday.

Quarter to date

All days in the current quarter, including the current day.

Year to date

All days in the current year, including the current day.

All dynamic date range options include today’s (as in, the day you are building the report) data, excluding yesterday’s, which includes only the day before today’s data.


Creating Charts

Click the Create New Chart button in the top-right corner of your report.

2025-07-23_12-06-05 (1)-20250723-063727.gif
  • From the panel that slides open, choose from the available chart types to customize and enhance your report with intuitive chart configuration options.

To explore the available chart types and learn how to configure each one, visit the Charts & Visualizations page for detailed guidance.


Review your report and save the report, giving it a name and optional question and description. Also, you could choose to save this report as a template for future use.

2025-07-23_12-10-31 (1)-20250723-064211.gif

You can also export or schedule ongoing report delivery by clicking on the action menu icon (…) on the header and clicking on Export/Automate.

2025-07-23_12-16-07 (1)-20250723-064652.gif
  • Select the way in which you want to receive your report: Amazon S3, Microsoft Azure Blob Storage, Email, Google Buckets, or SFTP, and click on Next.

  • Select the cadence at which you want to receive your report: Daily, Weekly, Monthly, Quarterly, Yearly.

Learn more about the Export Destinations.

You can modify charts or data selections anytime for up-to-date insights.


Check out our FAQs page to find all your answers at once.

JavaScript errors detected

Please note, these errors can depend on your browser setup.

If this problem persists, please contact our support.