

In today’s performance-driven world, data isn’t just valuable, it’s essential. ZMP transforms complex data streams into clear, actionable insights that help you make smarter decisions, faster. Designed as your single source of truth, ZMP brings together all your marketing performance metrics, audience insights, and business KPIs in one intuitive, real-time view.
Whether you’re optimizing campaigns, tracking engagement, or uncovering new opportunities, ZMP gives you a comprehensive snapshot of what’s working and where to focus next. With its dynamic visualization tools, customizable dashboards, and seamless access to relevant data, ZMP empowers every user across Customer and Prospect Marketing to measure success and take action with confidence.
ZMP Home is your starting point to explore, analyze, and act; turning data into impact.
Navigation
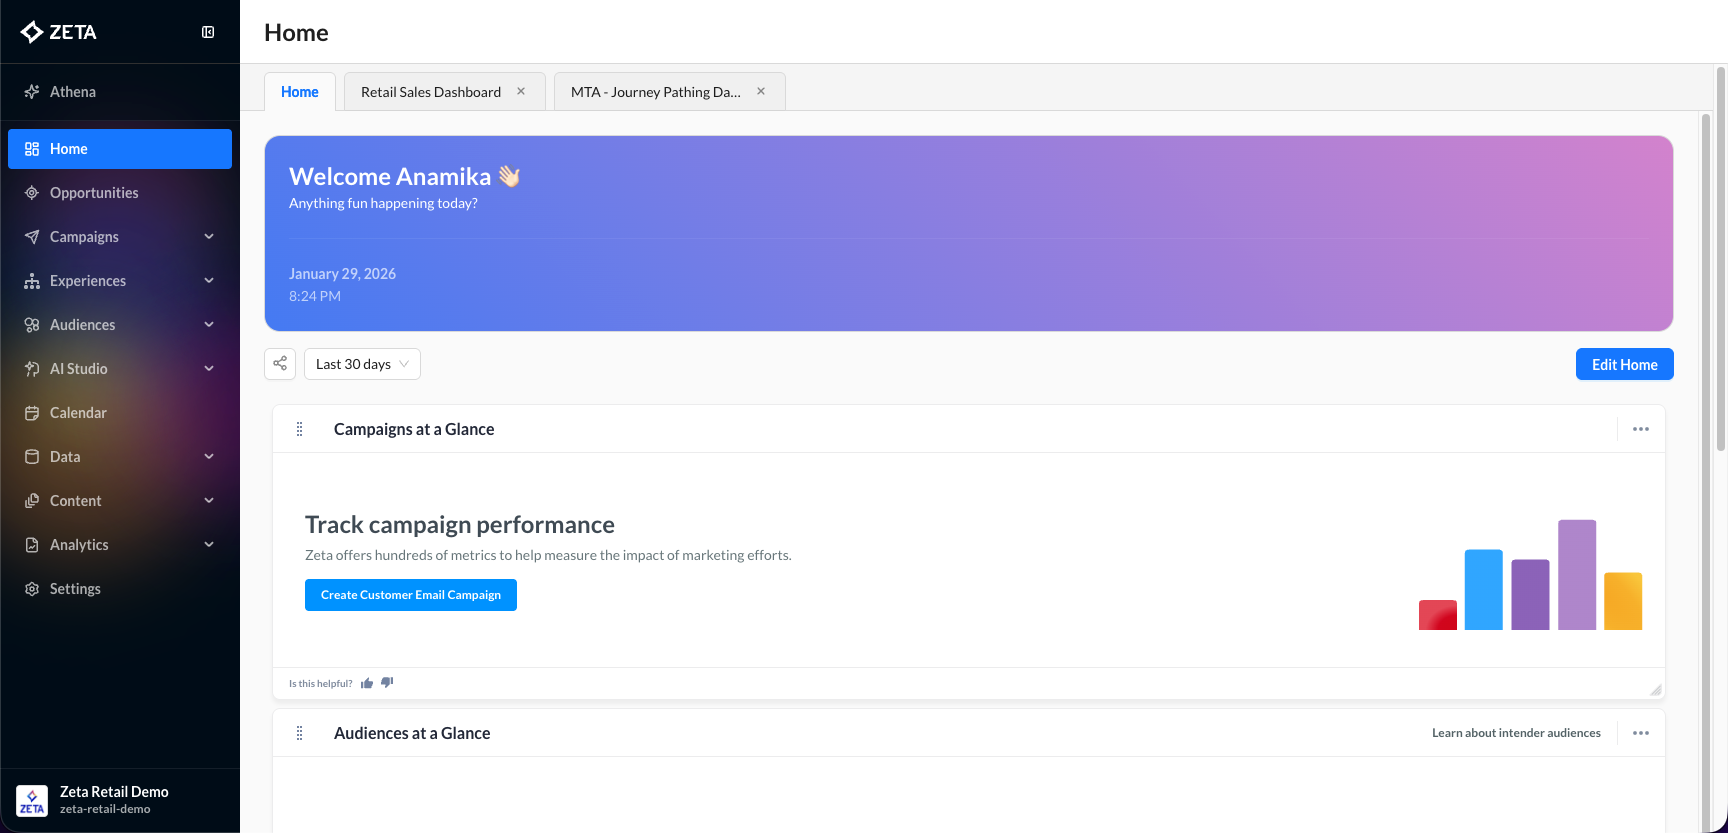
When you sign in to your ZMP account, the Home will appear as the first screen you see.
If you are in another area in ZMP, you can choose Home at the top of the left-hand nav, or the Zeta logo in the top-left corner of the screen, to navigate back to Home.

Date Selection Functionality
The ZMP Dashboard offers a date selection tool in the upper right-hand corner. The default date selection is always the dynamic date range: the last 30 days. Clicking on the last 30 days will allow you to see the other Dynamic and Fixed Date options that you can apply to your dashboard.
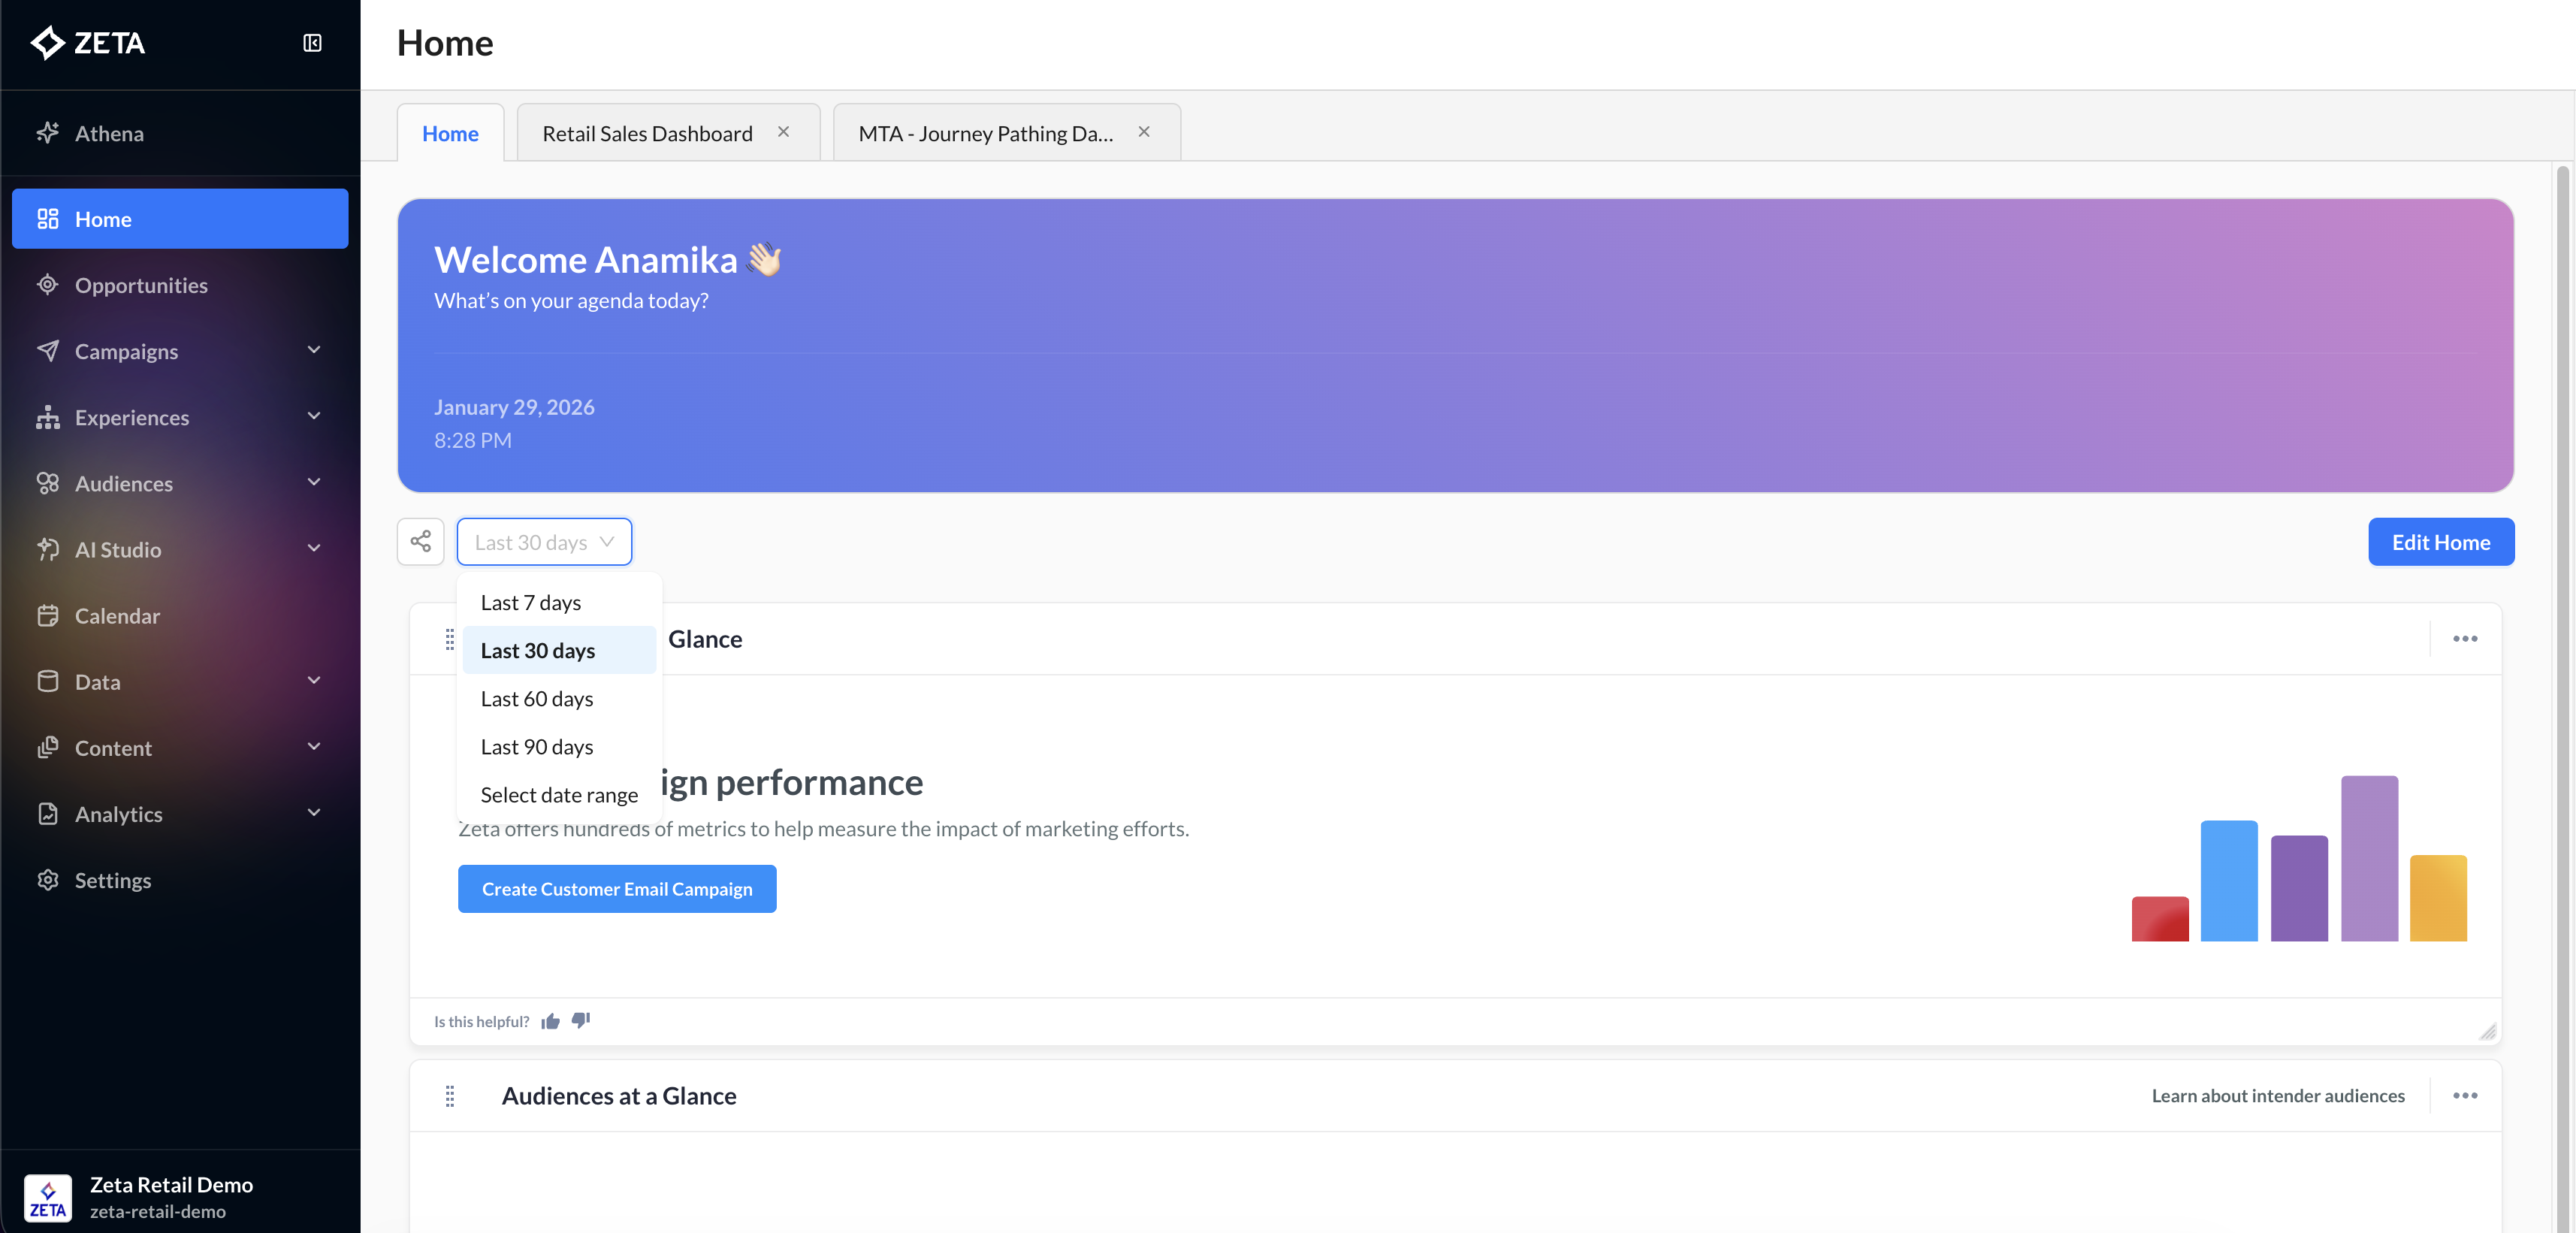
The Dynamic Date ranges available are:
-
Last 7 Days
-
Last 30 Days
-
Last 60 Days
-
Last 90 Days
Alternatively, if you click on Select Date Range; this will give you the option to choose a fixed start and end date.
The standard timestamp for updating the Dashboard is usually set at 4 hours, although this timeframe may vary based on the upload process and could potentially extend beyond that.
Widgets
Depending on your Zeta Solution, by default, you may see both the Customer and Prospect widgets or just one or the other.
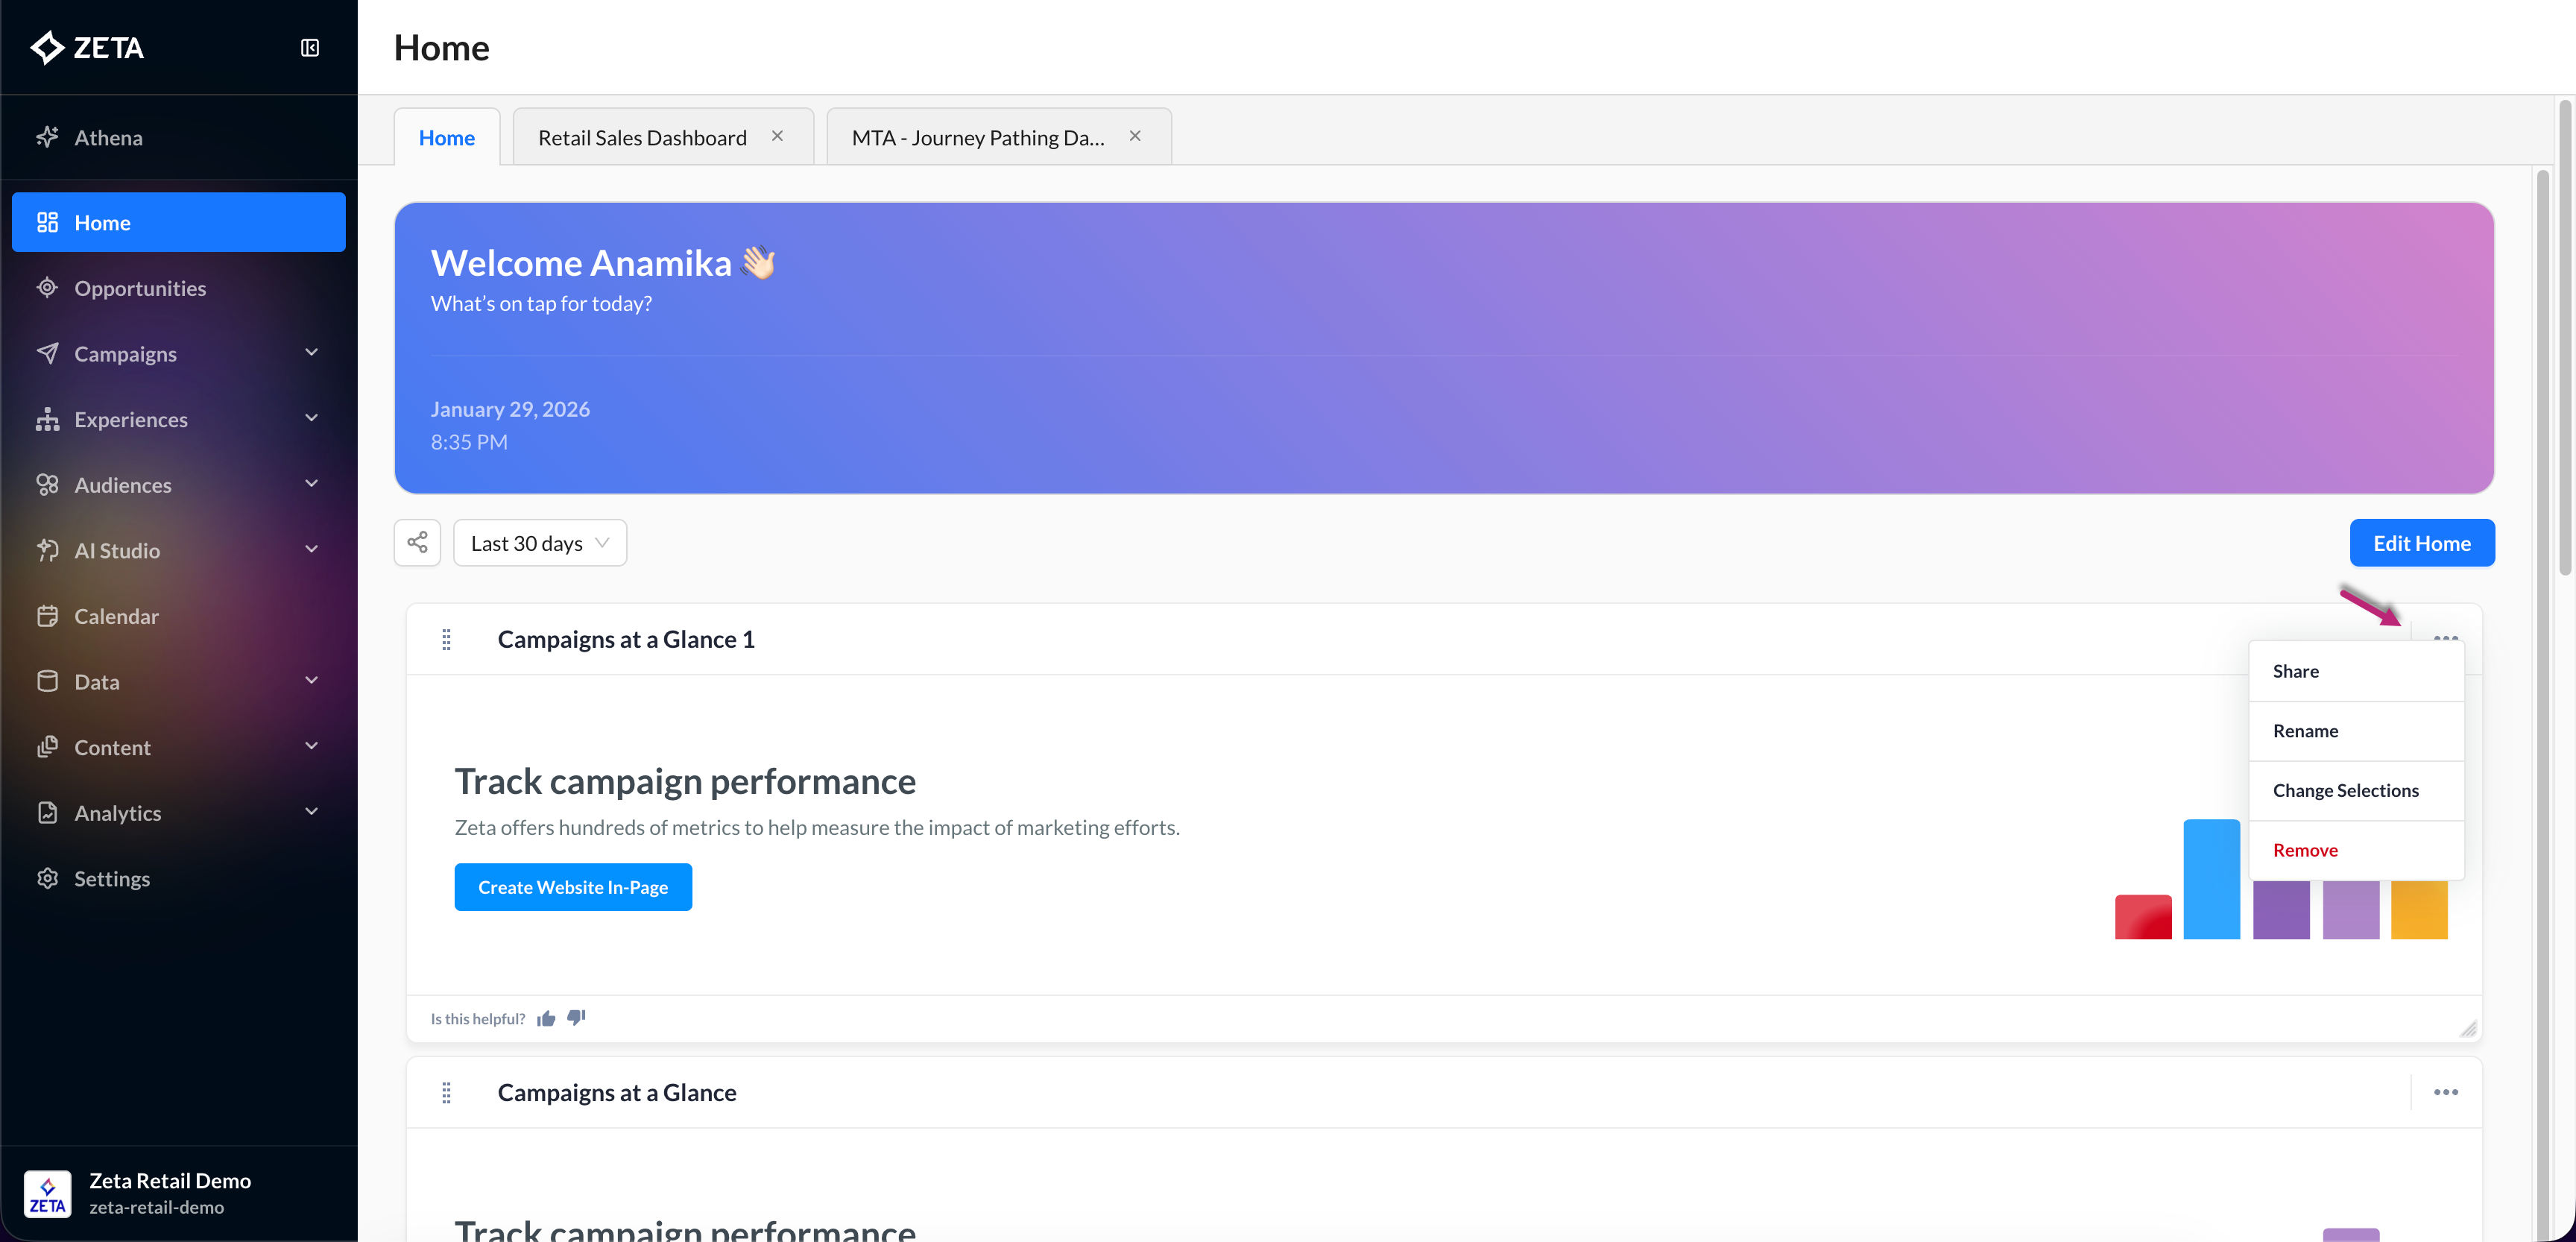
To change the widgets that appear on the dashboard, click on the Edit Home button at the top right corner of the Dashboard.
-20260129-150358.gif)
On each widget, you will also see the action menu in the upper right-hand corner. Depending on the widget, selecting this menu will allow you to customize or remove the widget individually from your view.
In order to surface the data that is most important to you and be able to make quick observations and informed optimizations, you can further rearrange and resize the widgets' placements and sizes across the dashboard by dragging them to the desired position and reforming them into your desired size.
-20260129-150820.gif)
Let’s quickly have a look at what else each of the widgets includes:
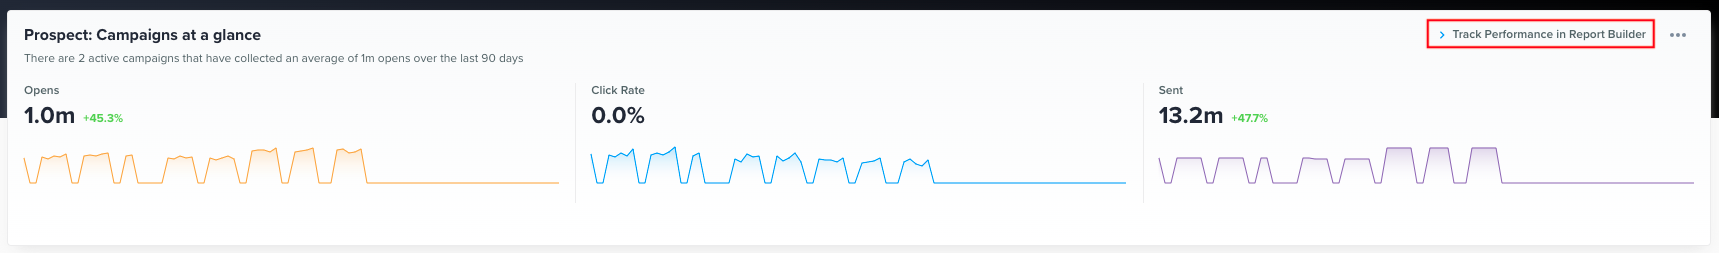
Title
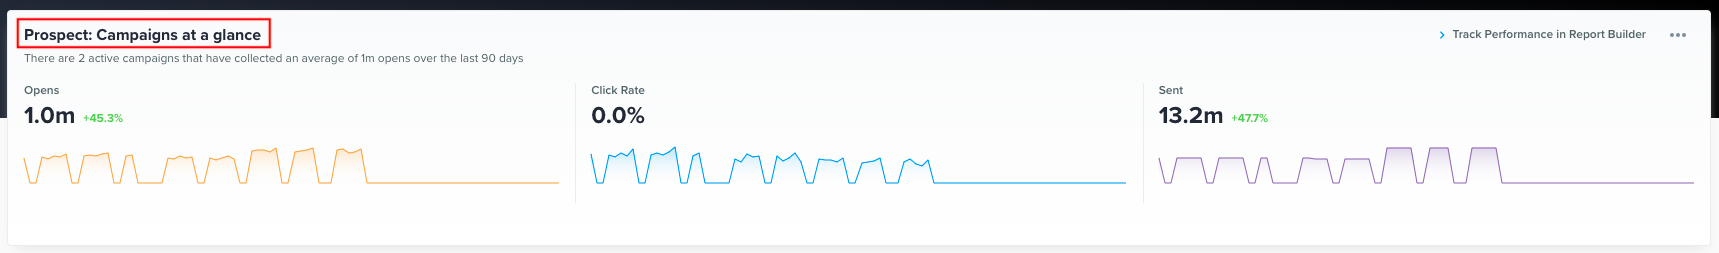
The title of the widget tells you what type of email data you are reviewing, either Prospect or Customer, and the specific data the widget provides.
|
For example, the Customer: Segments at a glance widget shows segment performance for customer email engagements. ard was set to. |
Widget Summaries
The widget summaries of the widgets dynamically highlight important and specific performance during the date range you have selected for your dashboard.
|
For example, the widget summary in the Prospect: Top Offers widget will report on the number of active offers associated with the account and the number of opens or clicks for all offers during the date range selected for your dashboard. |
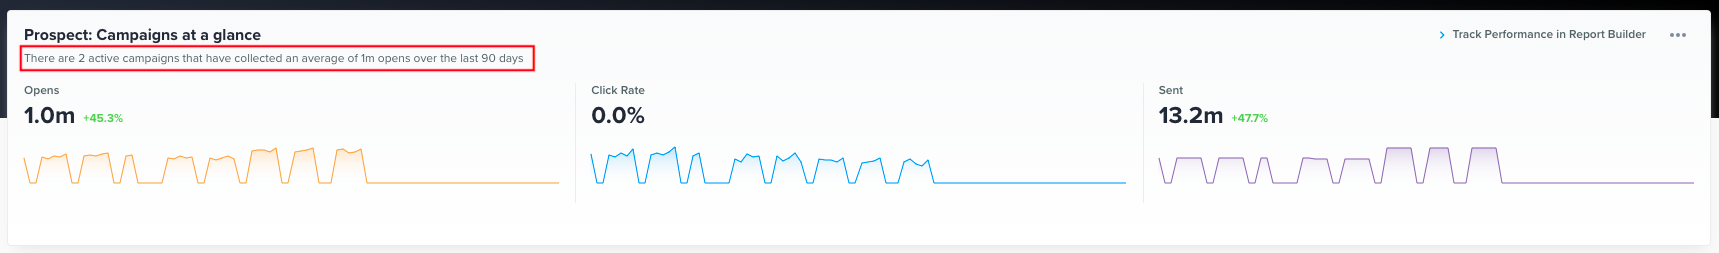
Data States
Within the dashboard, each widget can be in one of three states: Empty, No Data, and Data, depending on the entity it is reporting on and the amount of data available.
|
For example, before launching a prospect campaign, the Prospect: Campaigns at a glance widget would be presented in the Empty state. At the same time, segments have been uploaded, the Customer: Segments at a glance widget would present in the Data state. |
Let’s find out what each of these states means:
Empty State
The Empty state will show no data in the Dashboard.
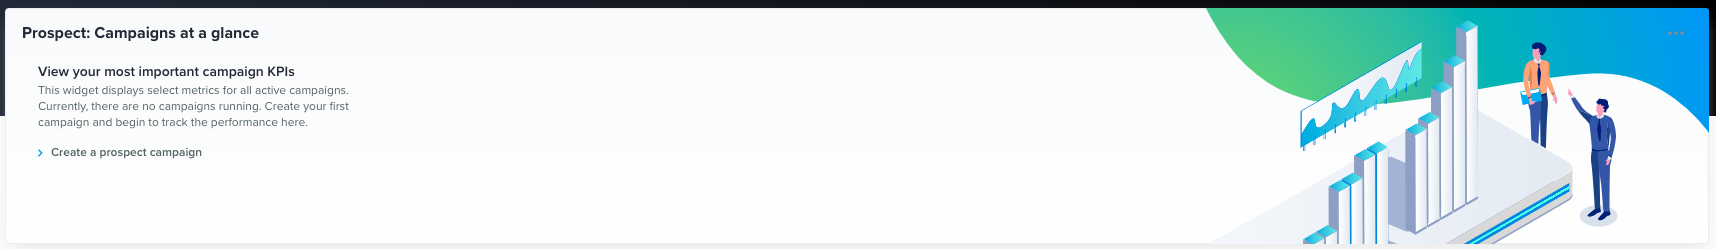
|
For example, if you just signed on with Zeta and no campaigns or segments have been created yet, there would not be any campaign or segment performance data to show. |
No Data State
The No Data State will appear when there is not enough performance data to populate the widget.
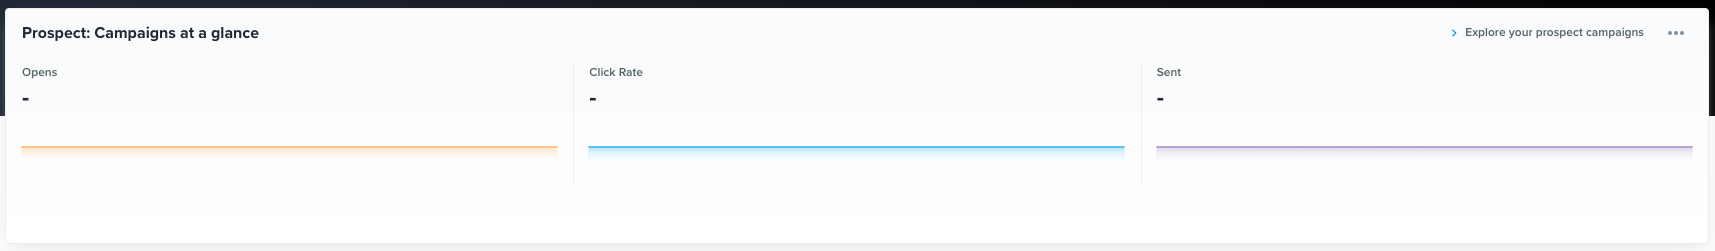
|
For instance, if it has only been a few minutes after a campaign has been sent. This is not a cause for concern and the Zeta Support team is ready to help if needed. |
Data State
The Data State will show all available performance data within the selected widgets.
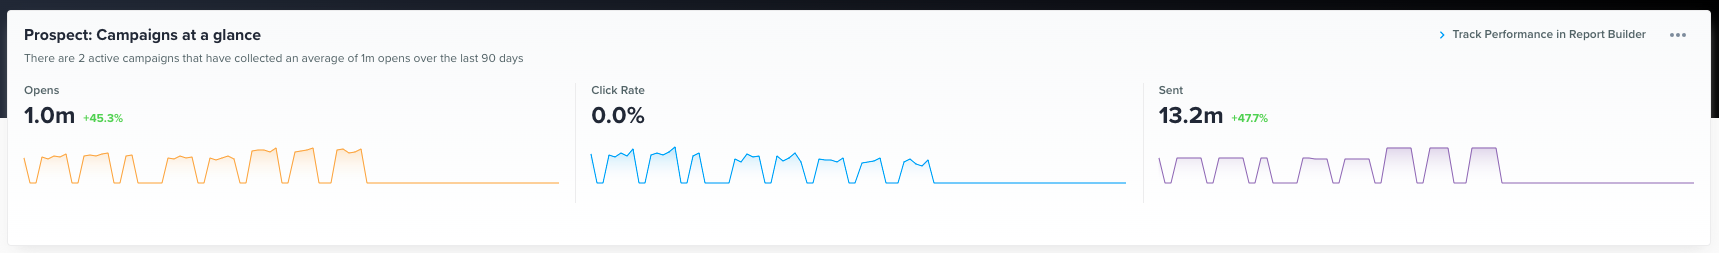
In this state, you will be able to see key performance indicators for prospect and customer email widgets.
Call to Action
A call-to-action or CTA is an action that you can take to optimize or learn more about the performance being reported on in the widget. Depending on the data and data state of the widget, the CTAs will vary.
|
For example, if the Customer: Recent Broadcast Campaigns widget is in an empty state, the CTA will prompt the user to create a campaign. However, when the Customer: Recent Broadcast Campaigns widget is in the no-data state, the CTA will prompt the user to explore their campaigns on the Broadcast campaigns page. Finally, when the Customer: Recent Broadcast Campaigns widget is in the data state, the CTA will prompt the user to view more details in the Report Builder which will take the user to the Report Builder and load a pre-built performance report for that campaign that covers the exact same date range the dashboard was set to. |
Check out the Widgets Dictionary to learn about the widget that the ZMP dashboard includes.
Pinned Dashboards on Home
Ensure you have pinned dashboards and the required permissions enabled. If the issue persists, contact your account manager.
You can pin Insights Studio dashboards to ZMP Home for quick access. Pinned dashboards appear as tabs alongside the Home tab, allowing you to switch between Home and your most-used dashboards easily.
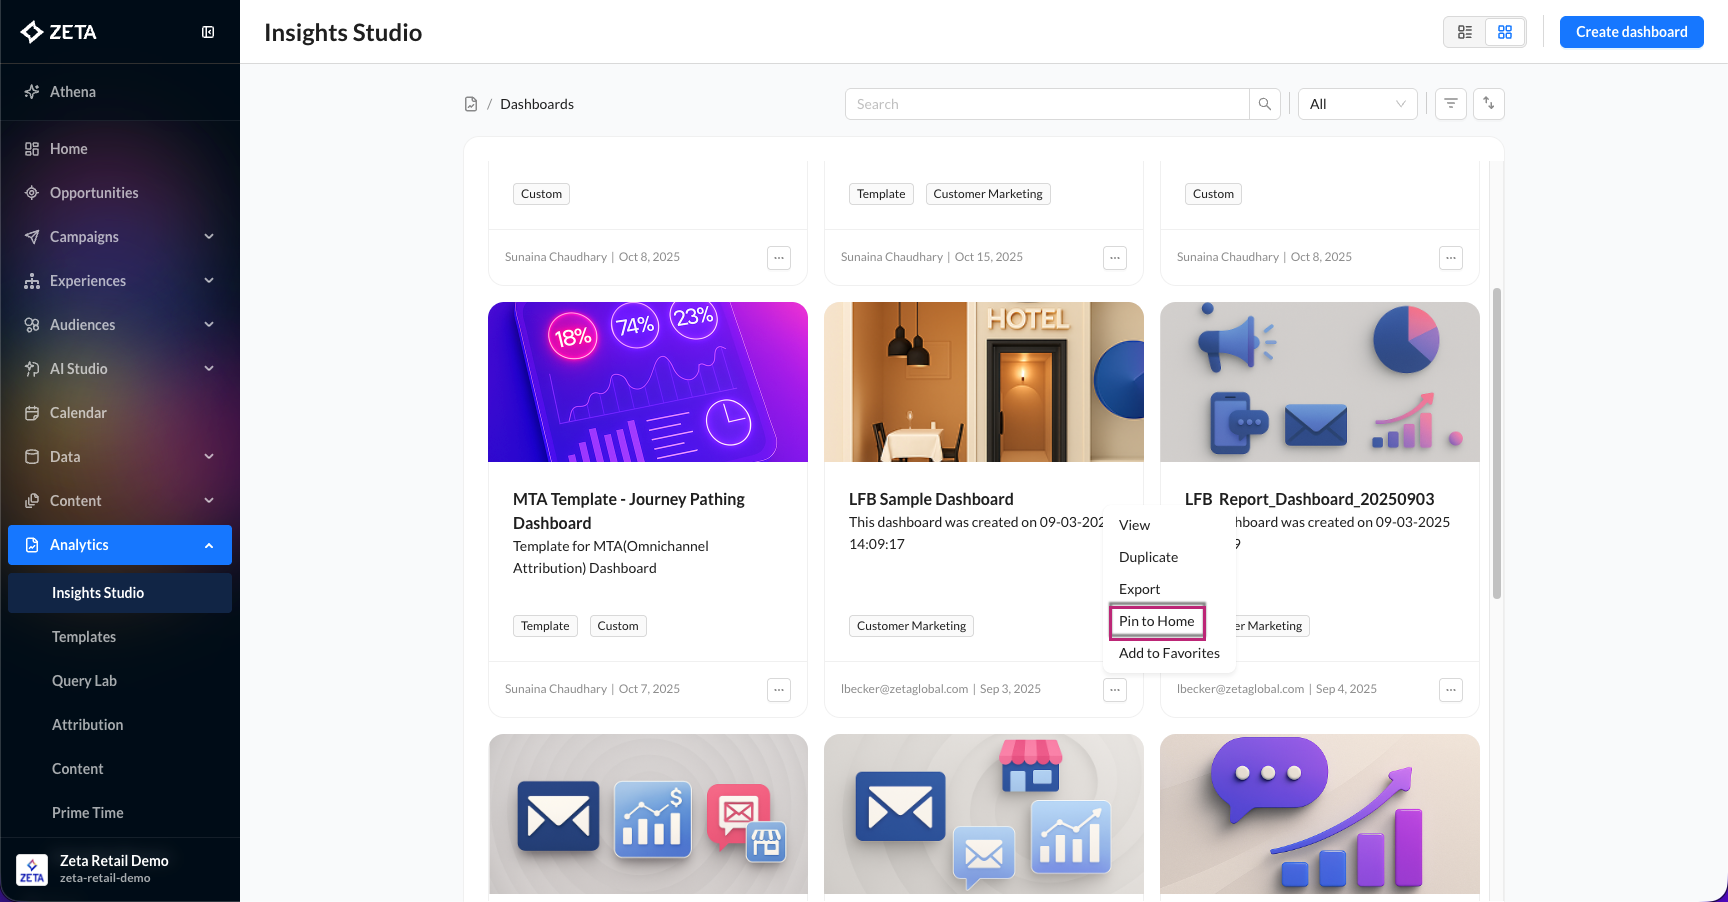
How to Pin a Dashboard to Home
-
From the left-hand navigation menu, go to Analytics > Insights Studio.
-
Select Dashboards to view all available dashboards and reports.
-
Locate the dashboard you want to pin. Click the action menu (⋯) on the dashboard card.
-
Select Pin to Home.
-
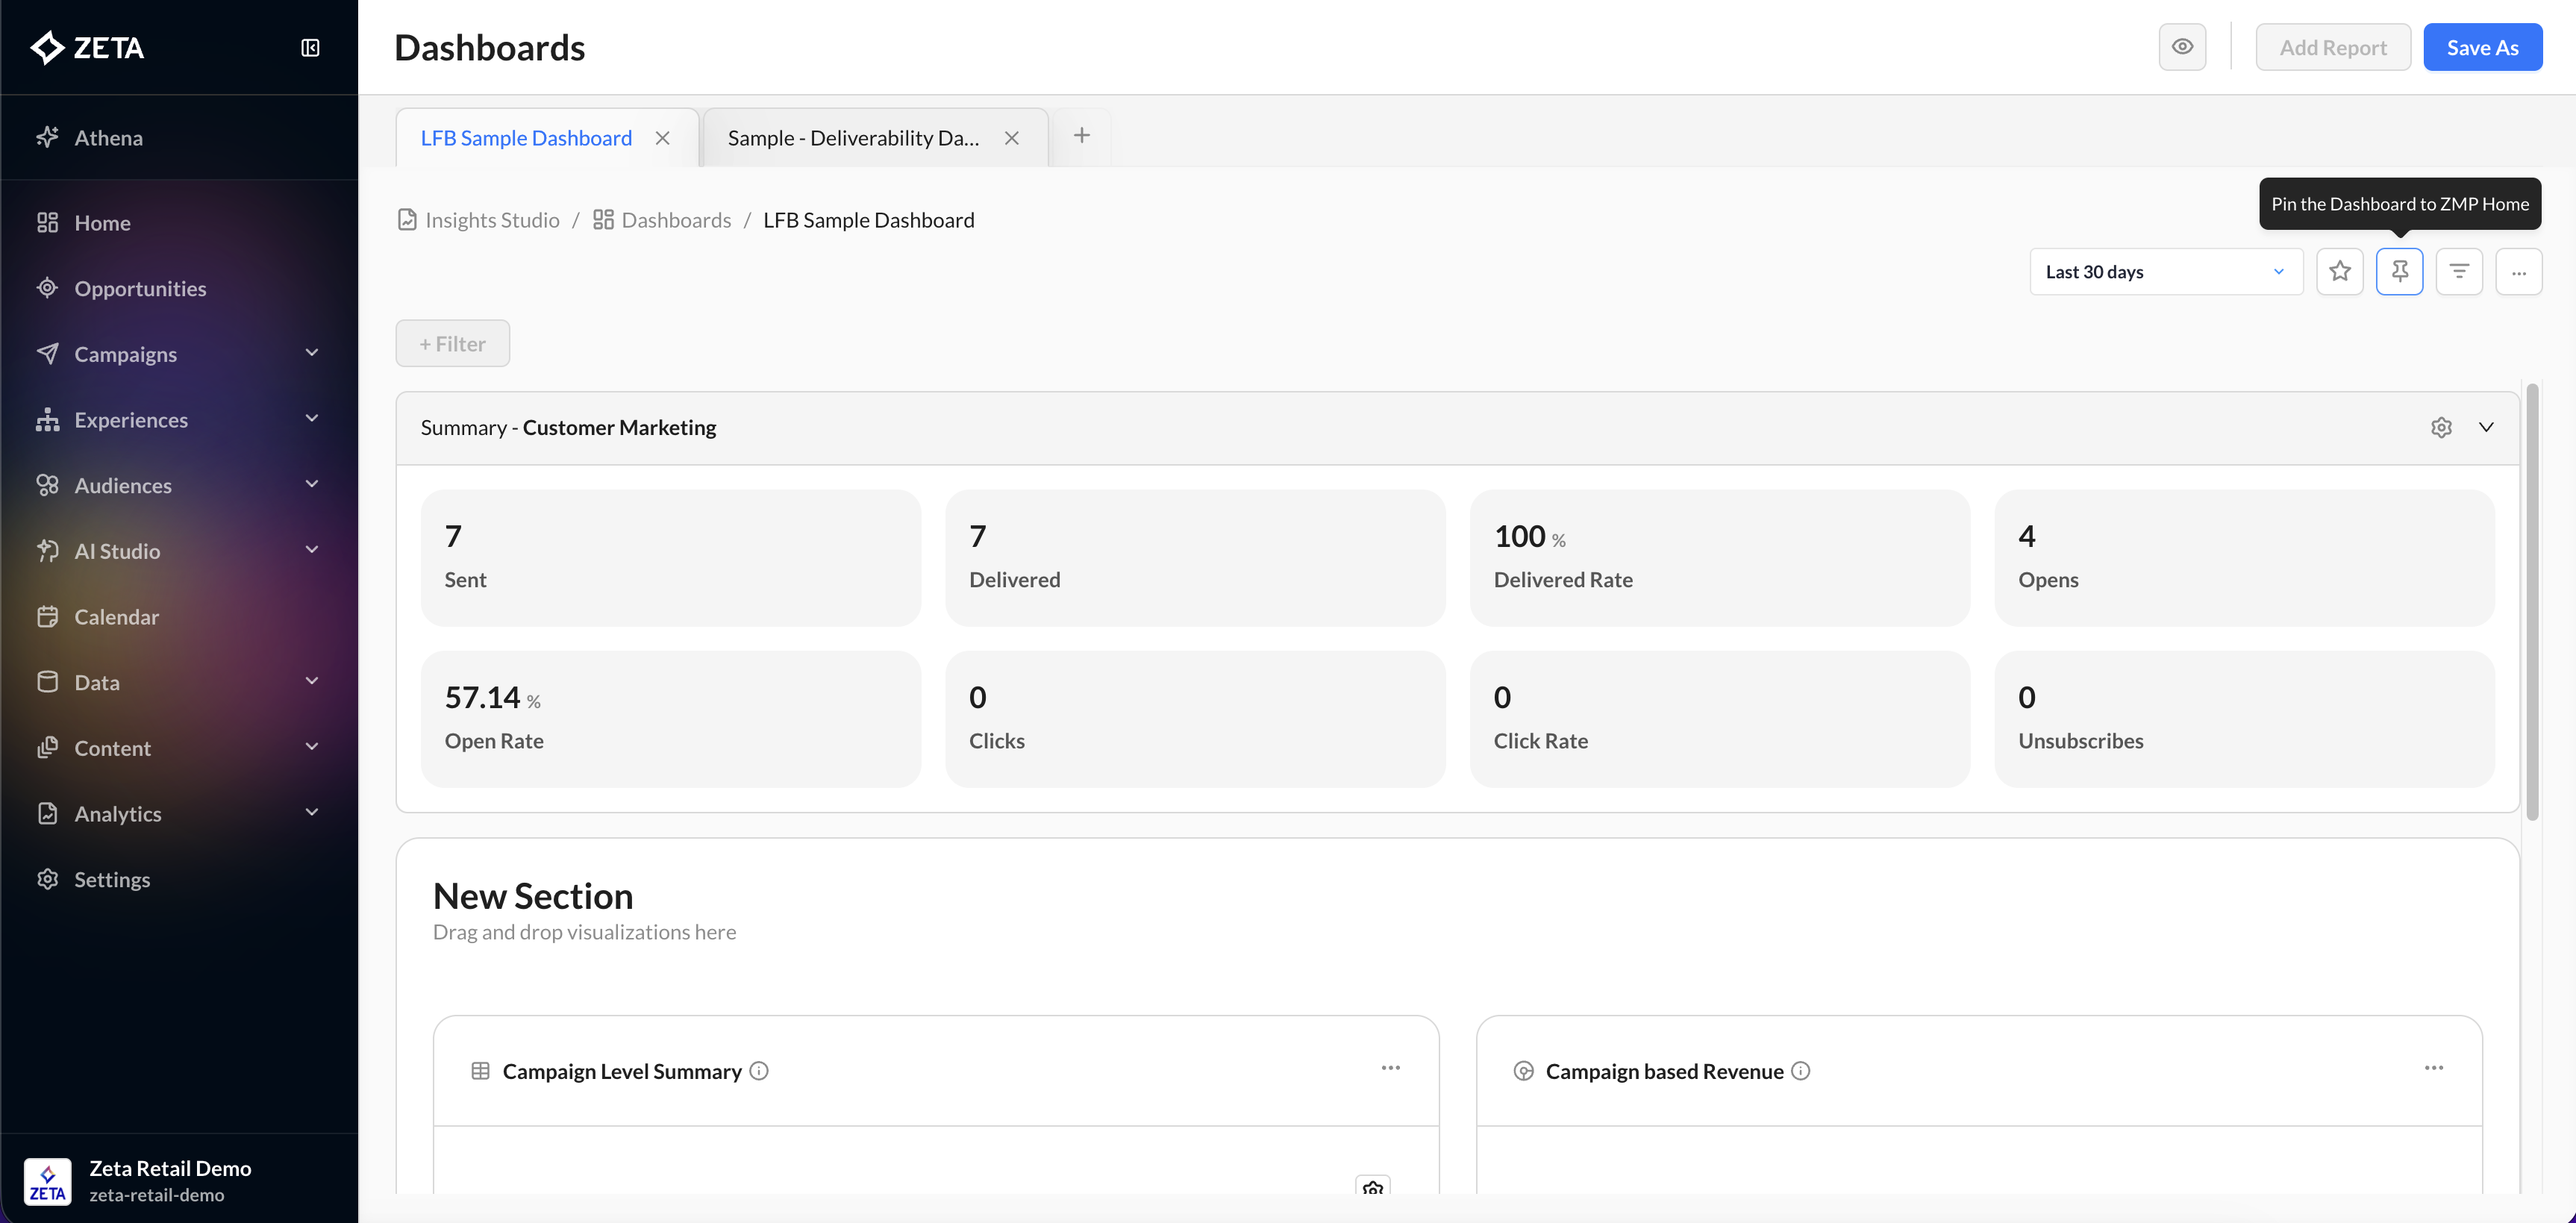
Alternatively, you can open the dashboard you want to pin. In the top-right corner of the dashboard, click the pin icon.
-
Once pinned, the dashboard will be added as a tab on ZMP Home.
How Pinned Dashboards Work
-
When you navigate to Home, the system displays the default ZMP Home tab and any pinned IS dashboards as tabs to the right of Home
-
Pinned dashboards always appear after the Home tab and are right-aligned.
-
A maximum of 10 dashboards can be pinned at one time.
Managing Pinned Dashboard Tabs
-
Users with the appropriate permissions can reorder pinned dashboards by dragging tabs to their preferred position.
-
If the number of pinned dashboards exceeds the available screen width:
-
Tabs may automatically reduce in width, or
-
Additional dashboards will be accessible via a dropdown overflow menu
-
Extensible Tab Support
ZMP Home is designed to support additional tabs introduced by other teams (for example, Performance Advisor), ensuring a consistent and scalable navigation experience across the platform.
Note: Pinning limits and tab behavior are enforced to maintain usability and visual consistency.
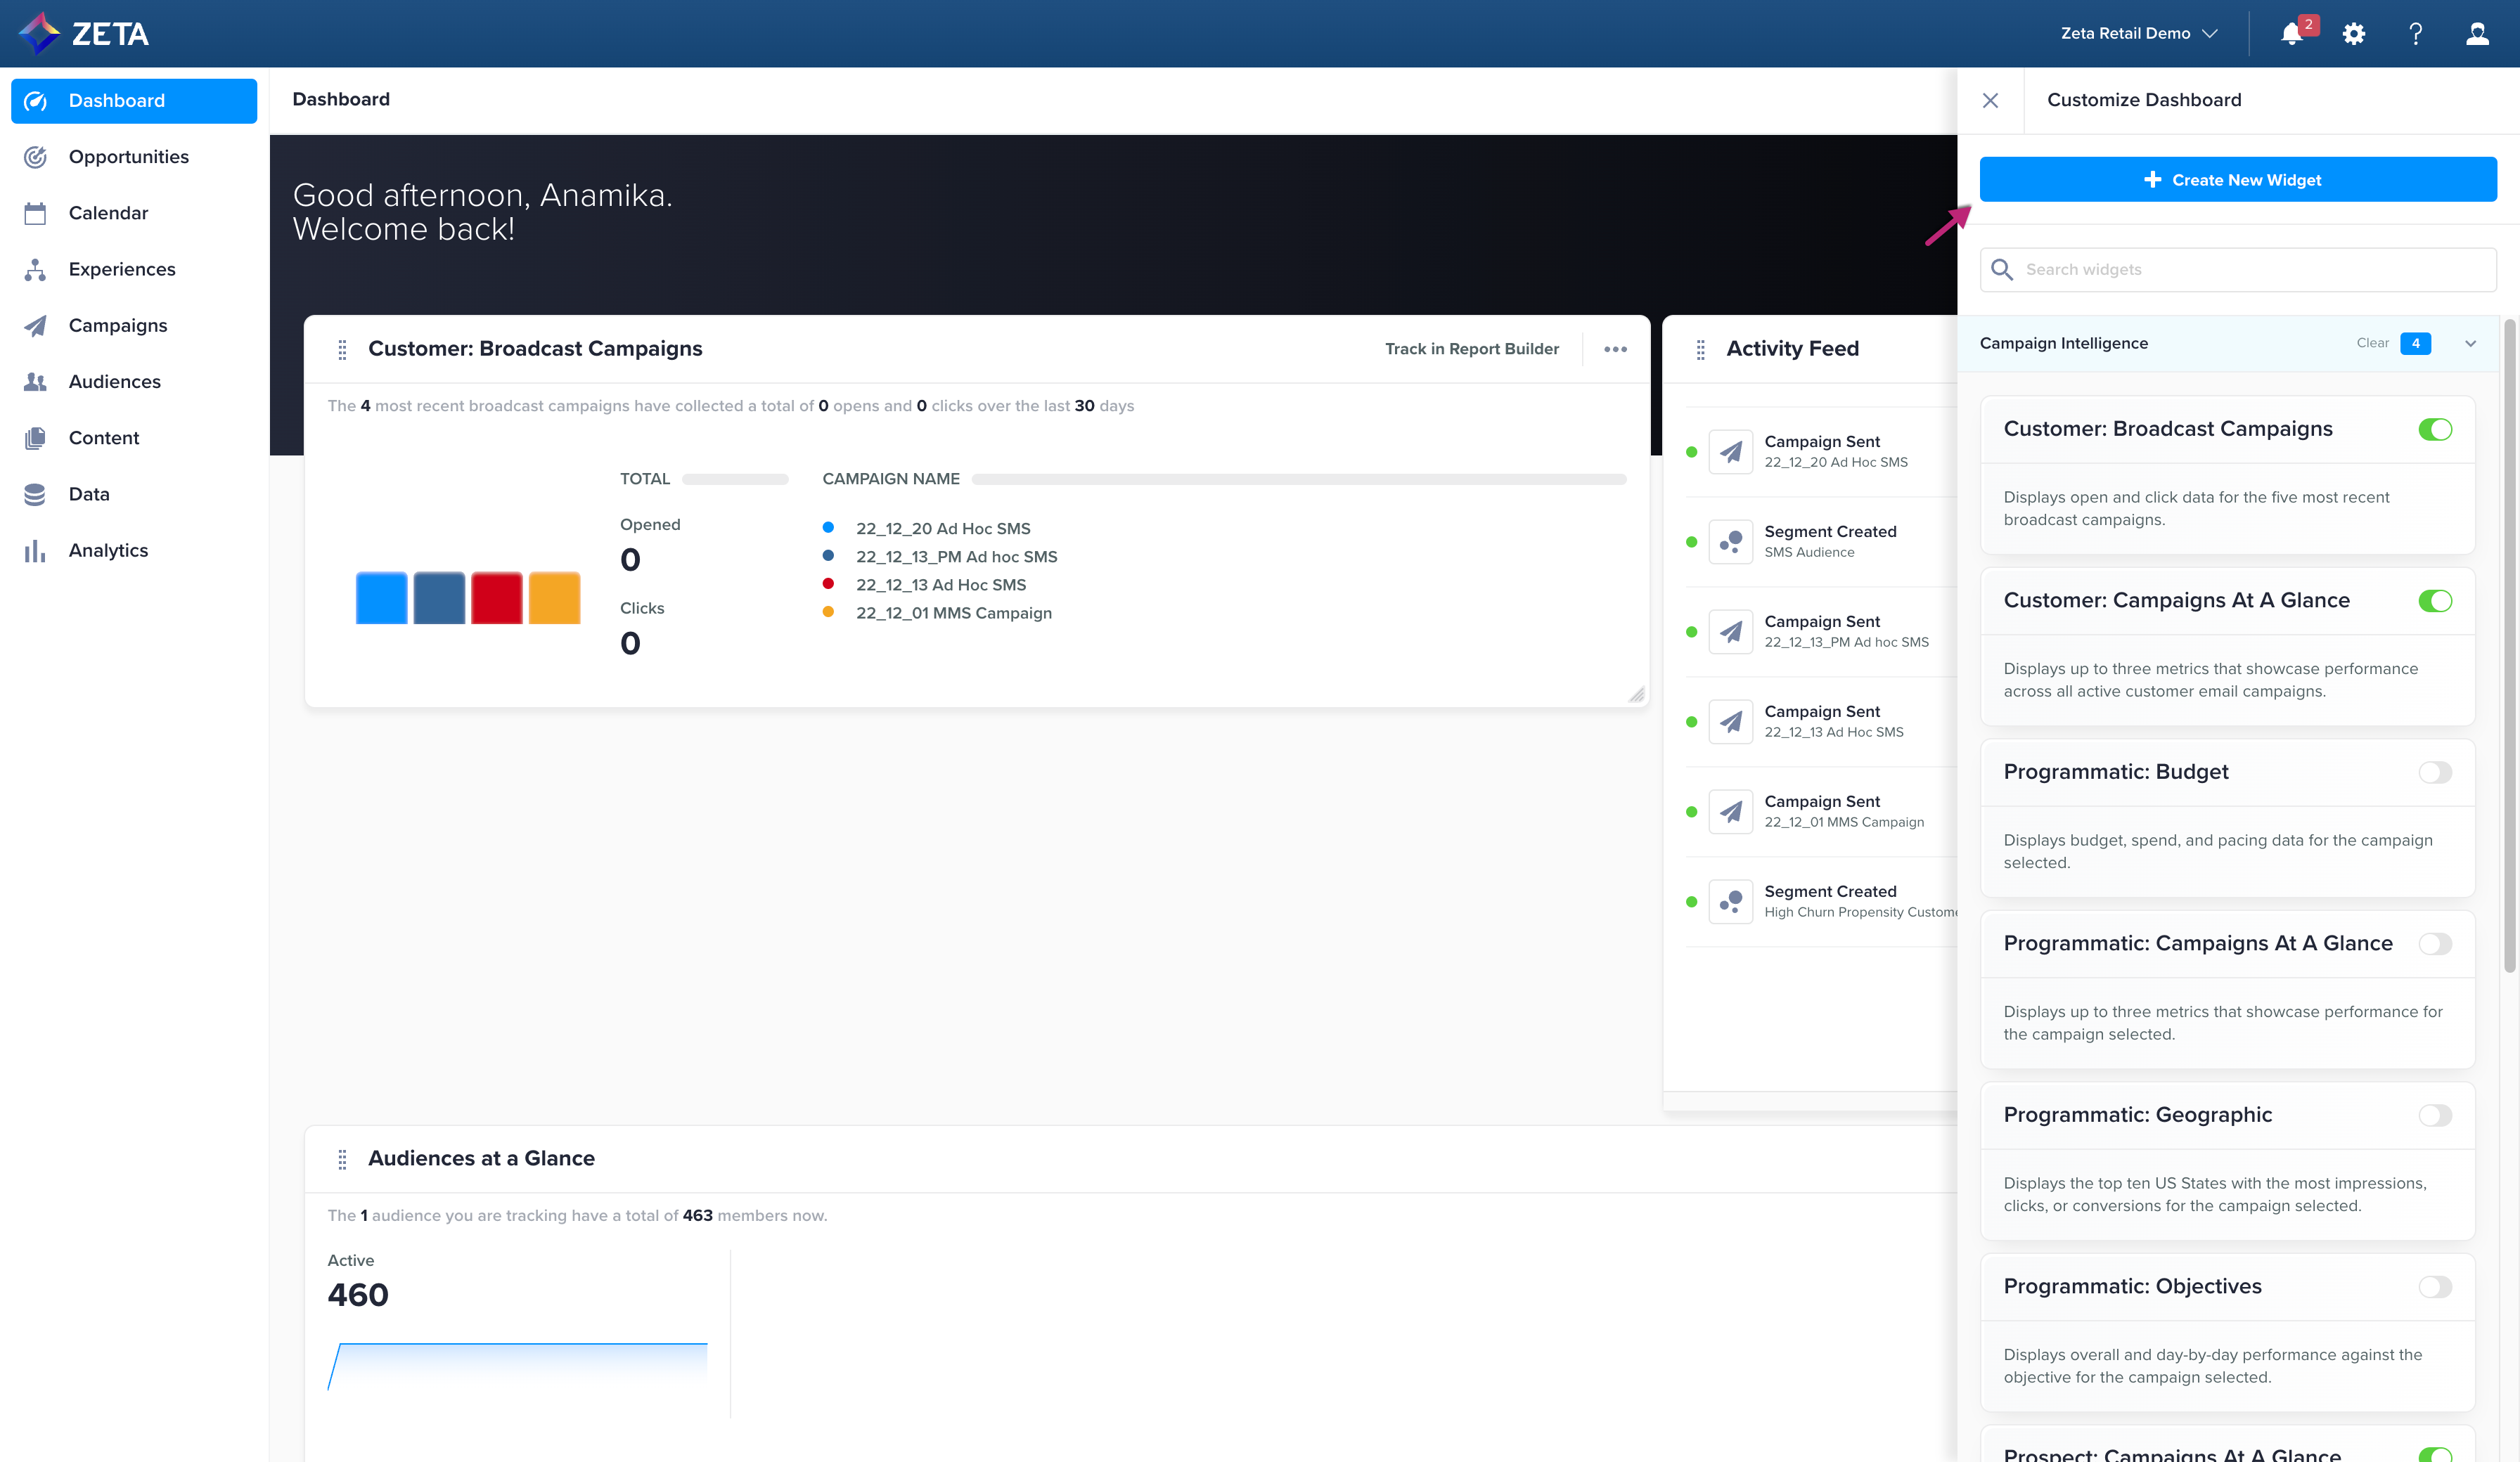
Custom Widgets
The custom widget feature on the dashboard allows you to bring your most important reports to the forefront of your experience in the ZMP. You can create a custom widget by accessing the widget library:
1. From the dashboard’s action menu dropdown, select Edit Layout.
.gif?cb=1c169b4ae638baf7ac118ed8afcf6907)
-
This will bring up a list of your existing dashboard widgets organized by our new intelligent categories.
2. Click on Create New Widget.
3. Within the screen that appears, give your widget a name and an optional description.
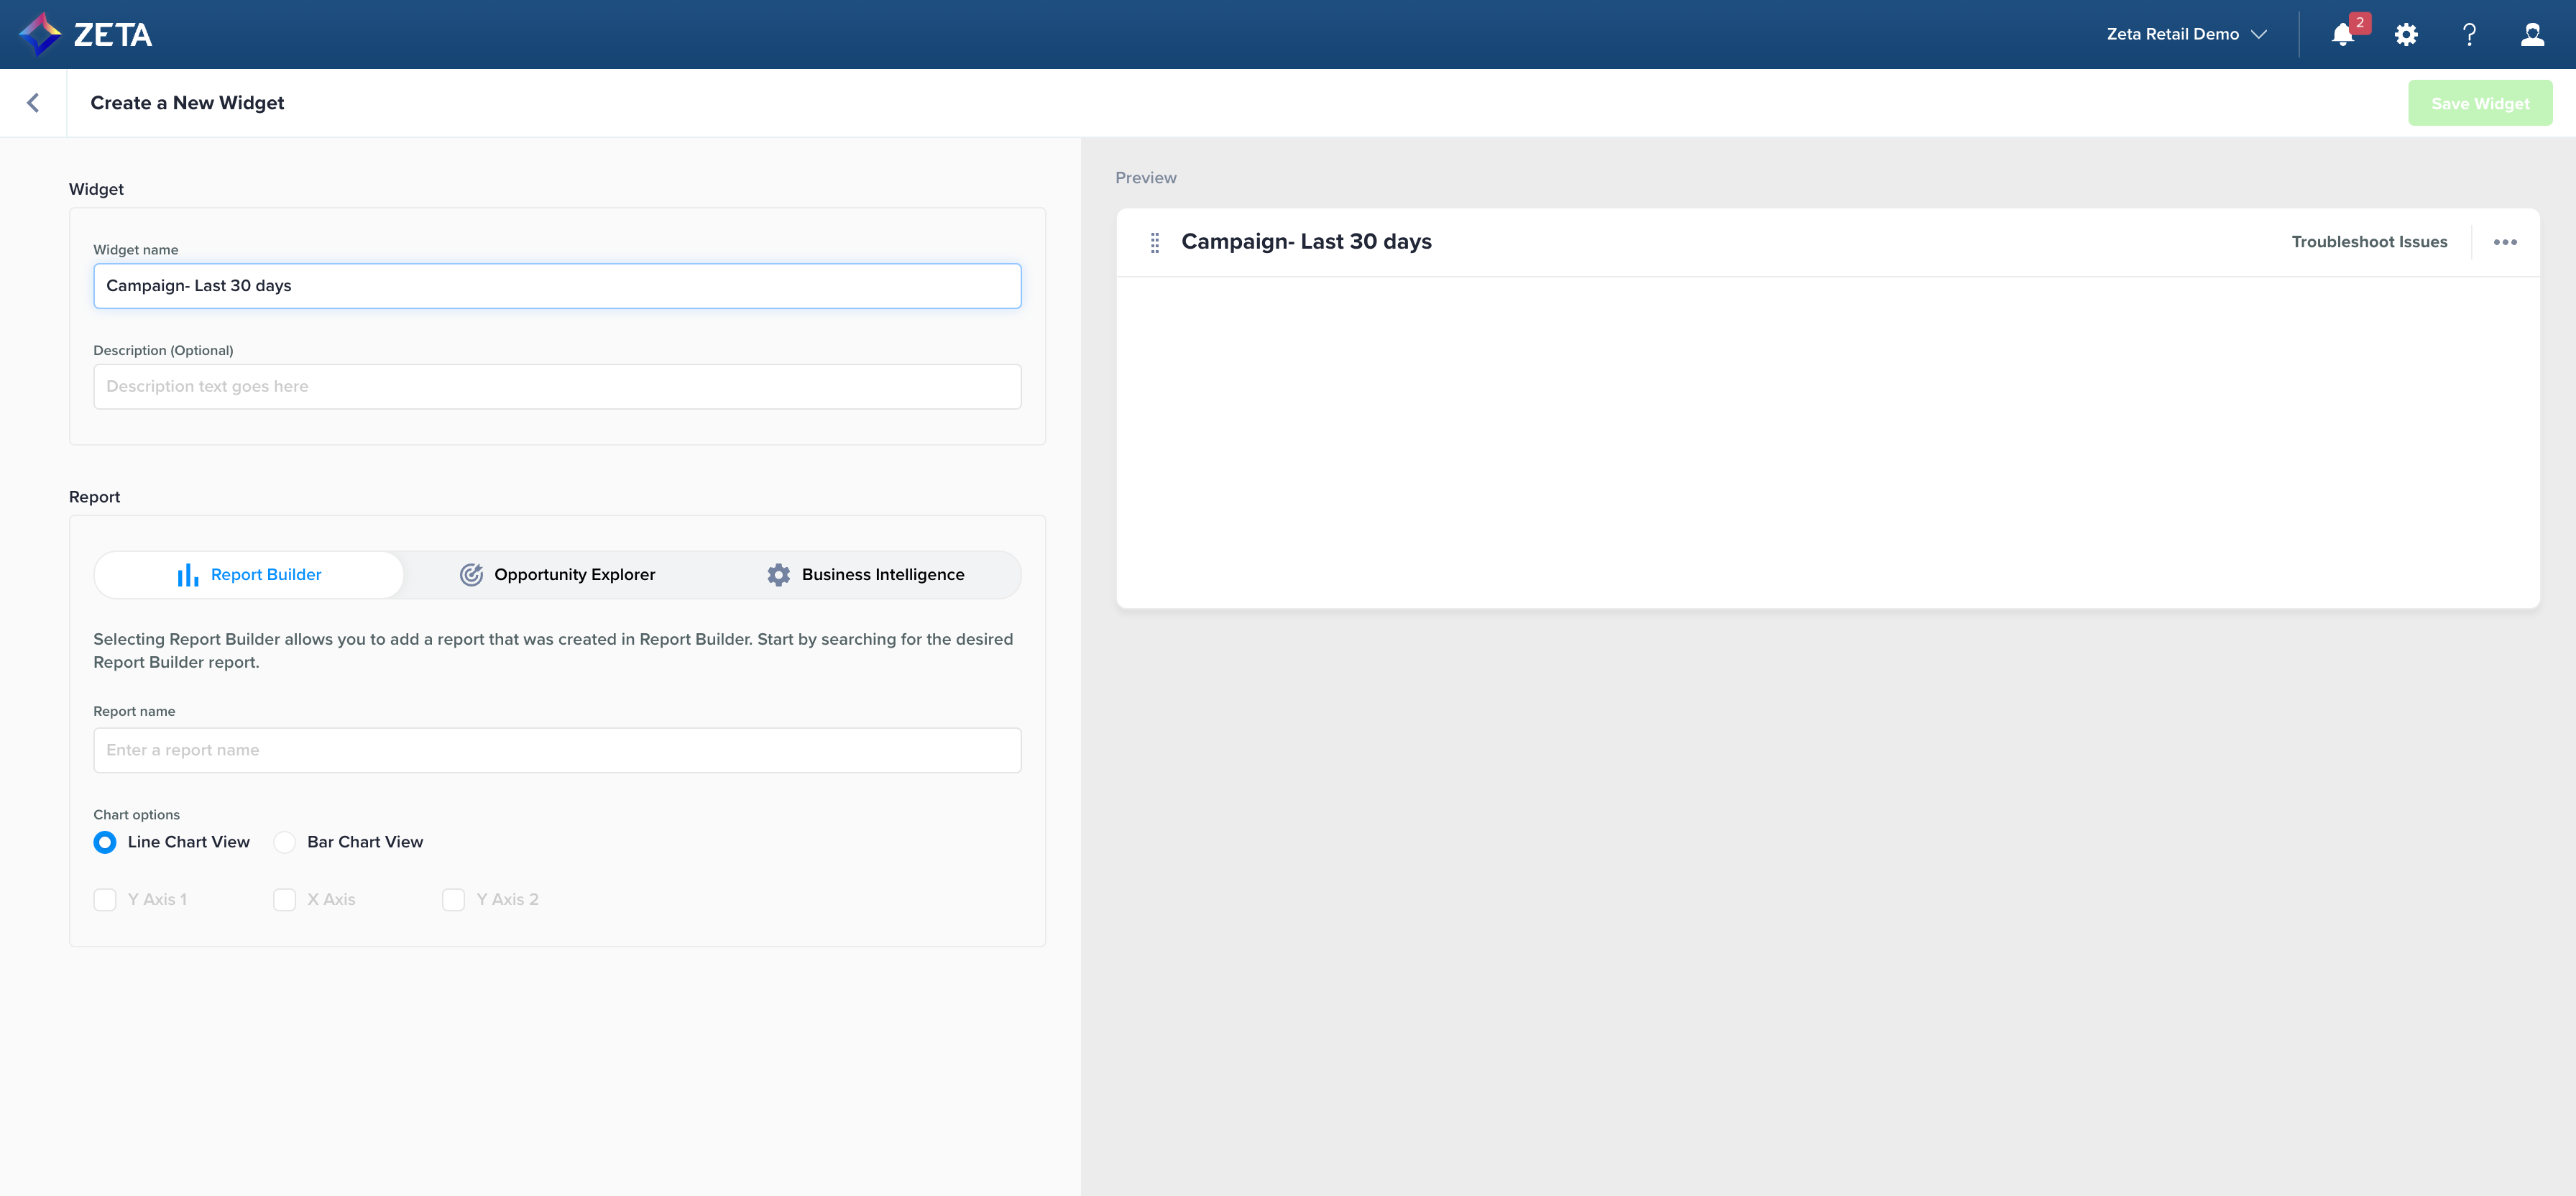
Note: Every individual's dashboard is customized to their personal account. However, reports are shared across all users of the account.
4. There are three different tools you can create a custom widget from:
-
Report Builder
-
Select the name of the report and whether you'd like to see the results in a line or bar chart format.
-
While the preview of your widget appears on the right, click on Save Widget to add the custom report directly to your dashboard.
-
.gif?cb=4accb1dc652fcc3249d358332525faab)
-
Opportunity Explorer
-
Following the same steps as above, select Opportunity explorer and select the name of your report.
-
.gif?cb=3e8f4990848f11aa2eba2f4a50e56216)
-
Business Intelligence Tool
-
Following the same steps as above, select Business Intelligence and select a ZMP report, or enter an embed report link, or upload a report file.
-
.gif?cb=20a93a79d9d38c593052362eff784d47)
5. As the custom report(s) have been added to your dashboard, you can directly preview them by clicking on Open Report.
.gif?cb=94056d9c86789be56bbf6e6588644f6f)
|
-20230103-094129.gif?cb=c0cf48c5749b991cf63fd6bfa739551e)
|
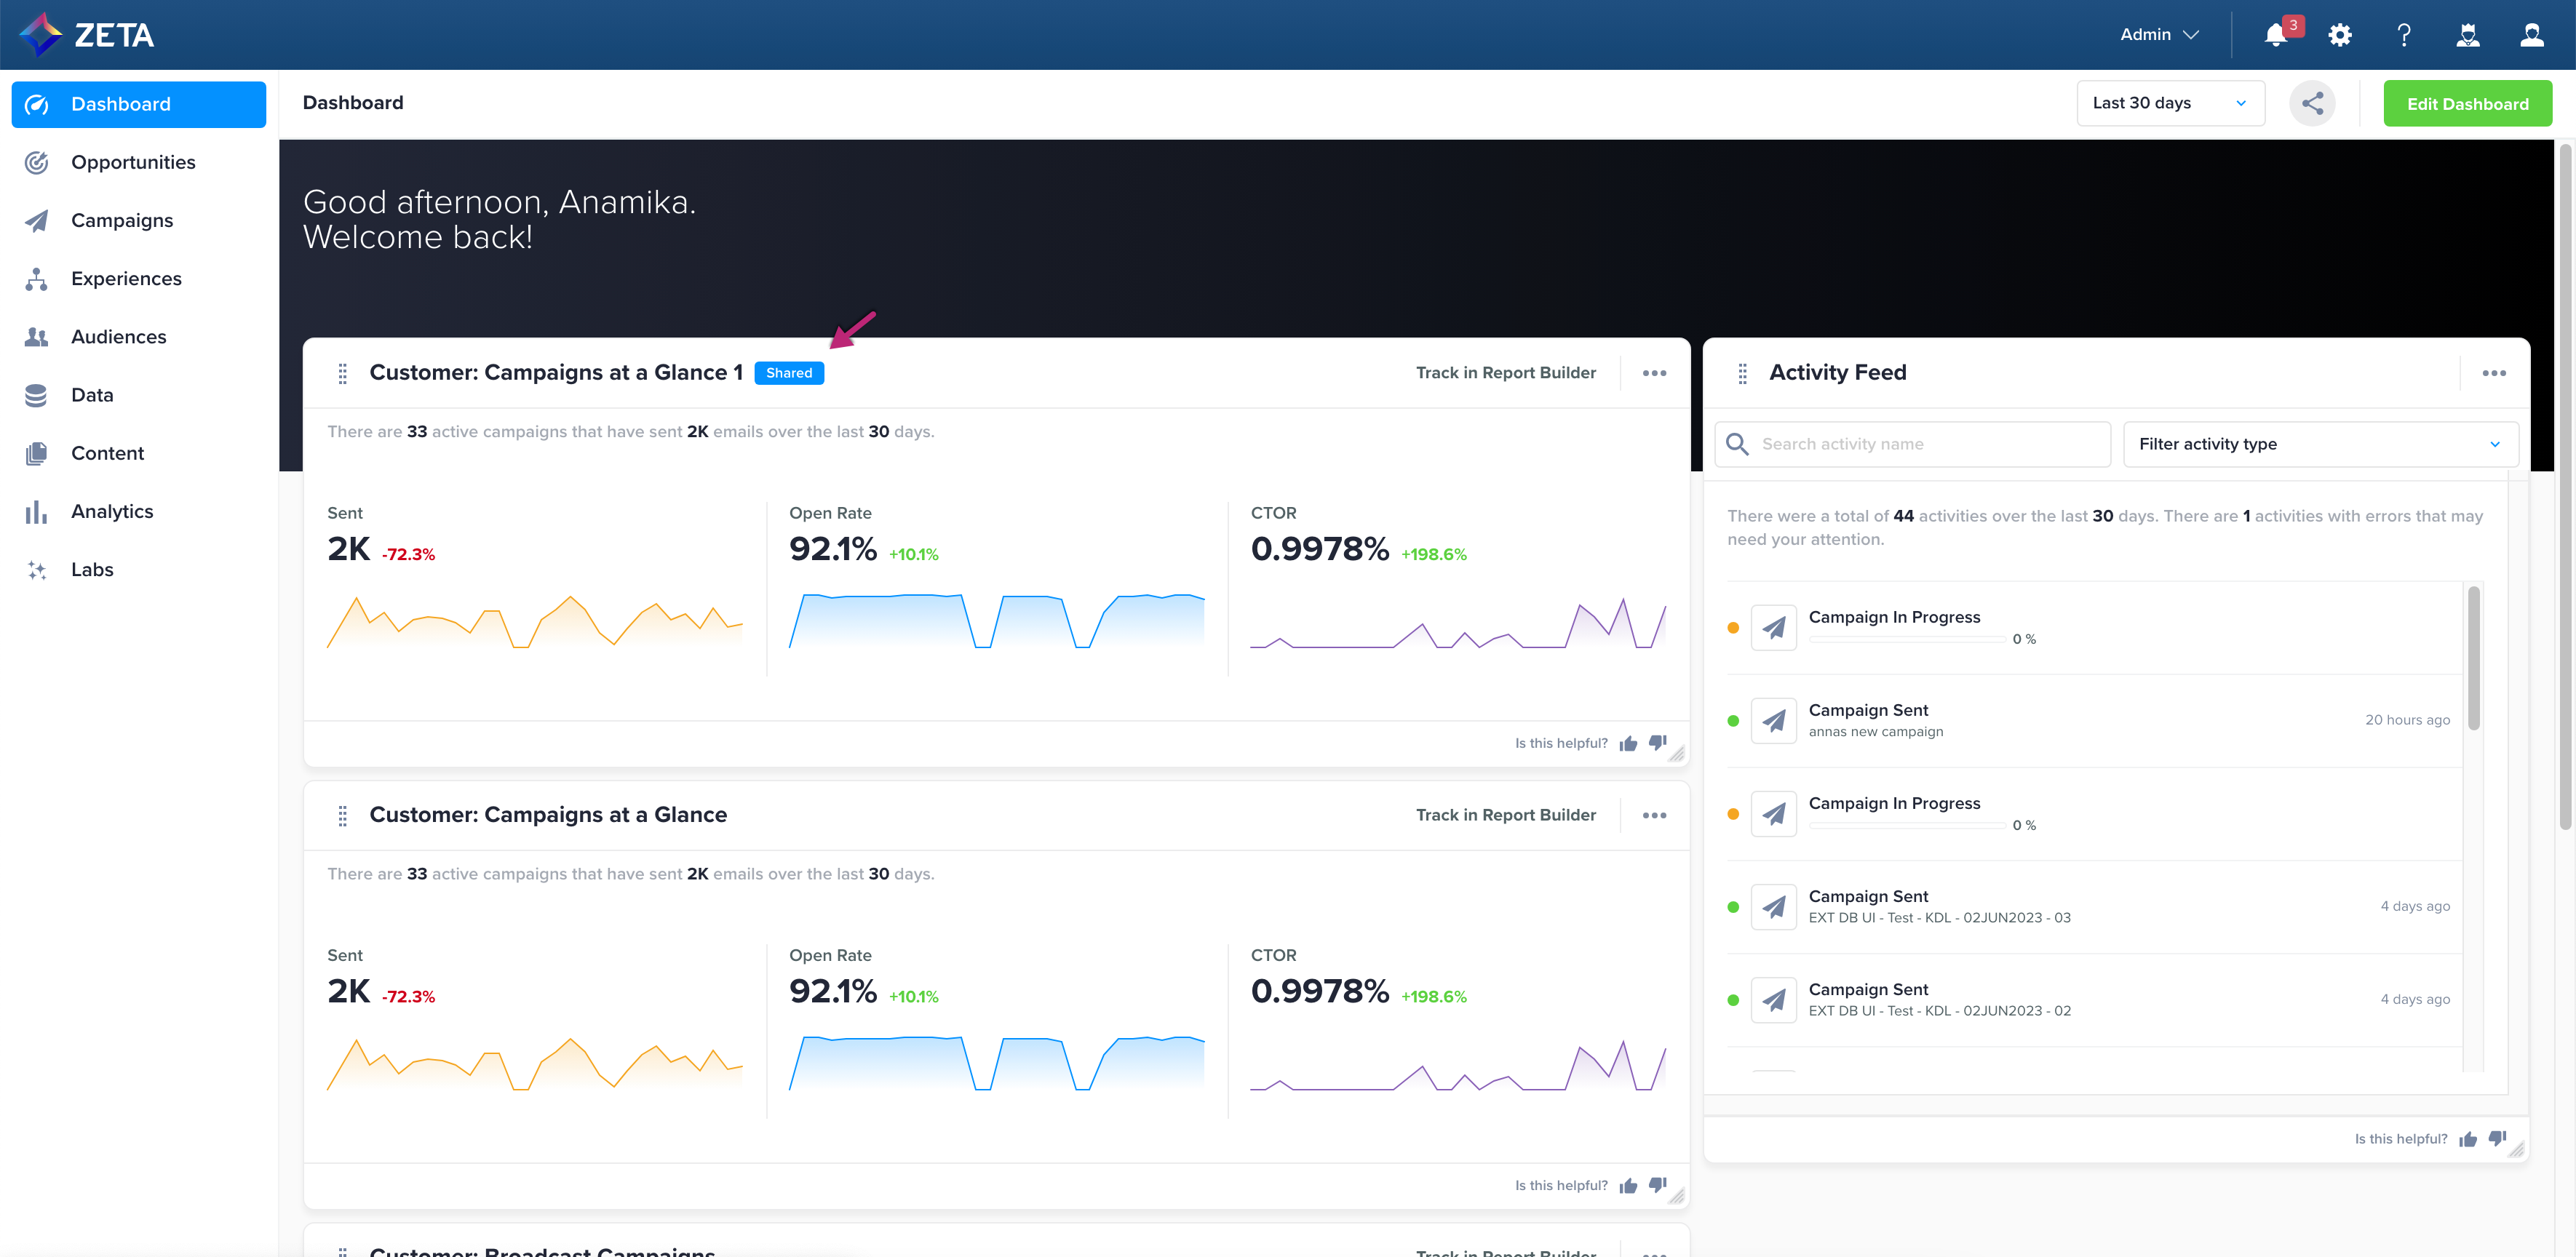
Sharing Widgets
You can easily share your pre-configured widgets with other users or accounts.
1. Click on the action menu (…) against the desired widget and select Share from the dropdown.
-20230606-091336.gif?cb=aab0c55c1695de298086350c1d8cfe6b)
2. As the contacts window slides open from the right, select the user you want to share the widget with.
3. Click on Share and a Share Successful message will pop up at the bottom-left.
4. On the other end, the user you shared the widget with will receive the following message:
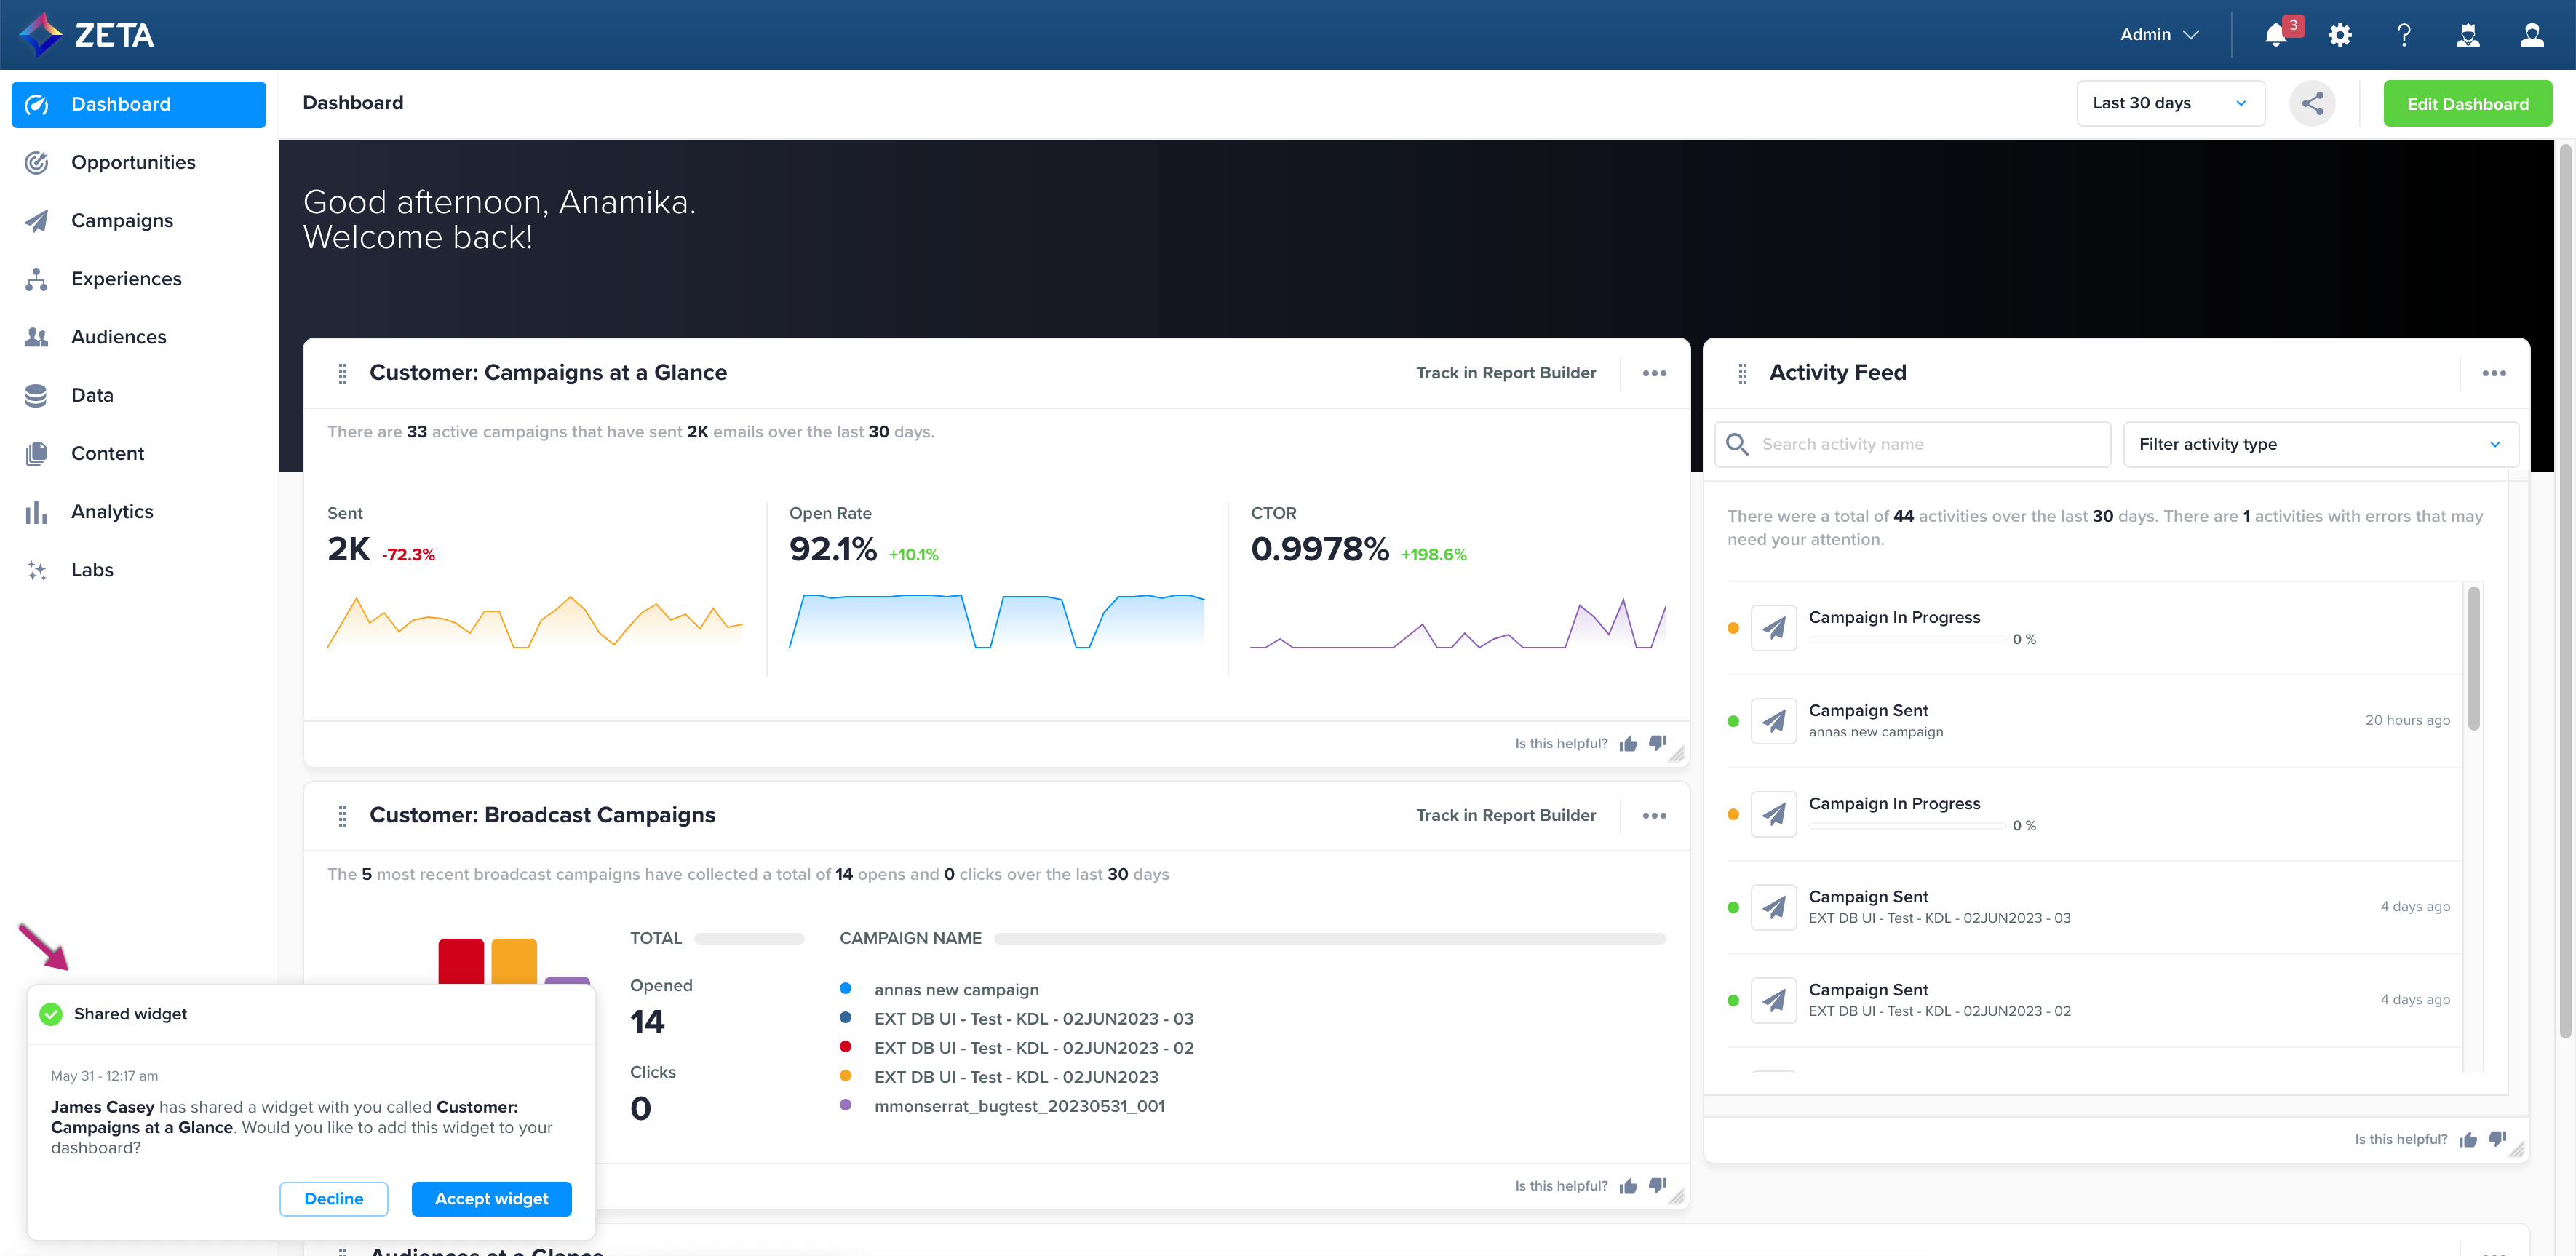
5. Clicking on Accept widget will add the widget to the user’s dashboard with a Shared tag beside it.
Sharing Dashboard
You can easily share your pre-configured dashboard with other users or accounts.
1. Click on the Share button right above the dashboard.
-20230606-092408.gif?cb=0328063bf462be7251e0a33b02f32bd5)
2. As the contacts window slides open from the right, select the user you want to share your dashboard with.
3. Click on Share and a Share Successful message will pop up at the bottom-left.
4. On the other end, the user you shared the dashboard with will receive the following message:
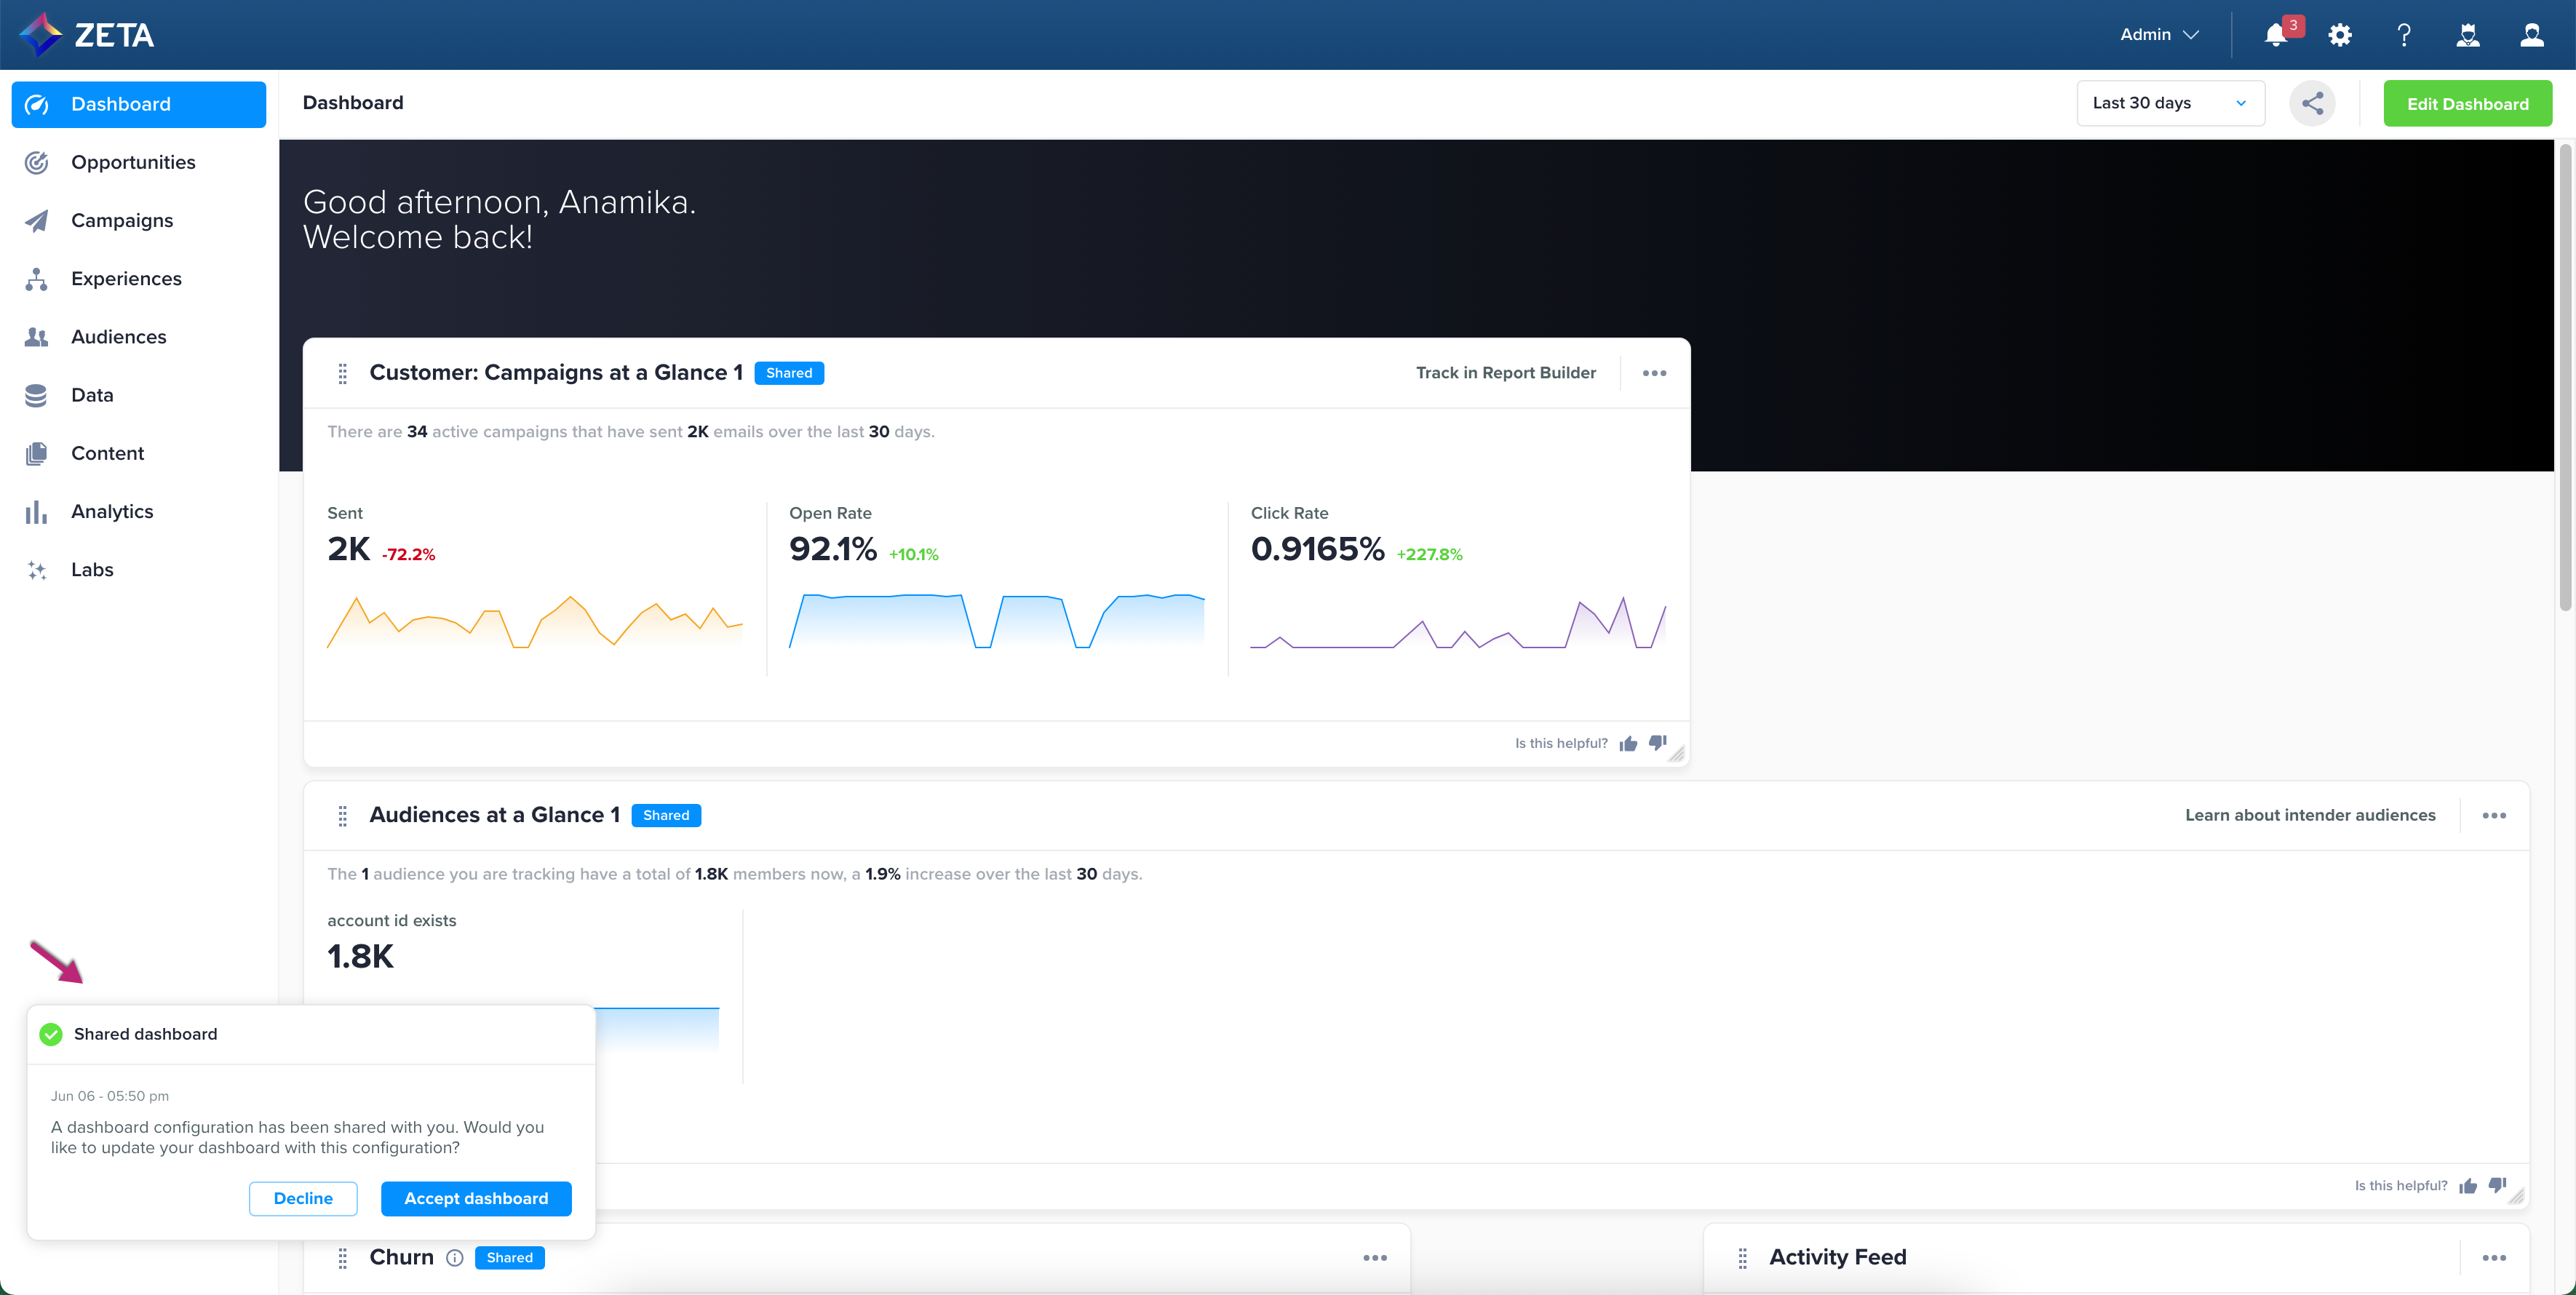
5. Clicking on Accept Dashboard will add the shared dashboard’s widgets to the user’s dashboard with a Shared tag beside all of them.
-20230606-100635.gif?cb=c595def199d4329706c4e31e26023936)
FAQs
|
Question |
Answer |
|---|---|
|
Help! I can't see any dashboard! |
To enable your dashboard, please reach out to your account manager. |