

Creating Reports
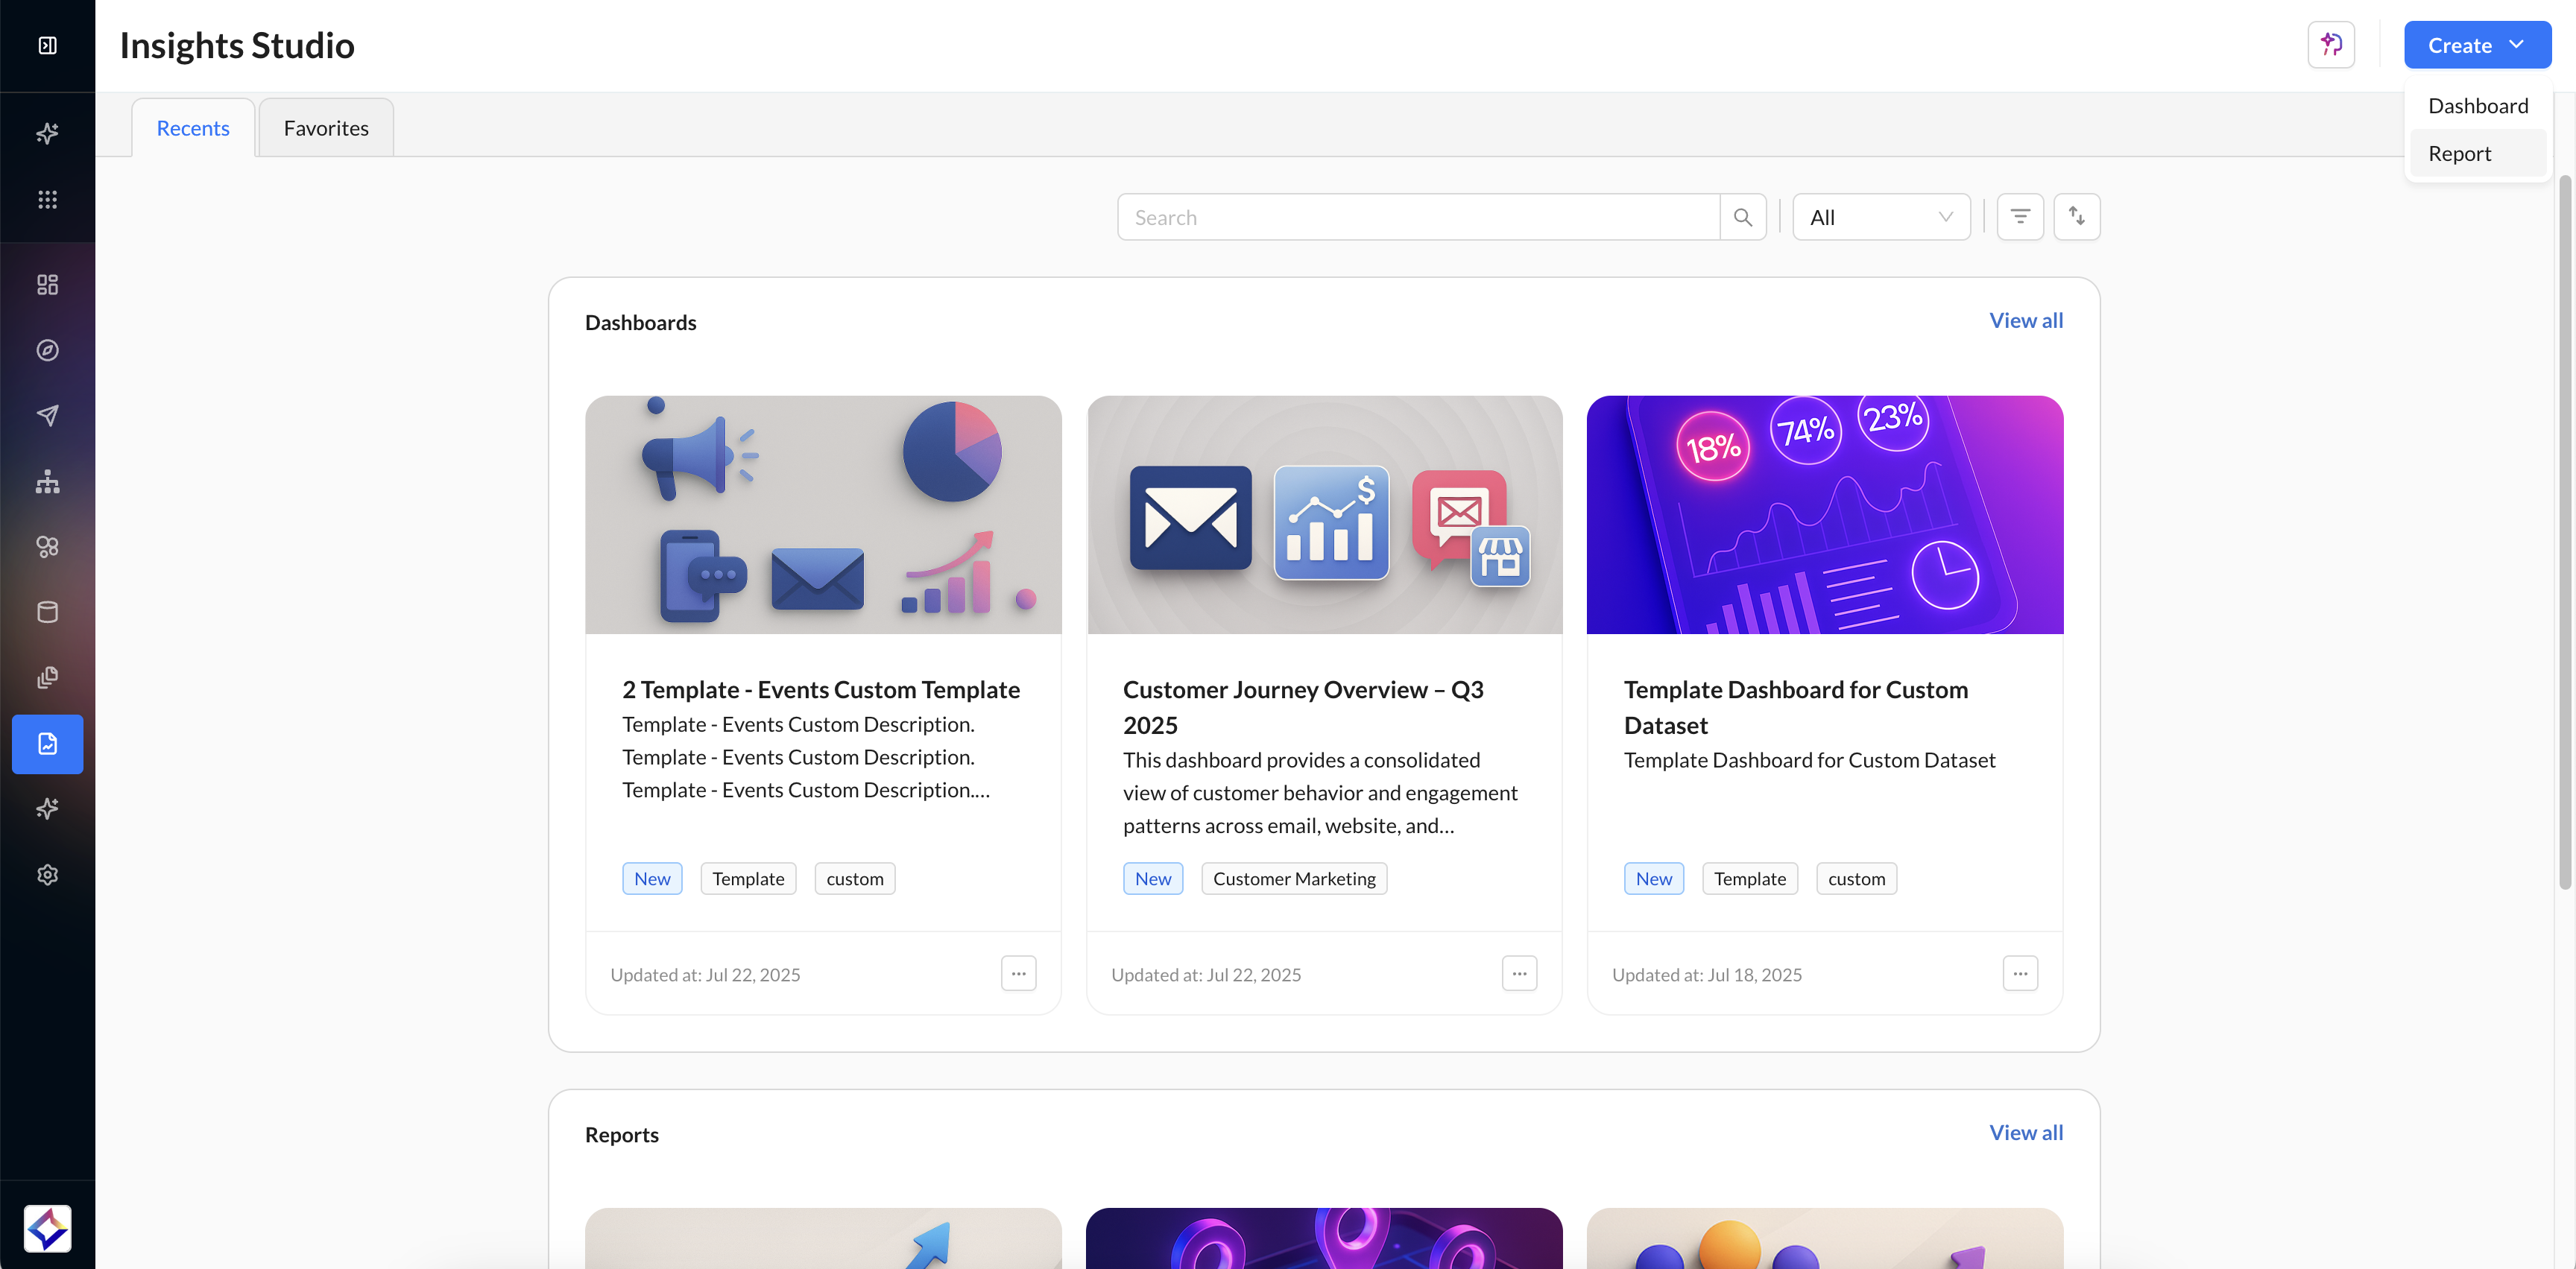
To create a customizable, data-rich report, click the blue Create button in the top-right corner and choose Report from the dropdown.
Data
When you begin creating a new report, the builder opens with the Data section by default. This is where you define the foundation of your report by selecting the dataset it will be built on.
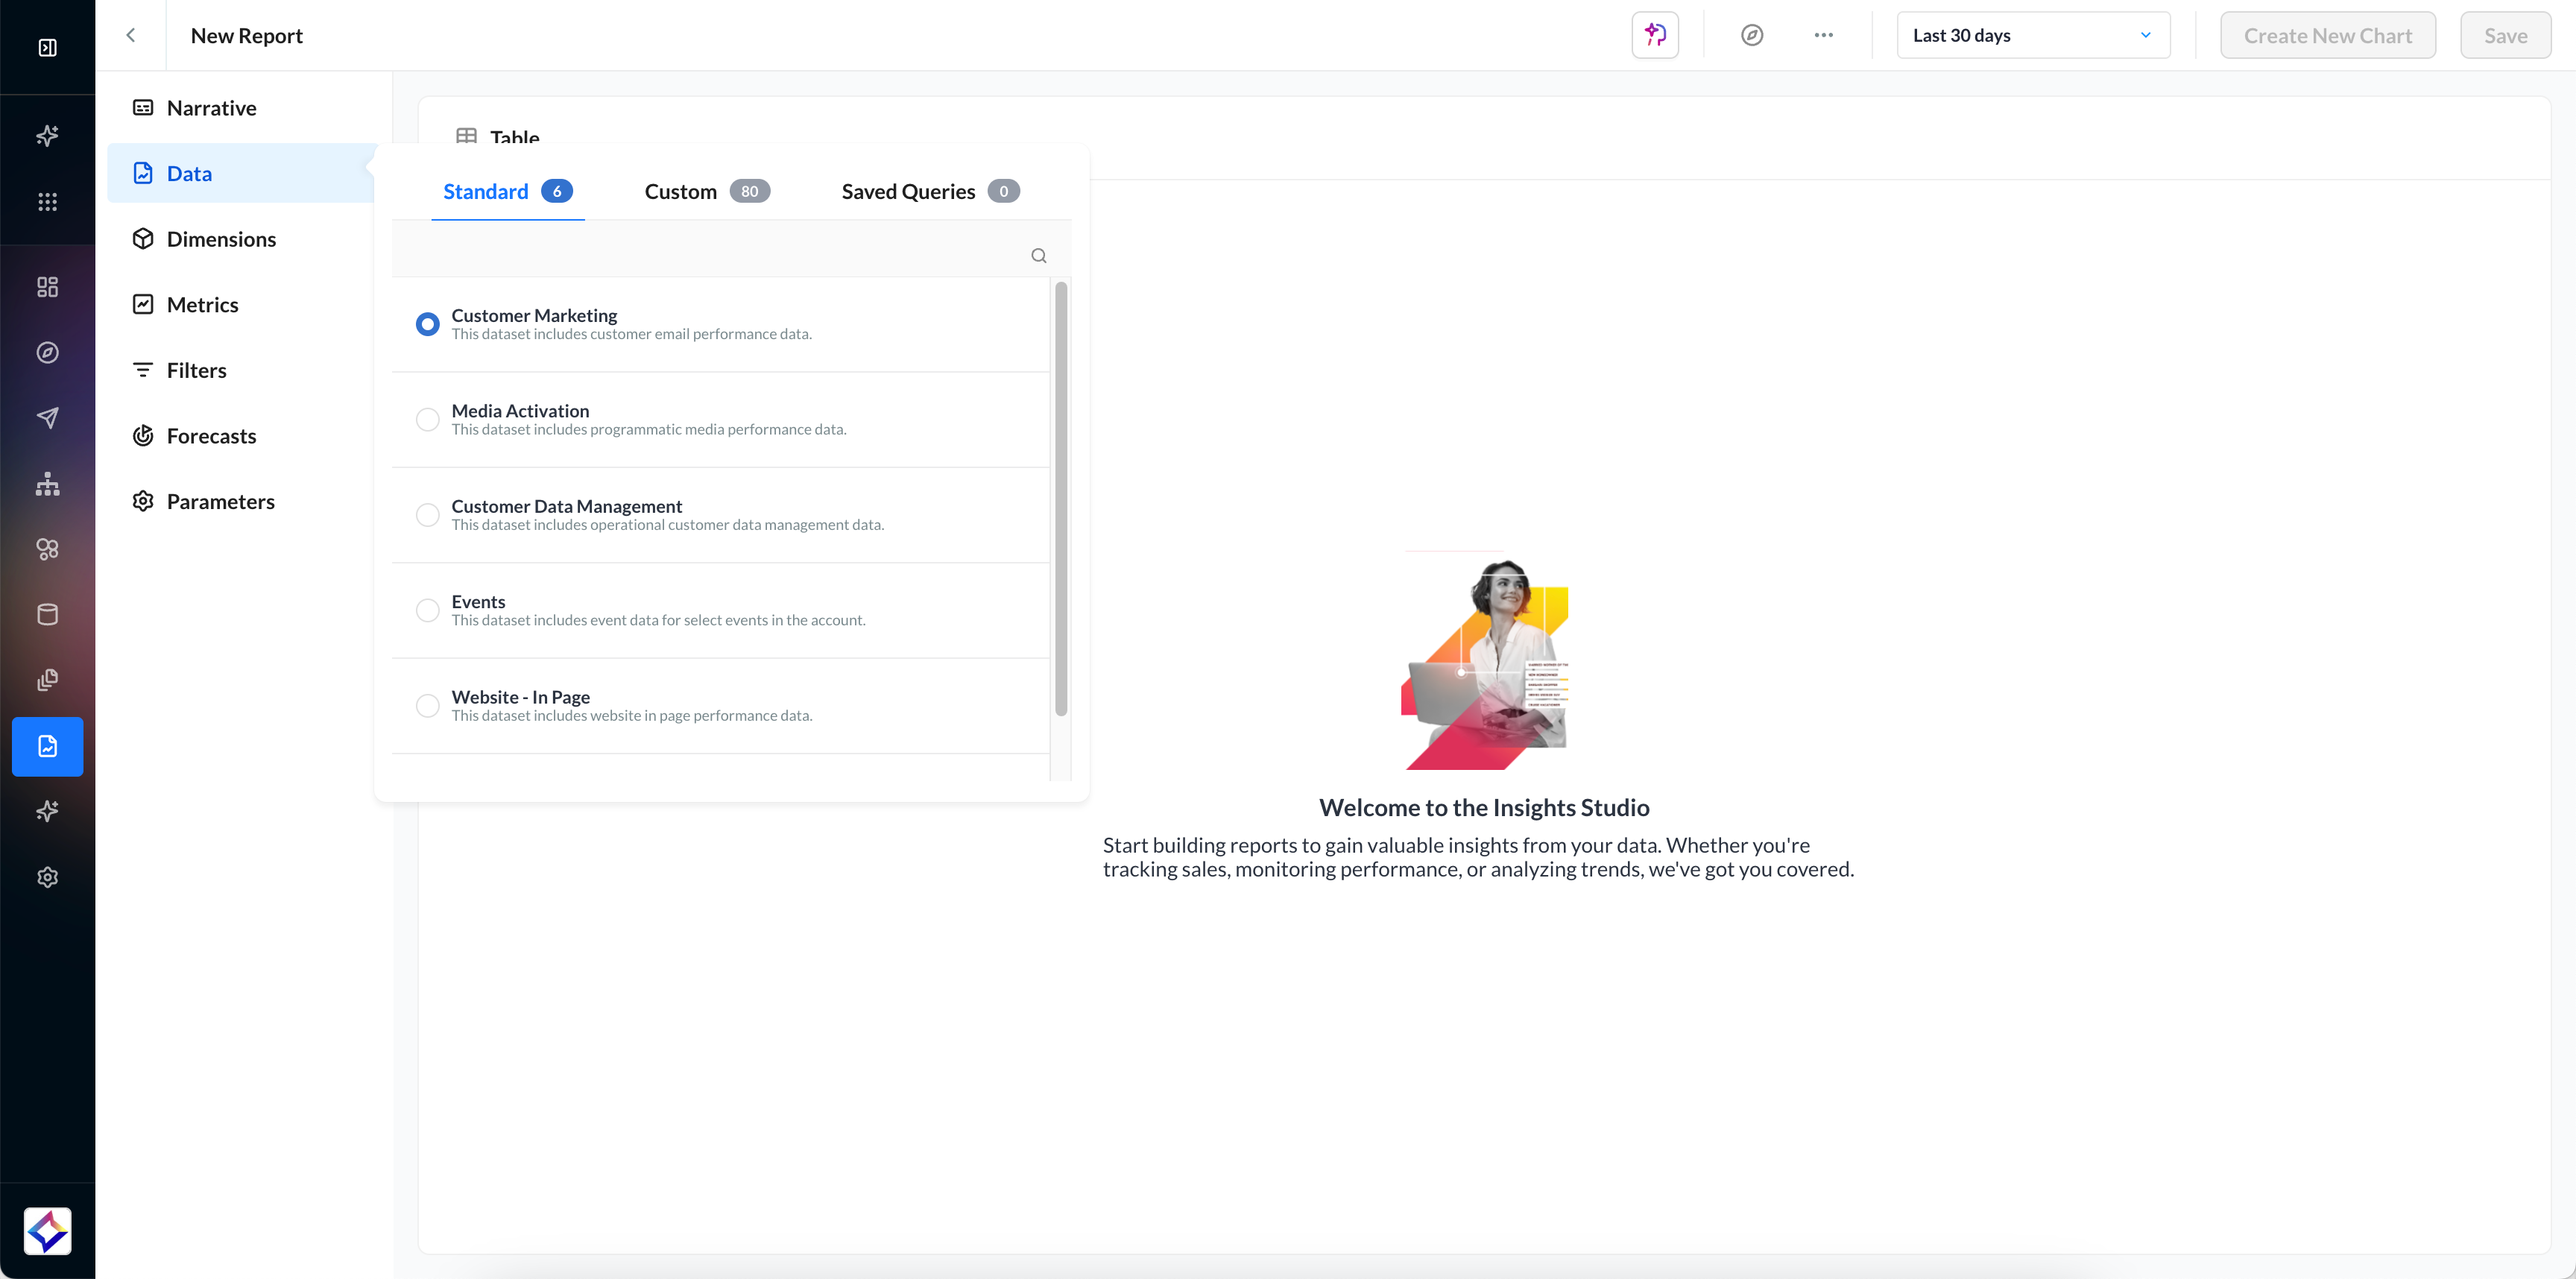
The Data Panel allows you to choose from the following dataset categories:
|
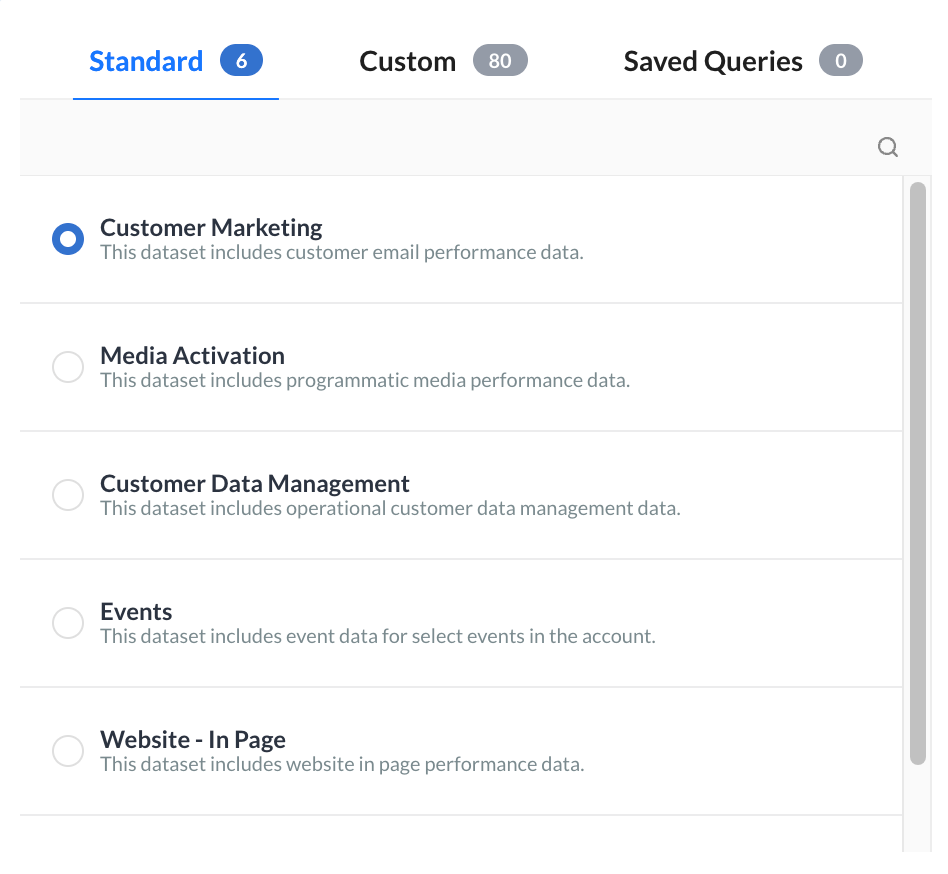
Standard Datasets |
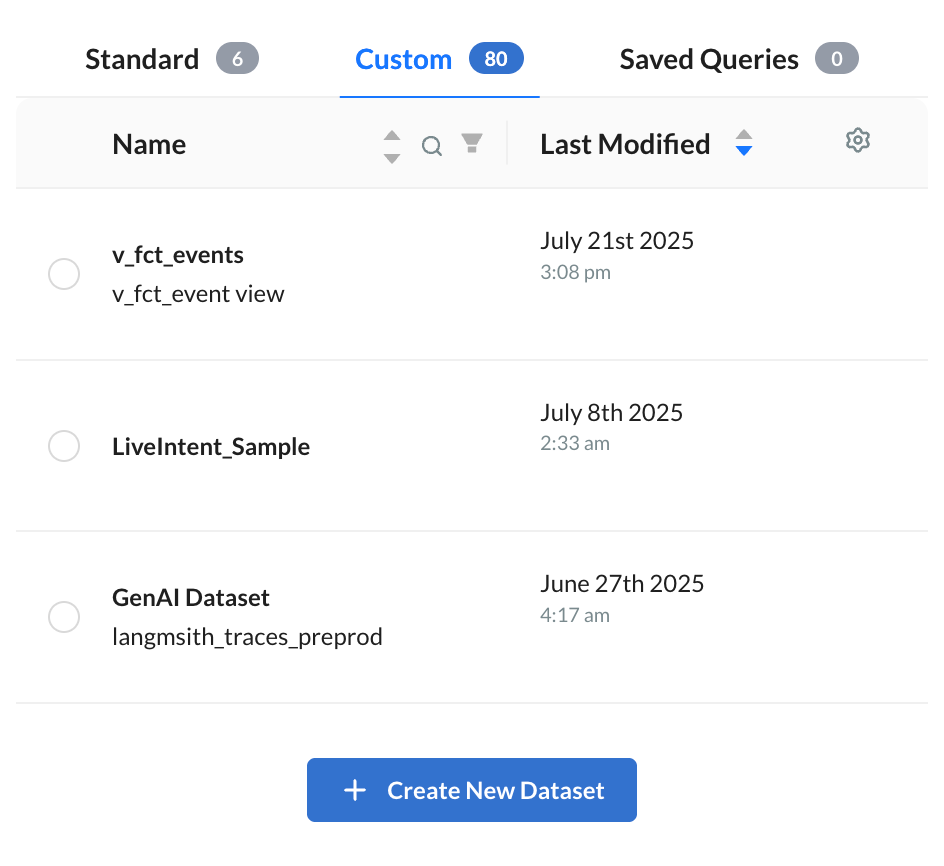
Custom Datasets |
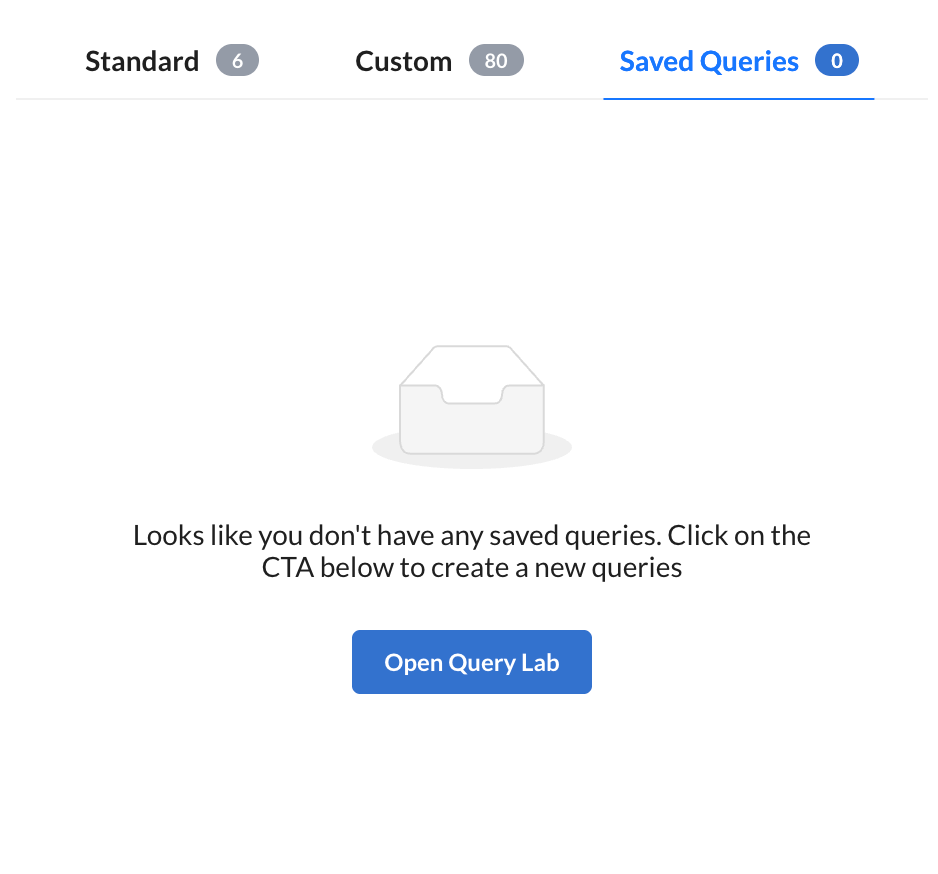
Saved Queries |
|---|---|---|
|
These are Zeta-provided, ready-to-use datasets derived from campaign activity and platform tracking. |
If your account has any datasets configured specifically for your needs, they will appear under this tab. These are tailored to your organization’s data schema and business requirements. |
Any prebuilt or frequently used data queries saved from past report builds will be listed here for quick reuse. |
|
Advanced users will have the option to edit and add aggregate metrics to the custom dataset. The updated dataset will also be available to other users in the account. Speak with your Account team if your team would like to get access to the Edit capability. |
|
Dimensions
The Dimensions tab is where you can select all the dimensions you would like included in your report.
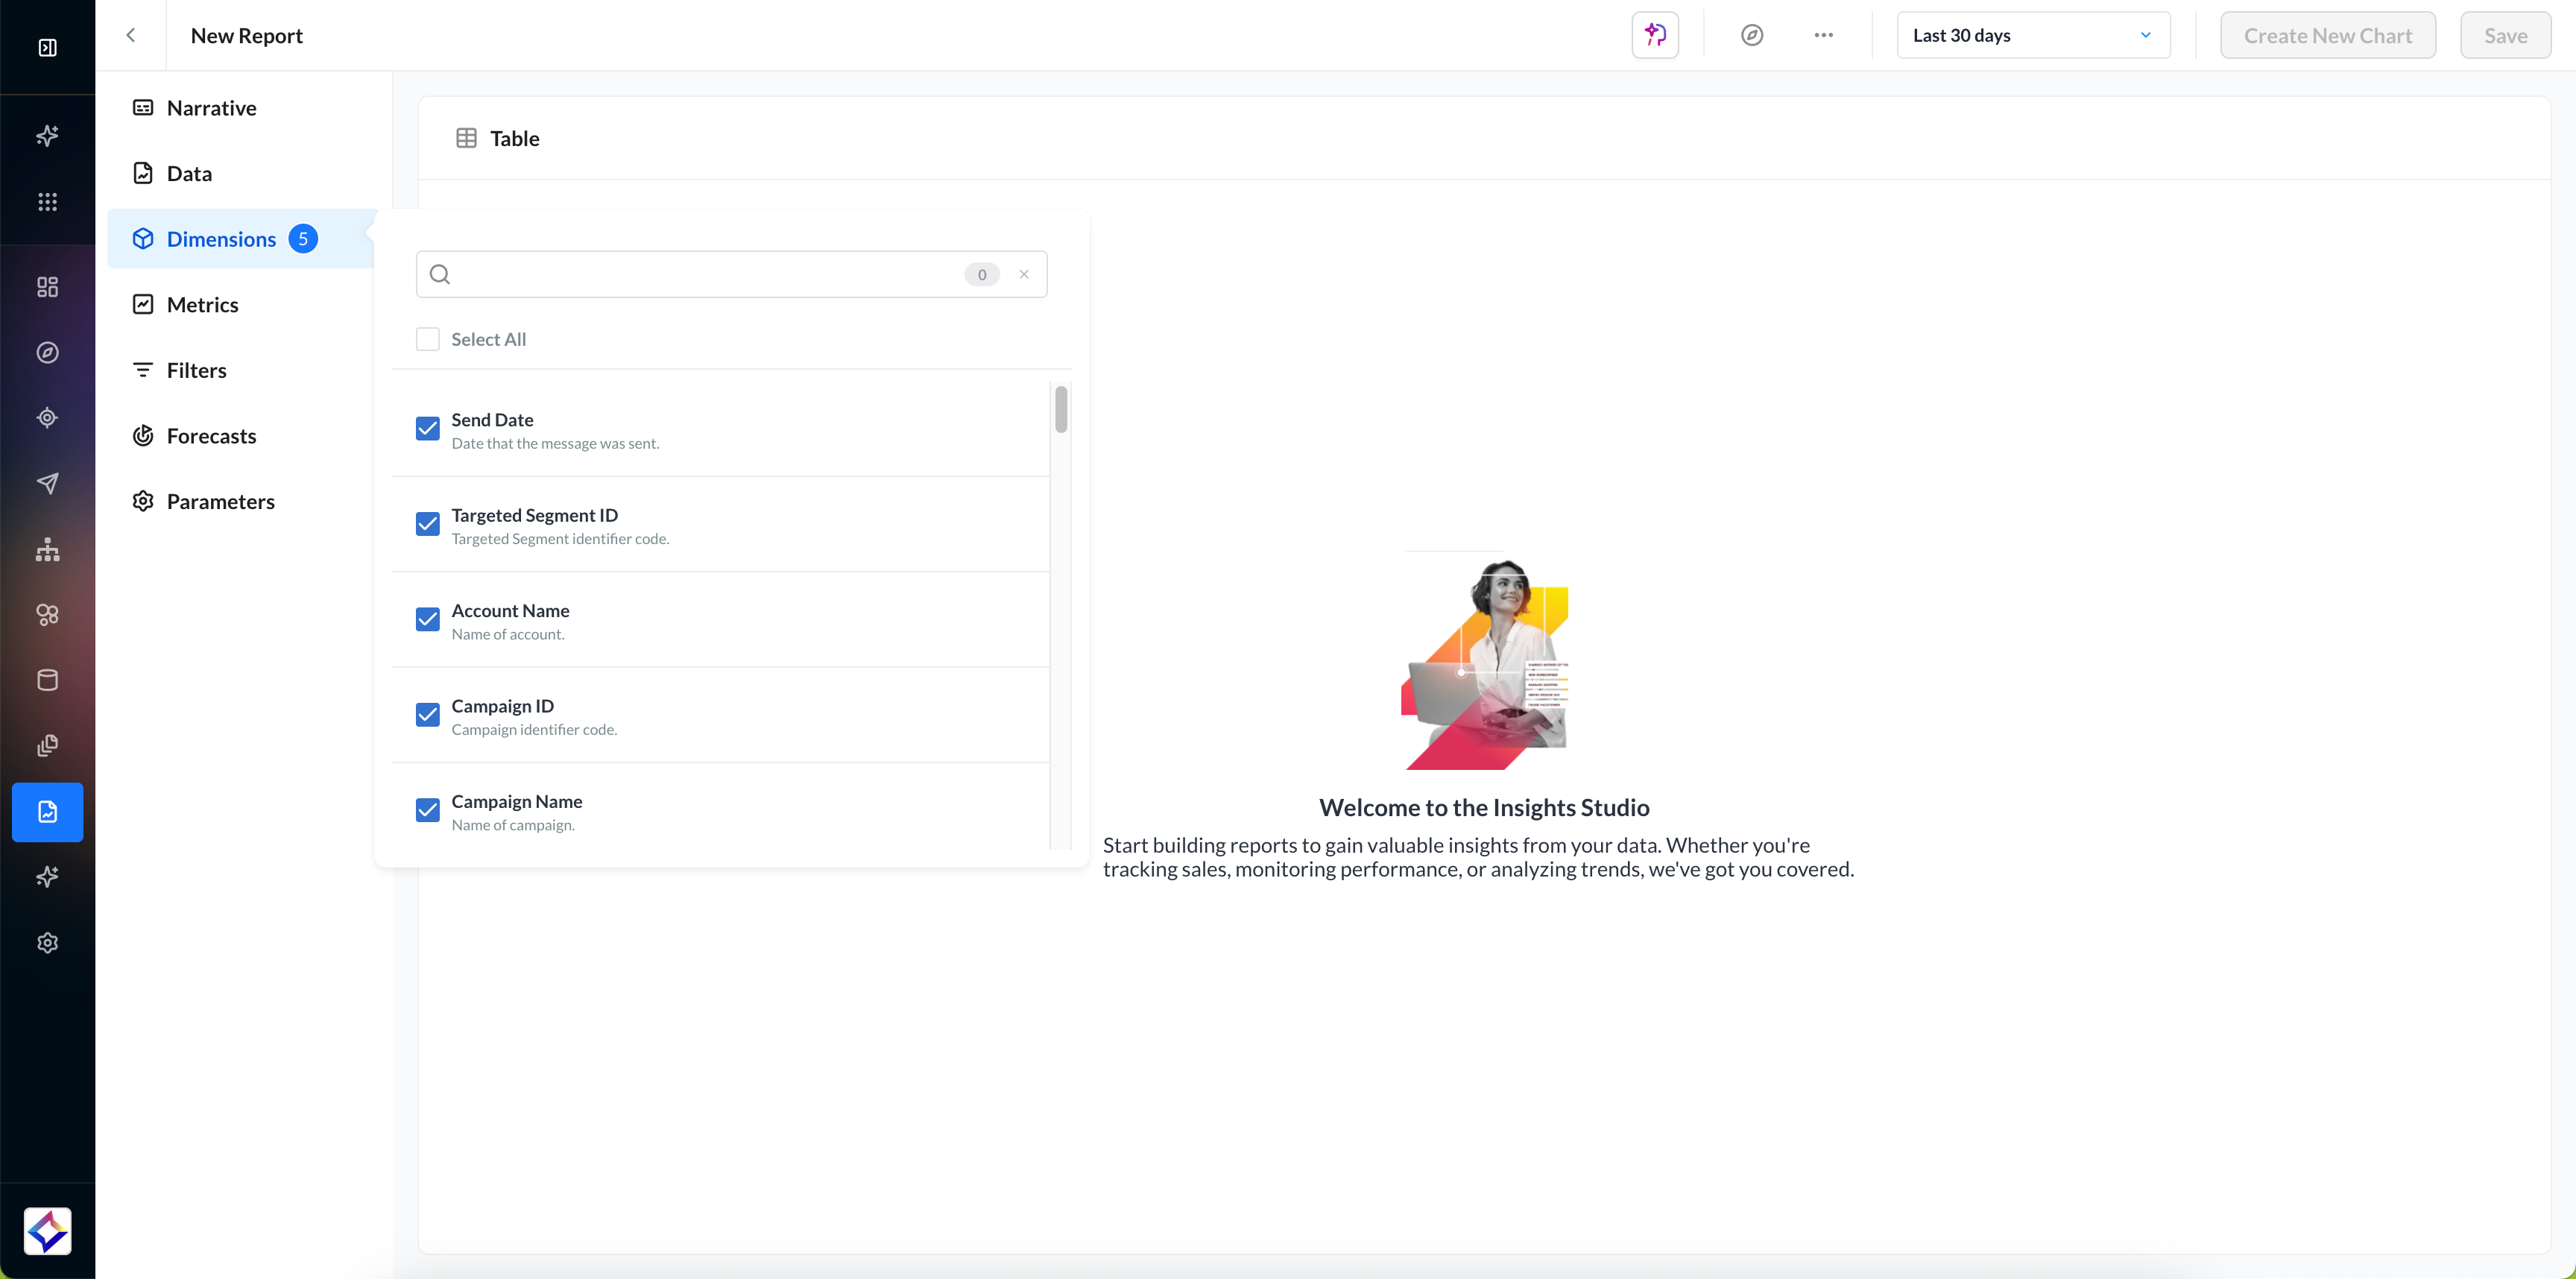
The Metrics & Dimensions Dictionary is always available for your reference.
Metrics
The Metrics tab is where you can select all the metrics you would like included in your report.
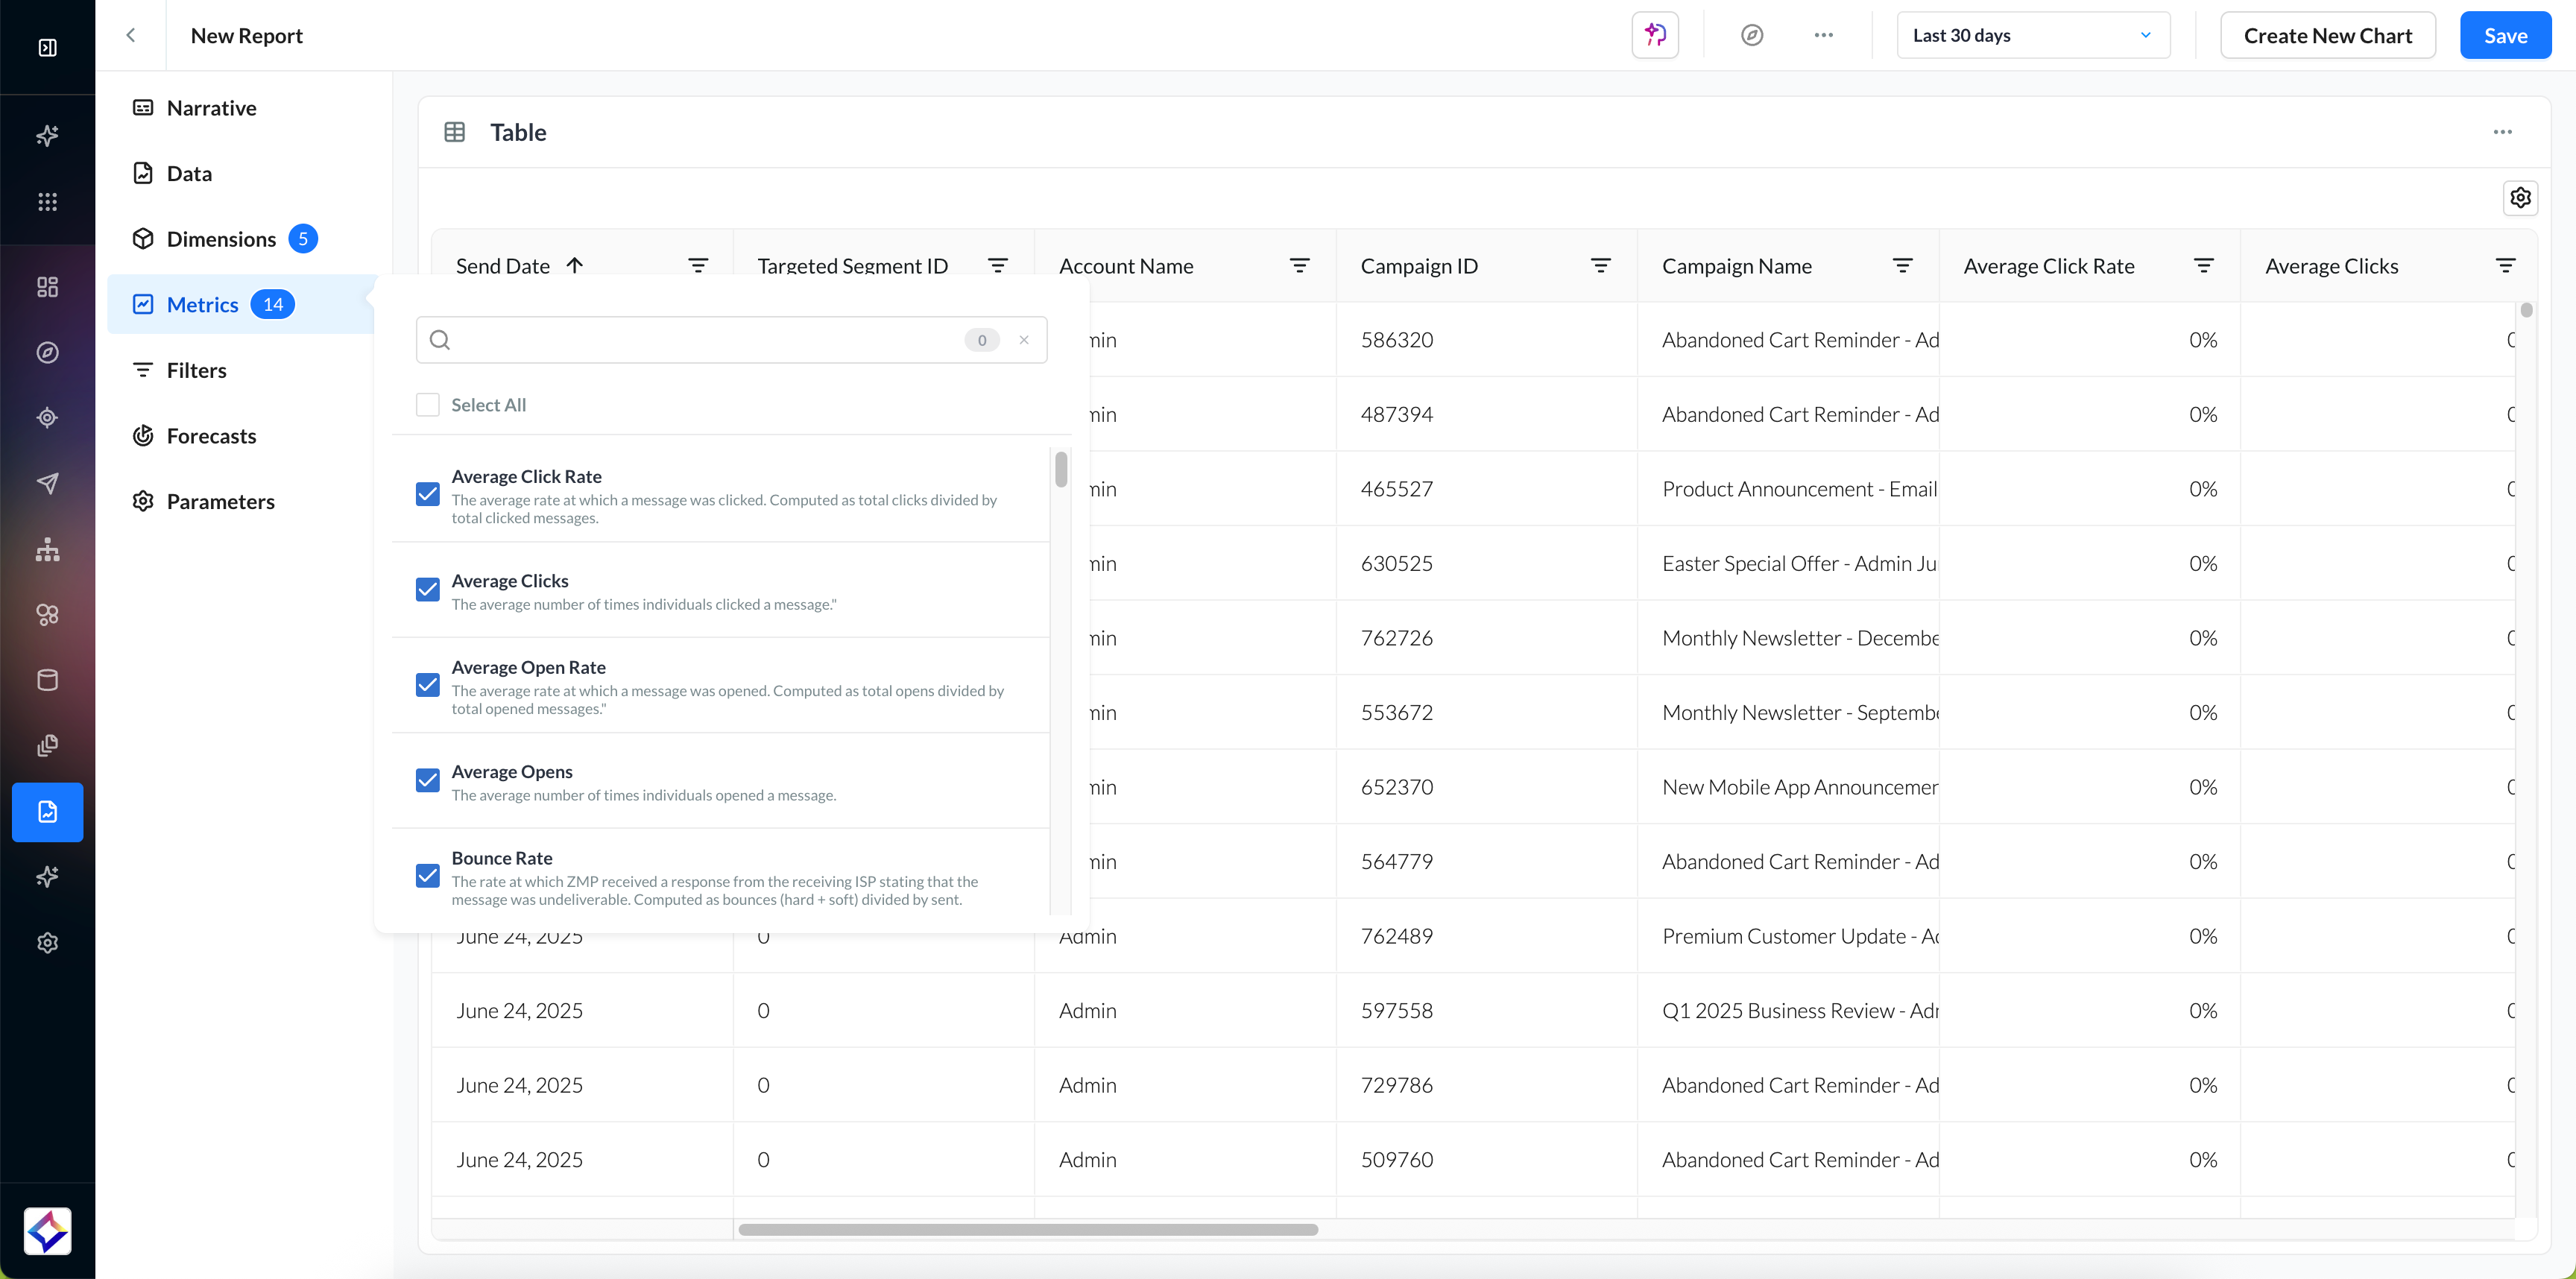
The Metrics & Dimensions Dictionary is always available for your reference.
Filters
Once you have made your metric and dimension selections, you can filter your data in the Filters tab.
Apply any global filters to refine data for analysis, e.g., specific Campaign, Channel, etc. You can add more filters by selecting the Add Filter button. When adding a new filter, you can adjust the and/or operator.
-20250723-060243.gif)
-
Unsupported filters for Programmatic reports include: Does not contain, Contains one of, Starts with, Ends with, Lesser than or equal, Greater than or equal, Between.
-
OR logic is not supported for Programmatic reports; only AND conditions are allowed.
-
Some metric filters accept only numeric values.
Forecasts
In the Forecasts tab of the Builder, you can select metrics from a limited list to forecast 1, 7, or 30 days out for Customer Marketing or Media Activation reports.
-20250723-061438.gif?cb=bb91954e481f466ffb955875a319fdc0)
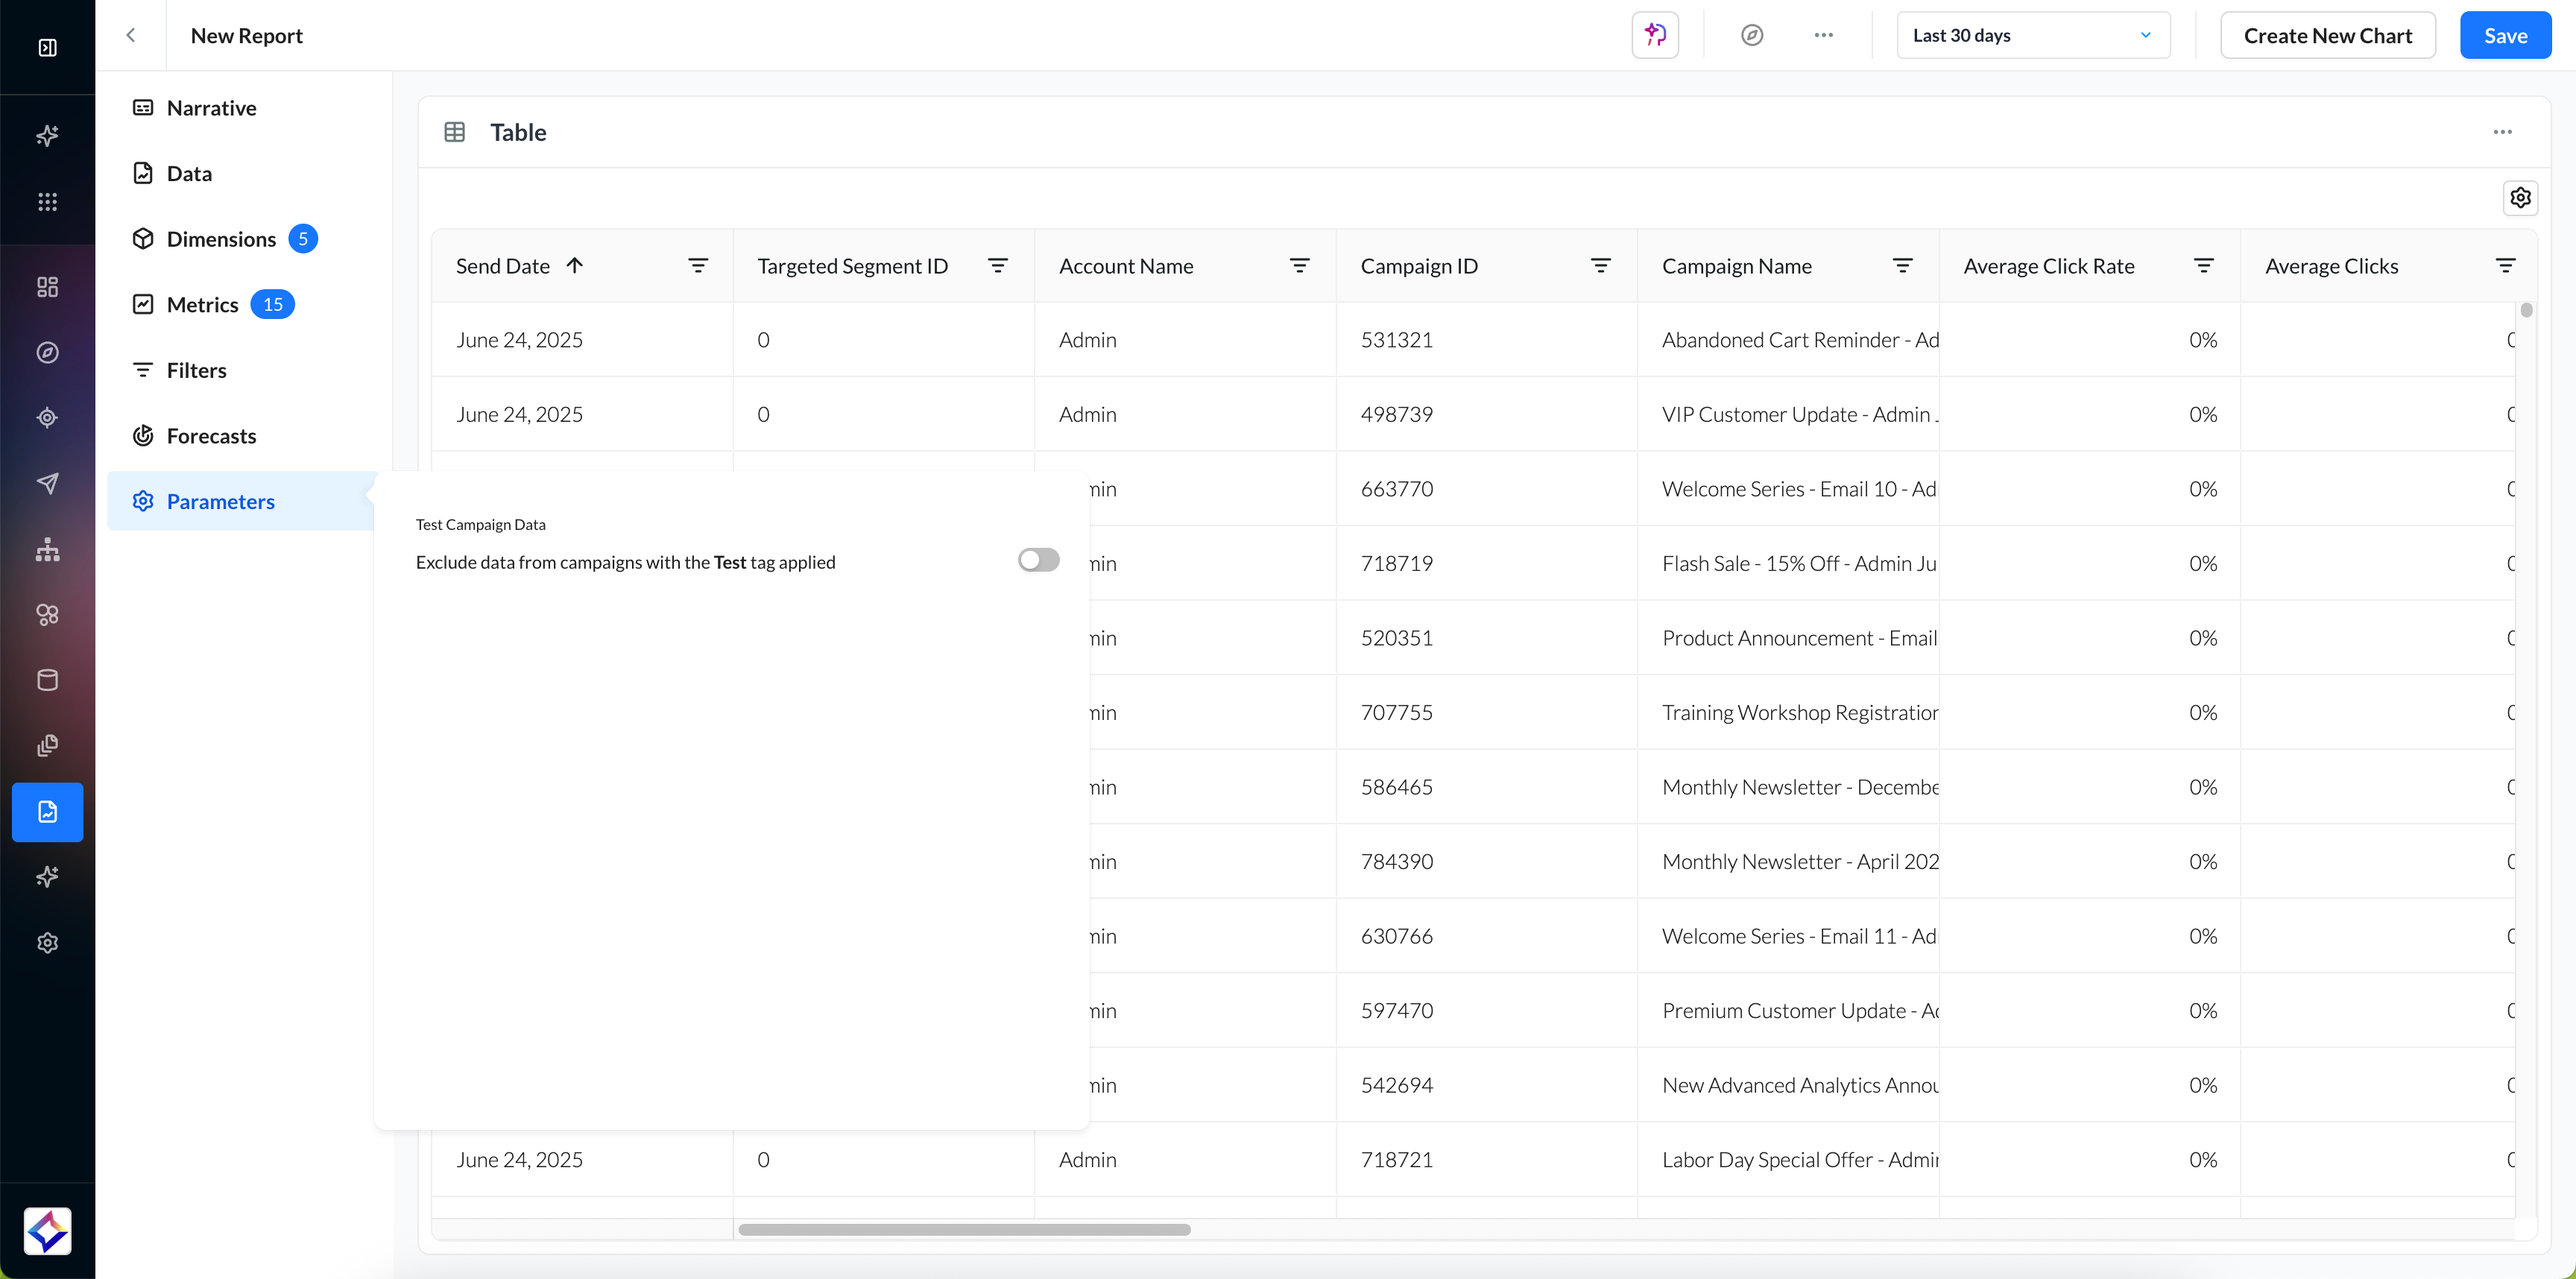
Parameters
Depending on the data type you selected in the Data tab, you may see an additional tab called Parameters. In this tab, you can make additional selections specific to that dataset.
Narrative
Navigate back to the Narrative section to view a clear, auto-generated summary of the report you’ve been building. As you configure parameters such as the dataset, metrics, dimensions, filters, and date range, the narrative updates dynamically to reflect your selections.
-20250723-062726.gif?cb=e9c0faf8711c6e8f45aed851290f696b)
-
The colored pills are interactive. Metrics, dimensions, filters, and forecasts can all be removed by hovering over the pill. When you click on data, dates, and visualizations from the narrative, you will be taken to that specific tab.
Marking Reports as Read-Only
You can also lock a report so that only its report owner (and users with Admin access) can edit it. All other users in the account will still be able to view the report, but they cannot modify or overwrite it. This ensures important reports remain consistent and protected from accidental changes.
-
To mark a report as Read Only, navigate to your report in Insights Studio.
-
In the report header, click the action menu (…).
-
Select Mark as Read Only from the dropdown.
-
A lock indicator will appear, confirming the report is now read-only.
-20250819-085109.gif?cb=b3c0e90f61aafc1169fcdbb2bbd69bd7)
You can remove the Read Only restriction at any time by returning to the same action menu and selecting Clear Read Only.
Once selections are made, a data table preview will appear, displaying the filtered dataset for developing the report.
-20250723-063040.gif)
To explore the available chart types and learn how to configure each one, visit the Charts & Visualizations page for detailed guidance.
Review your report and save the report, giving it a name and optional question, and a description. Also, you could choose to save this report as a template for future use.
-20250723-064211.gif)
You can also export or schedule ongoing report delivery by clicking on the action menu icon (…) on the header and clicking on Export/Automate.
-20250723-064652.gif)
-
Select the way in which you want to receive your report: Amazon S3, Microsoft Azure Blob Storage, Email, Google Buckets, or SFTP, and click on Next.
-
Select the cadence at which you want to receive your report: Daily, Weekly, Monthly, Quarterly, Yearly.
Learn more about the Export Destinations.
You can modify charts or data selections anytime for up-to-date insights.