Content Report

The Content report can be used to see what links users are clicking on within an individual campaign or across campaigns.
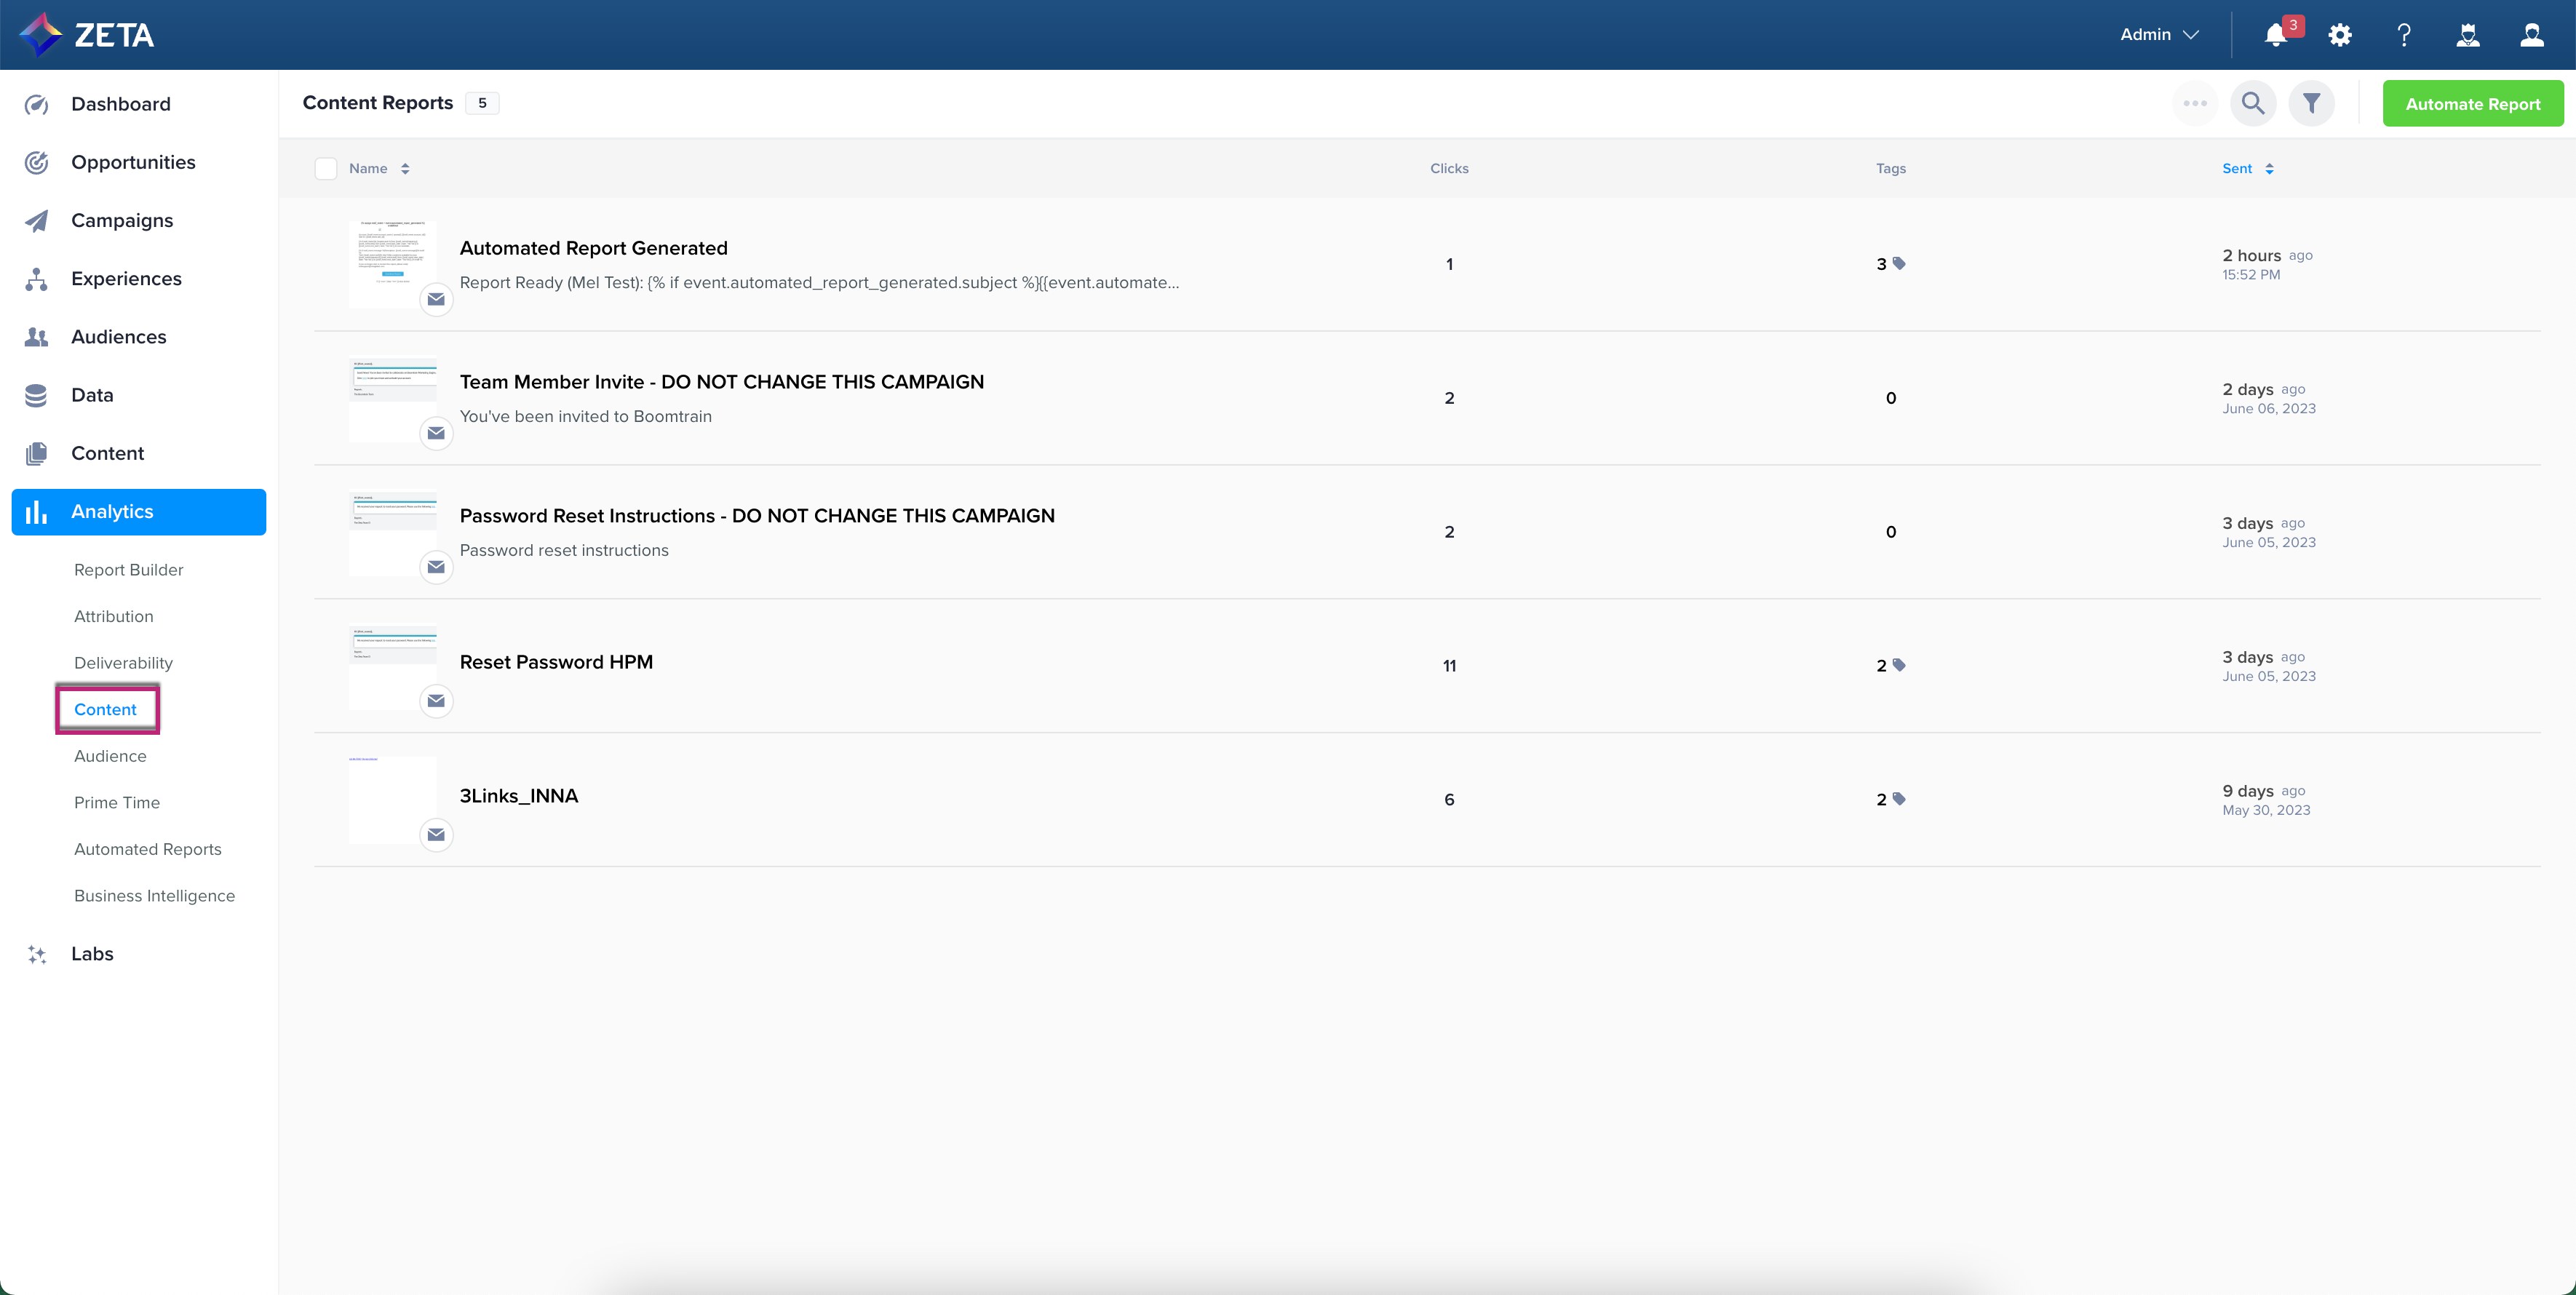
In the menu on the left, navigate to Analytics > Content. Click open a content report.
Searching/Filtering
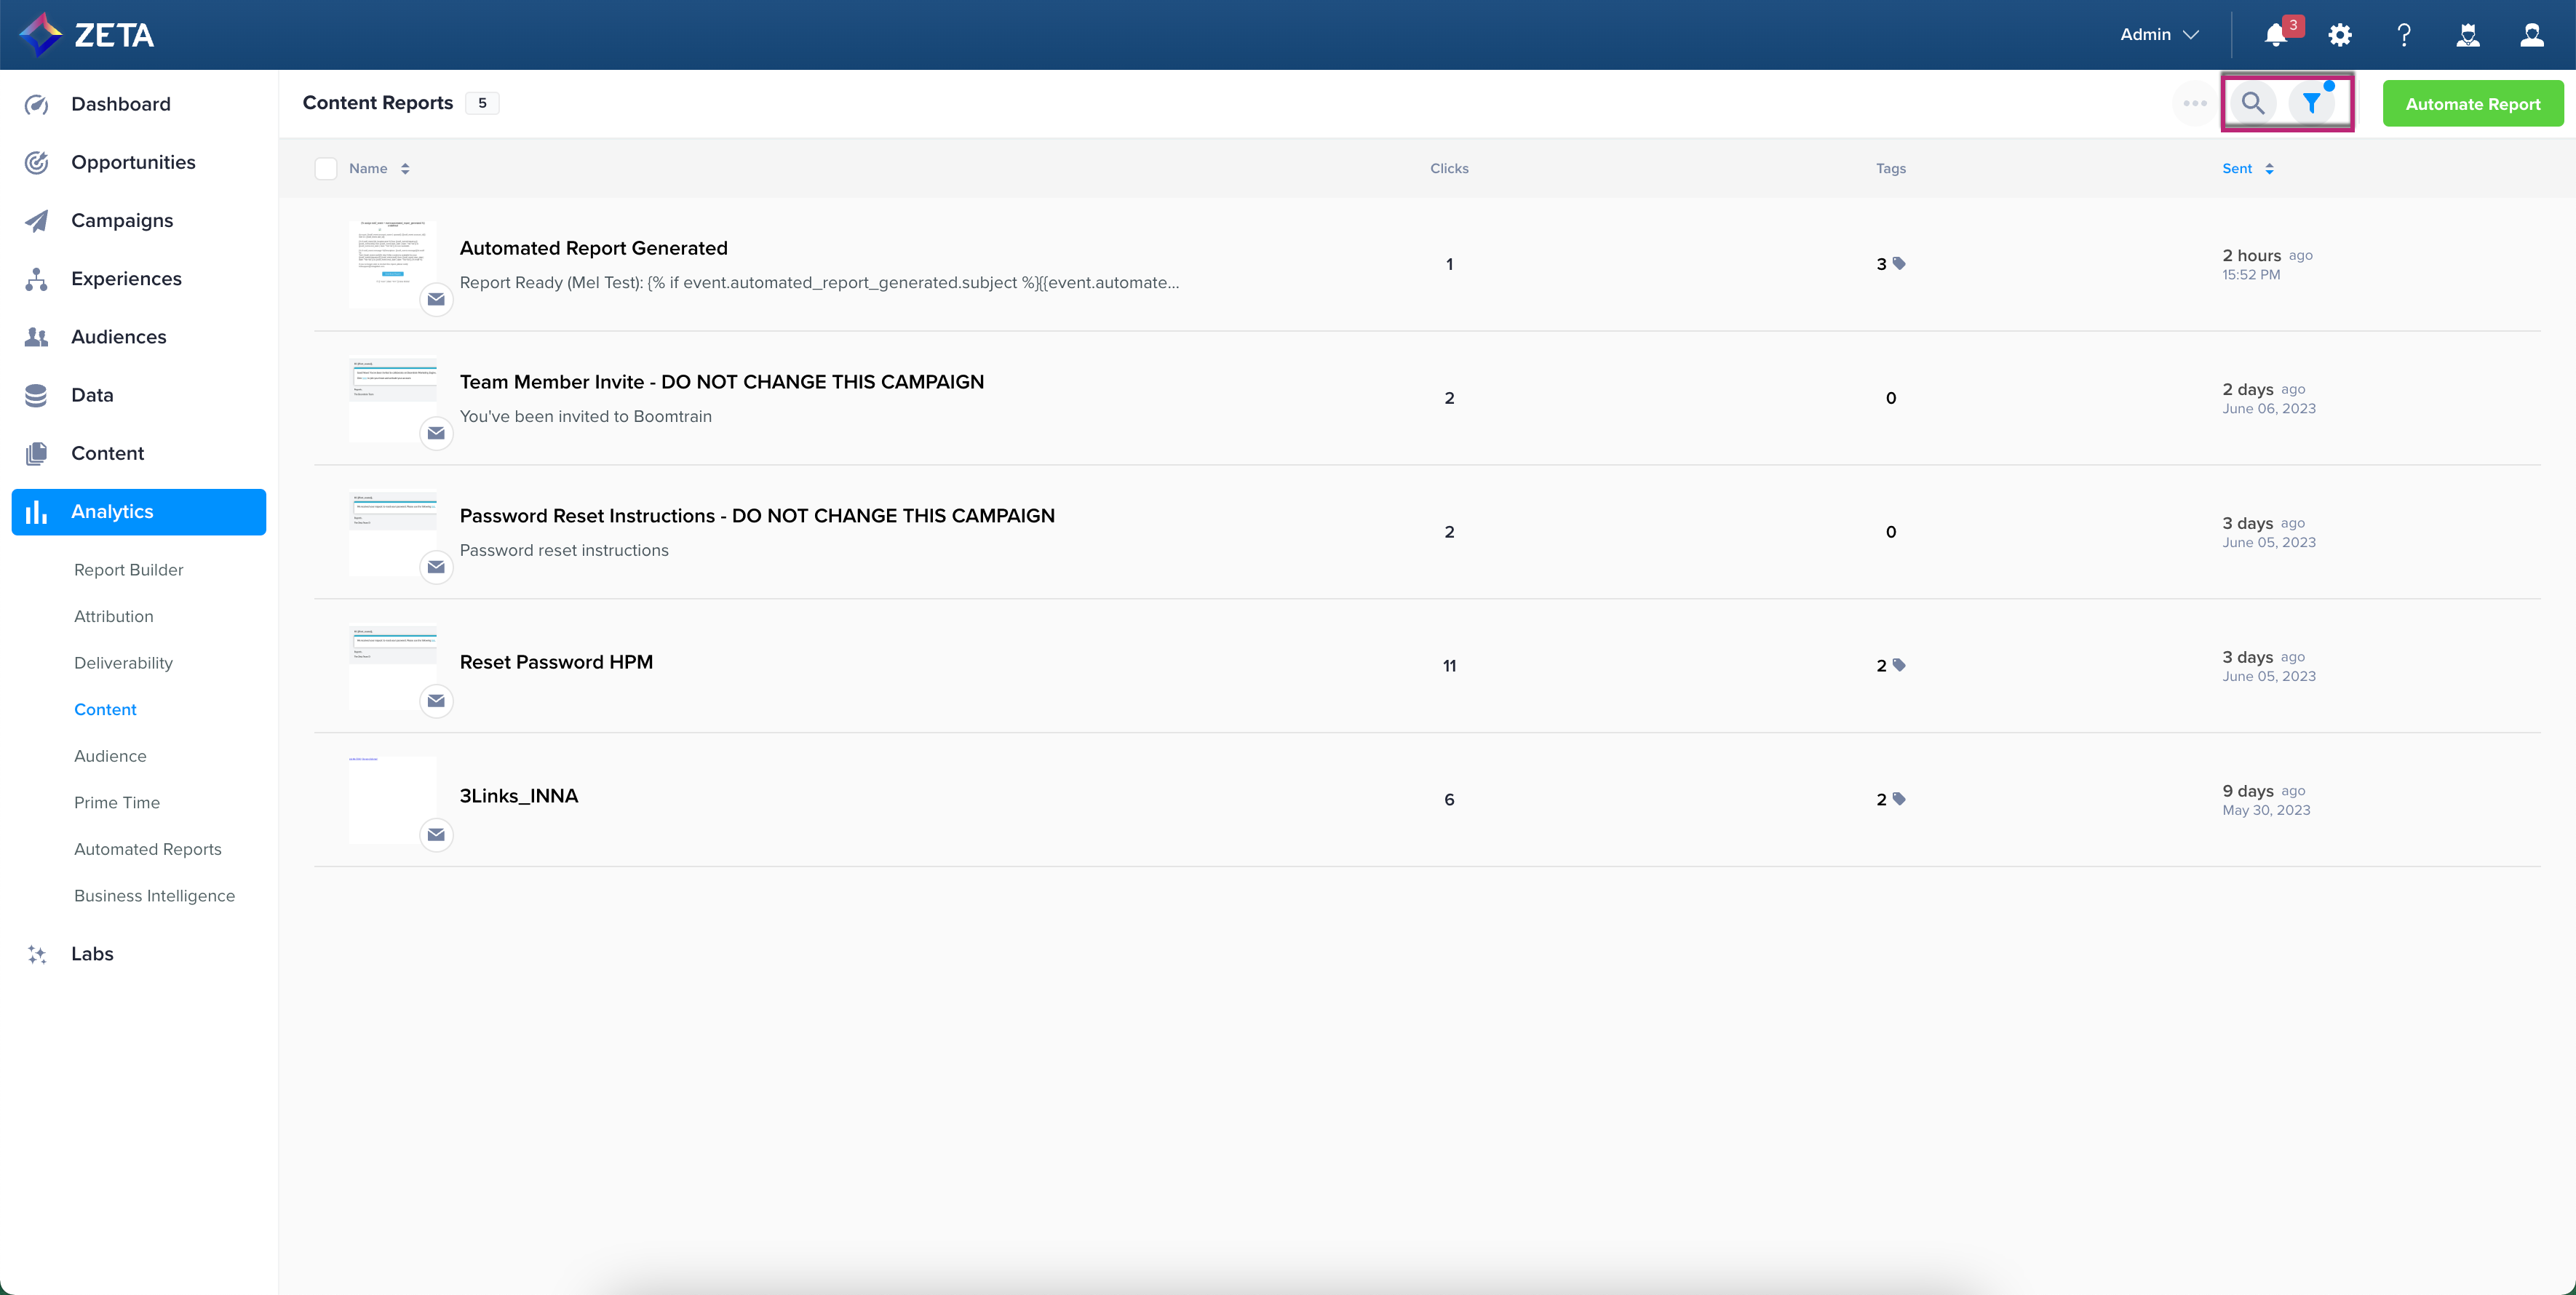
Users can search and filter by clicking on the icons at the top right of the UI.
By default, the previous 30 days of campaigns are selected.
Click tracking in the ZMP is performed at an aggregate level by the campaign. This means that any single campaign that has the same URL used in more than one location will only have one line item worth of clicks displayed in the report.
The unique clicks displayed in the Link Map refer to unique clicks per link as opposed to unique clicks per message in most other reports.
For example,
Let’s say John clicks on the same email 3 times: twice on Link A and Once on Link B. These clicks would result in 3 total clicks, 1 overall unique click for the message, 1 unique click for Link A, and 1 unique click for Link B.
In Report Builder, this would tally 1 unique click for the campaign, but on the Link Map, you would get 1 unique click for A and 1 unique click for B, which would amount to 2 unique clicks per link.
Campaign Filters | Description |
|---|---|
Type | Filter based on native campaign channels. |
Date | Filter based on the Campaign Send Date. |
Campaigns | Select specific campaigns as needed. |
Tags | Filter by Campaign Tags that are set at the creation of the campaigns. |
Visual Link Maps (Heat Maps)
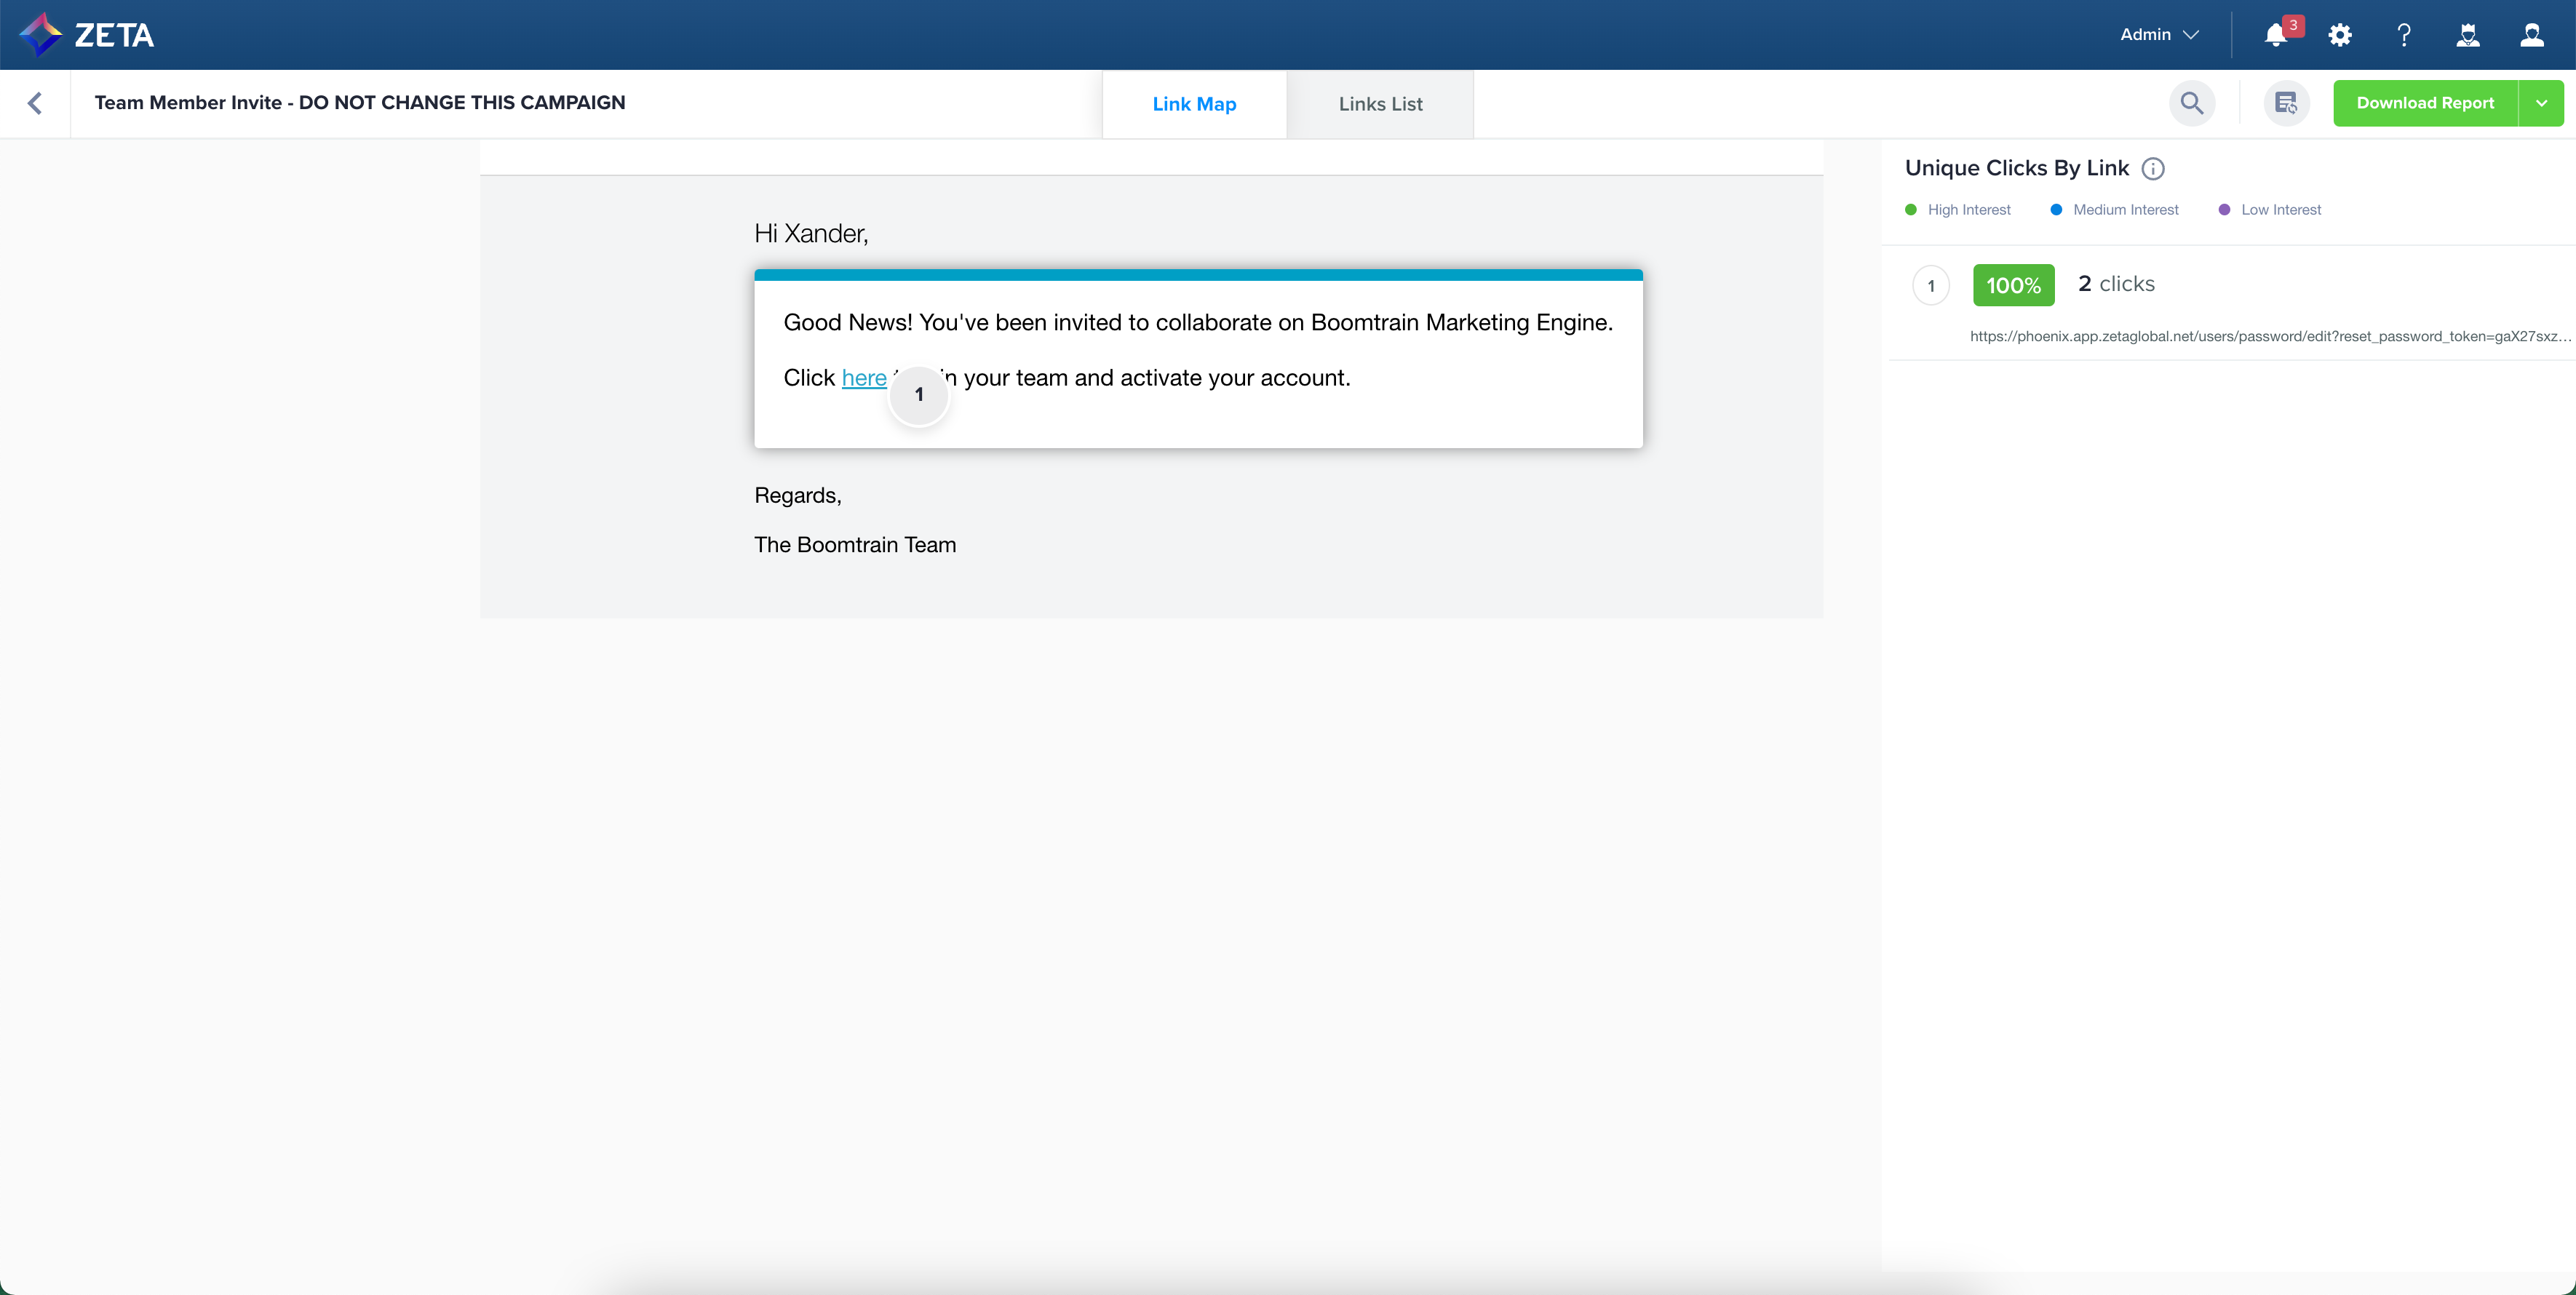
To view the Visual Link Map, either click on the Campaign and navigate to the Link Map tab, or use the in-row menu to navigate directly to the Link Map.
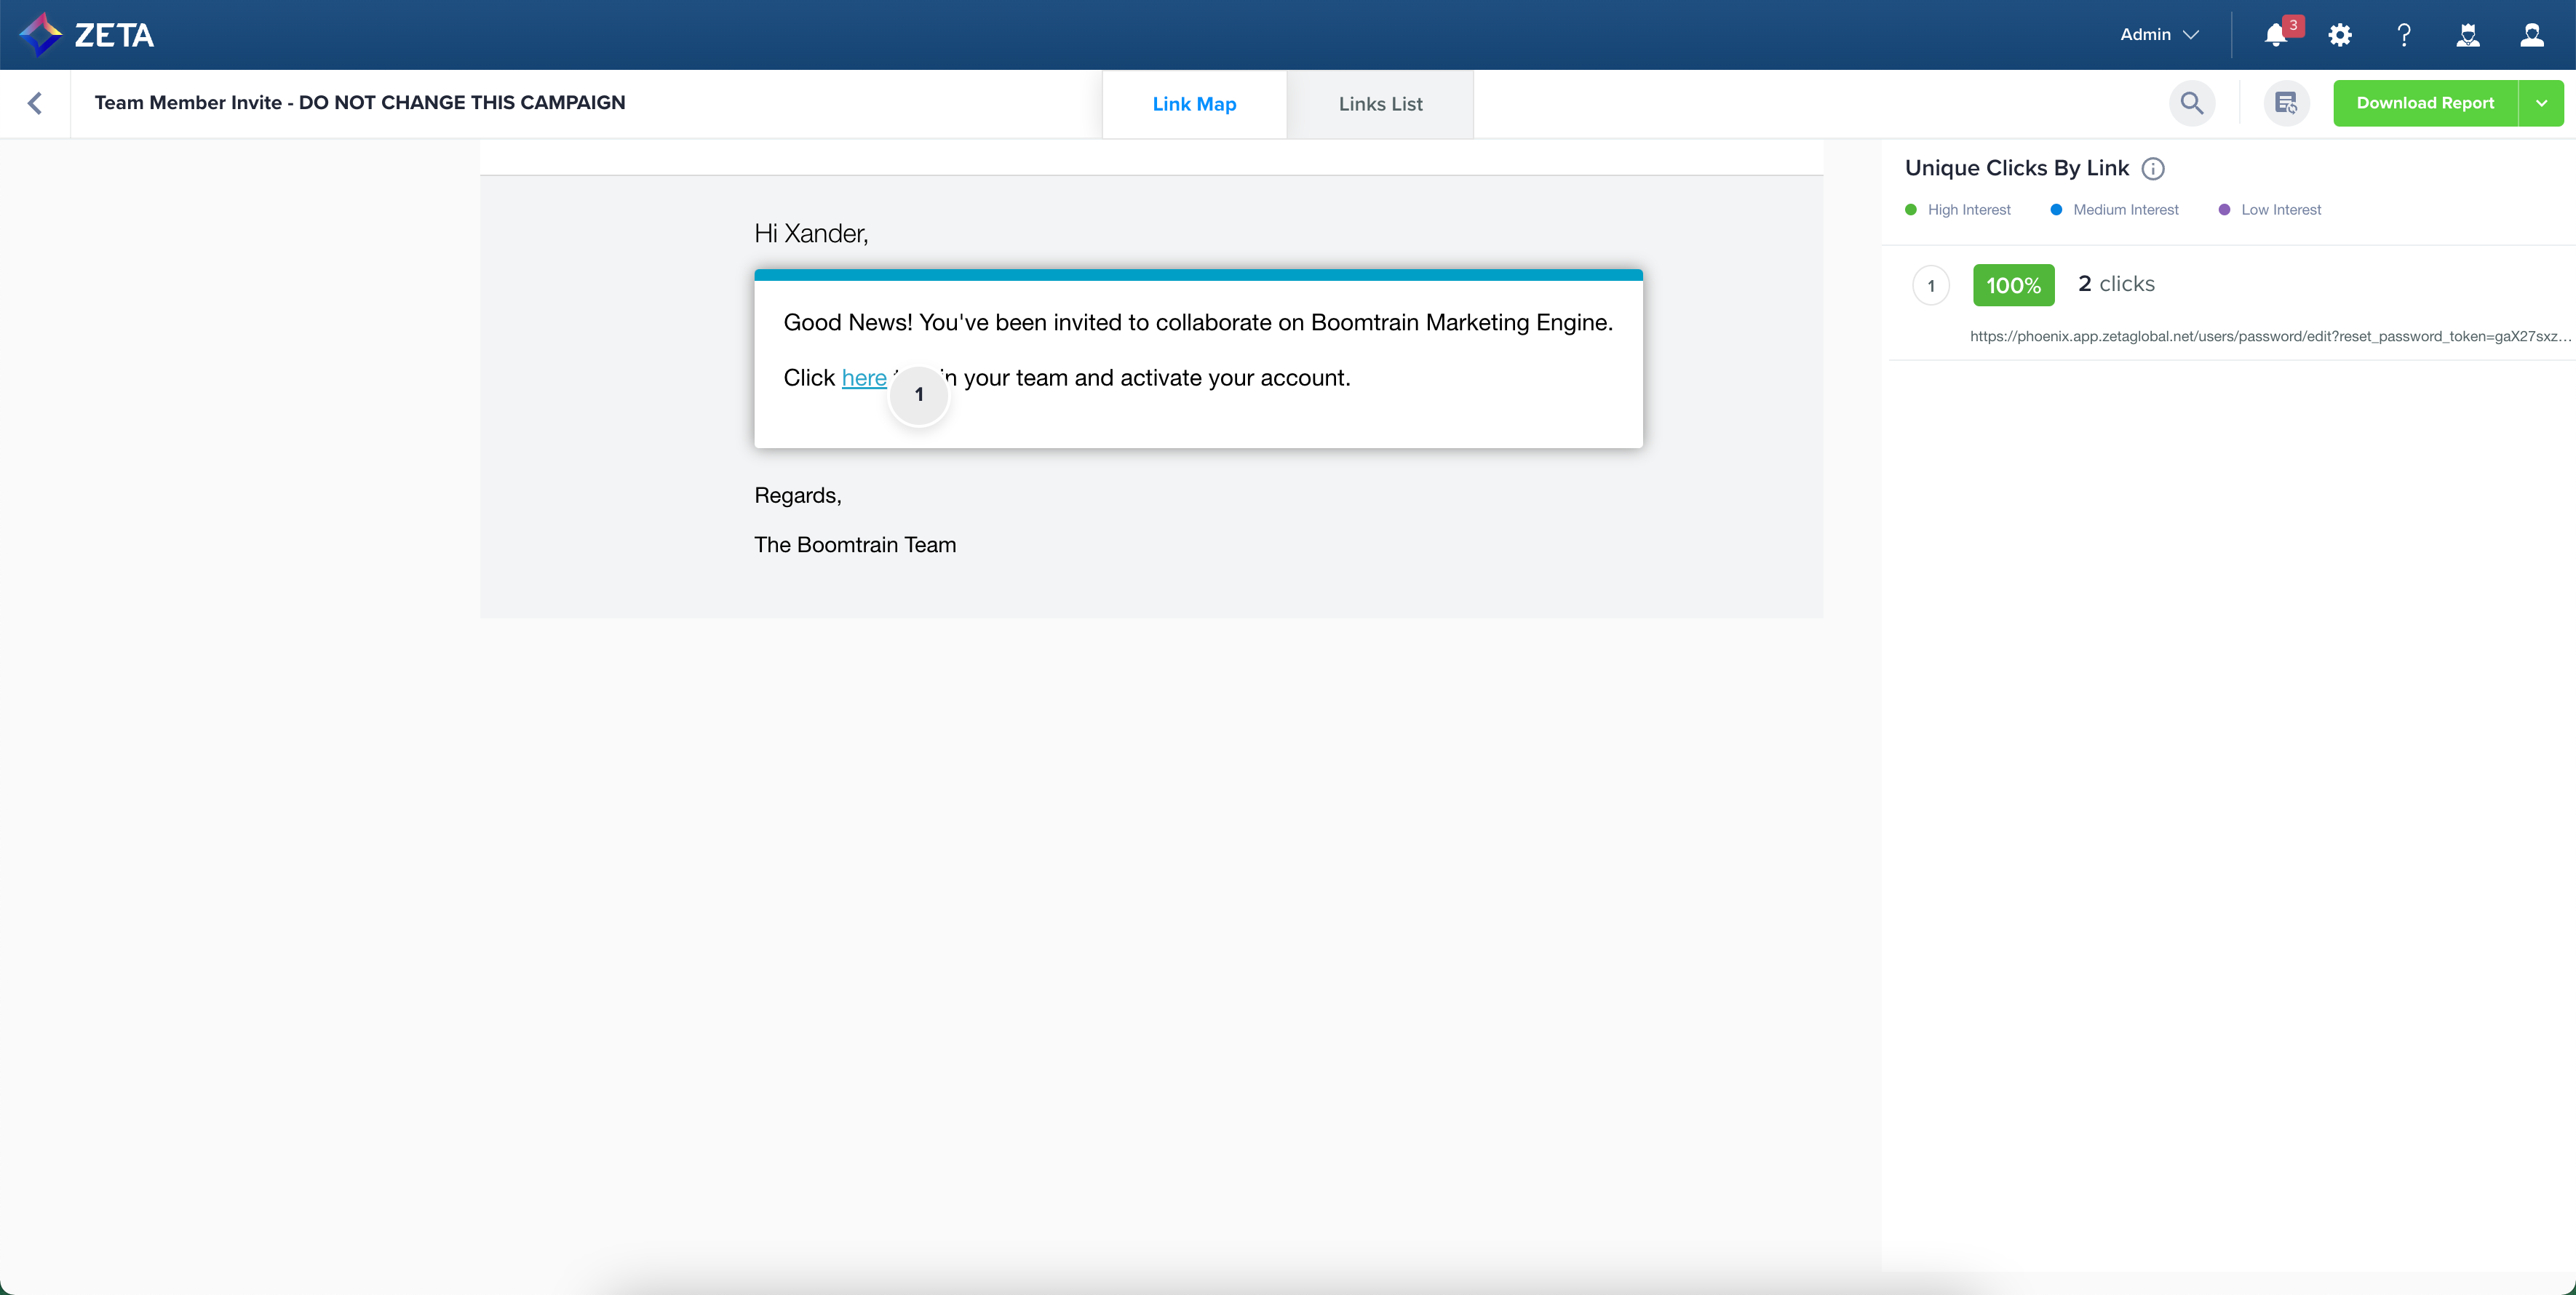
Links are color-coded into High/Medium/Low buckets representing the top 3rd, middle 3rd, and bottom 3rd most popular links in the email. Dynamic Links that can be represented with the same content are aggregated in this report to indicate where the user has clicked.
Click Rate Key Definitions
High (Green) = 10%+
Medium (Blue) = 1-9.99%
Low (Purple) = 0-0.99%
Exporting Link Maps
At the top-right corner of the Link Map, click on the dropdown arrow beside the Download Report button to reveal the format options to choose from.
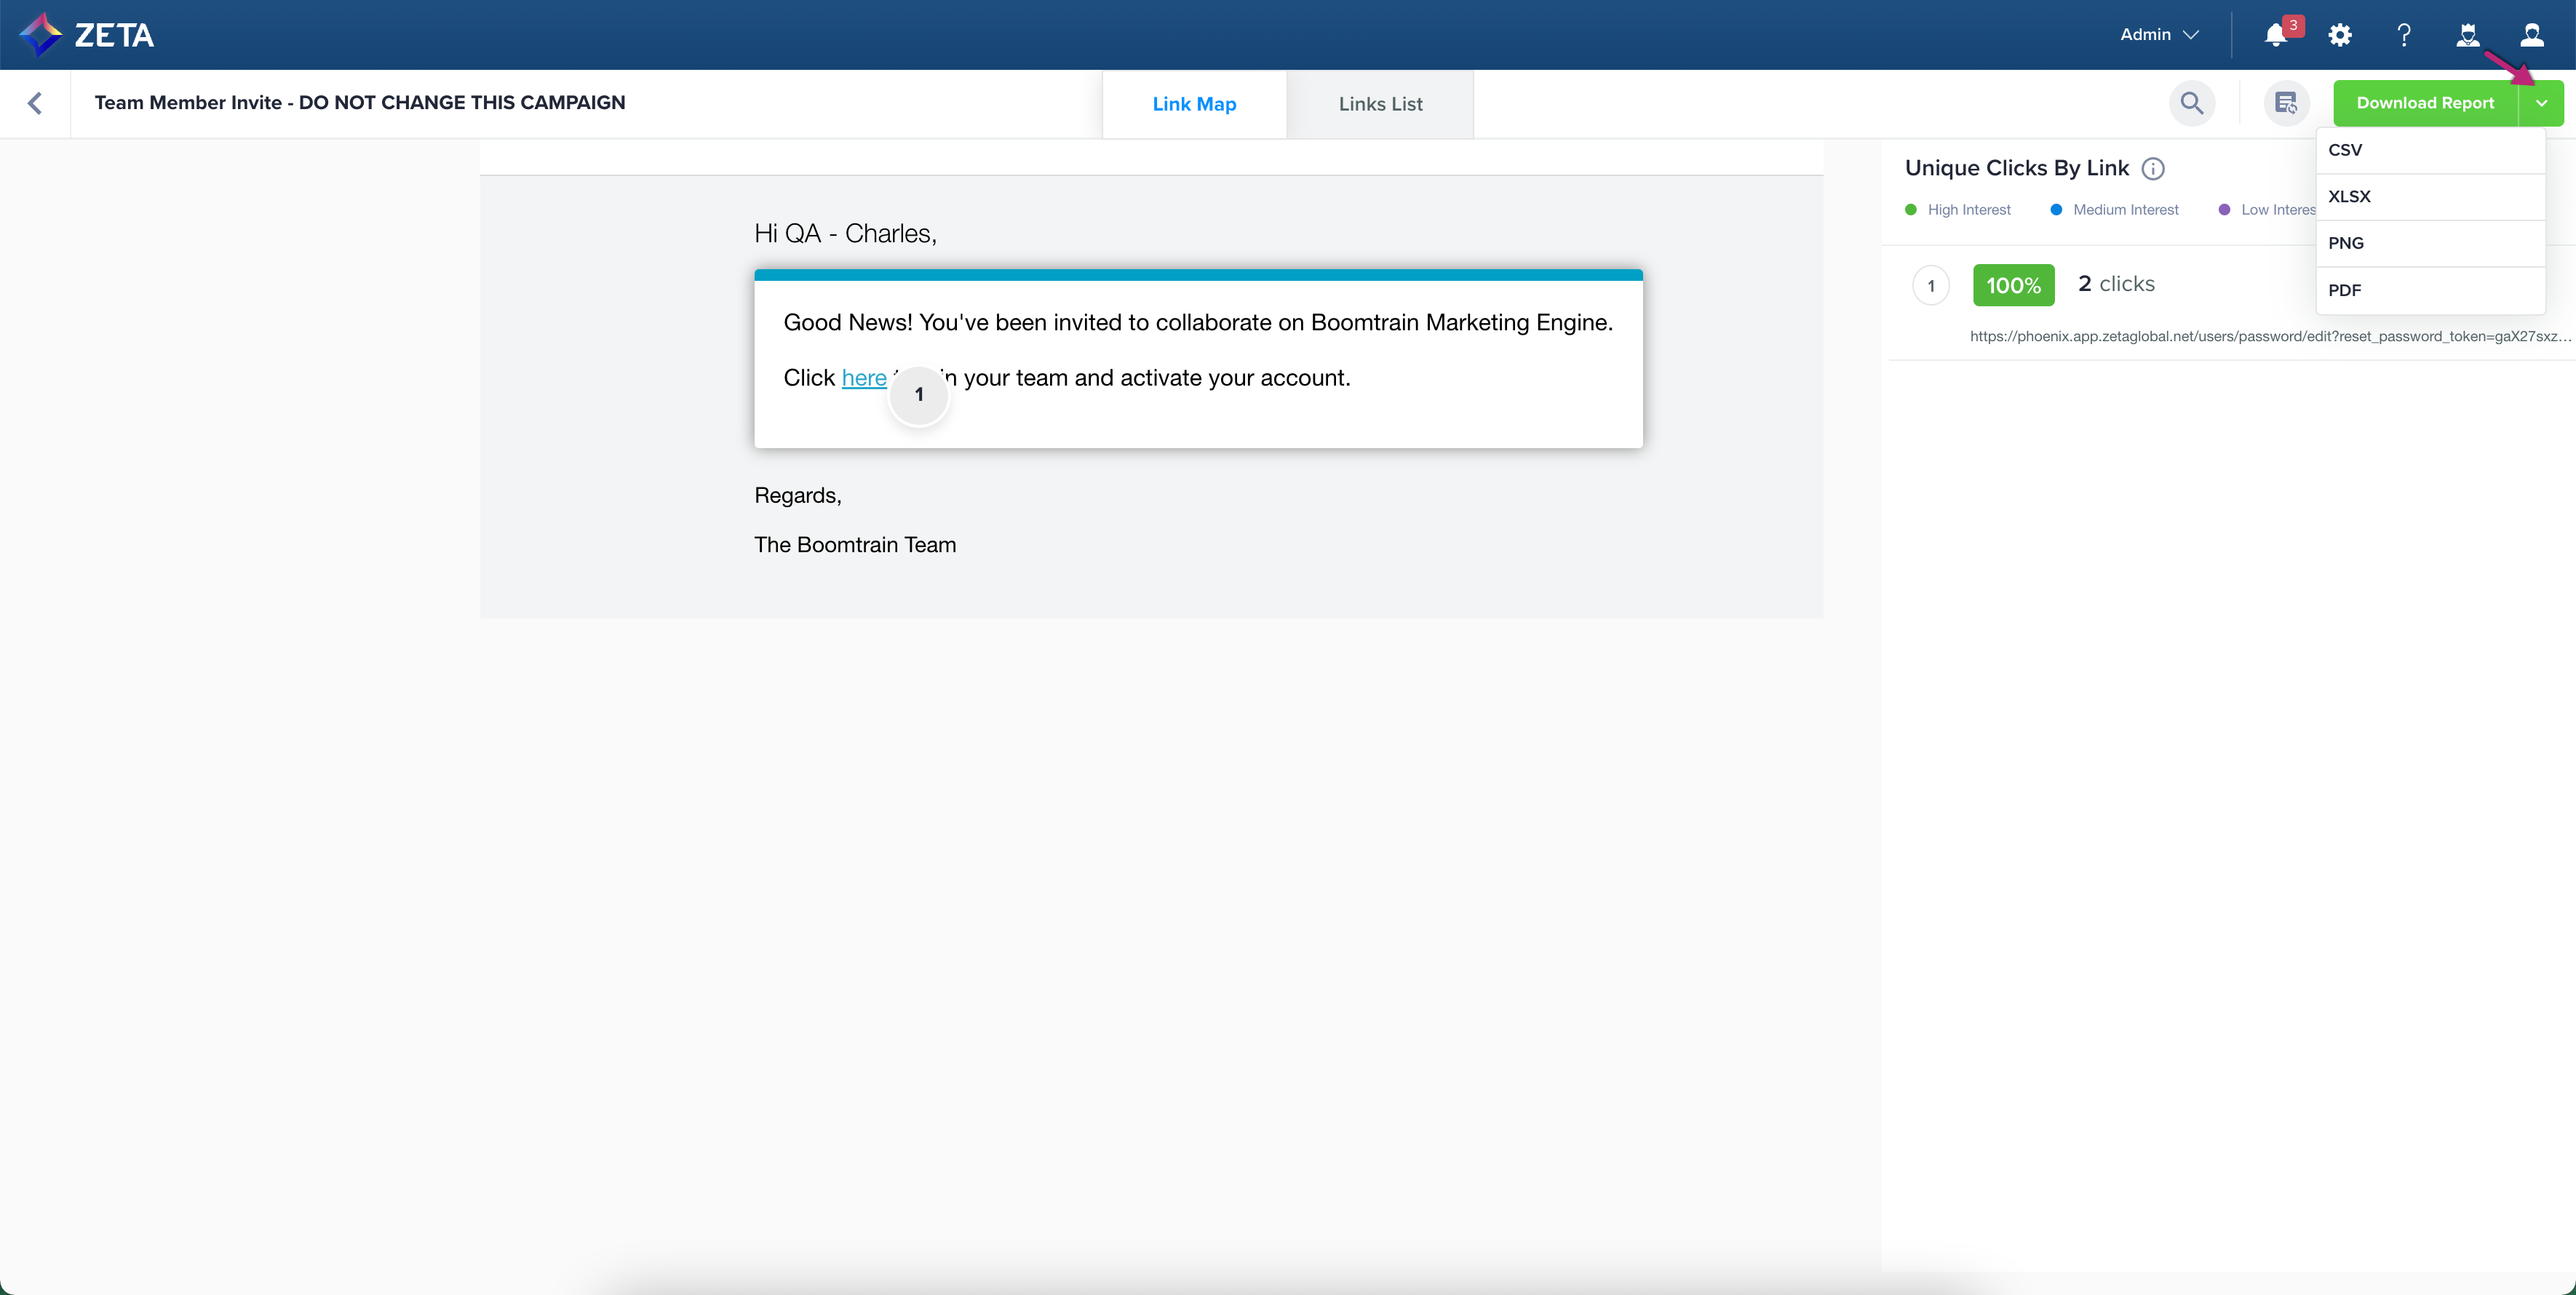
PDF exports include graphic Link Map only.
PNG exports include graphic Link Map only.
XLS exports include graphic Link Map as well as table data.
ZMP does not keep the link map data for the campaign that has been sent older than 6 months.
Links List (Table)
The Links List table represents all the links that were clicked on in an email. This tabular report does not aggregate by dynamic link allowing for more detailed external analysis.
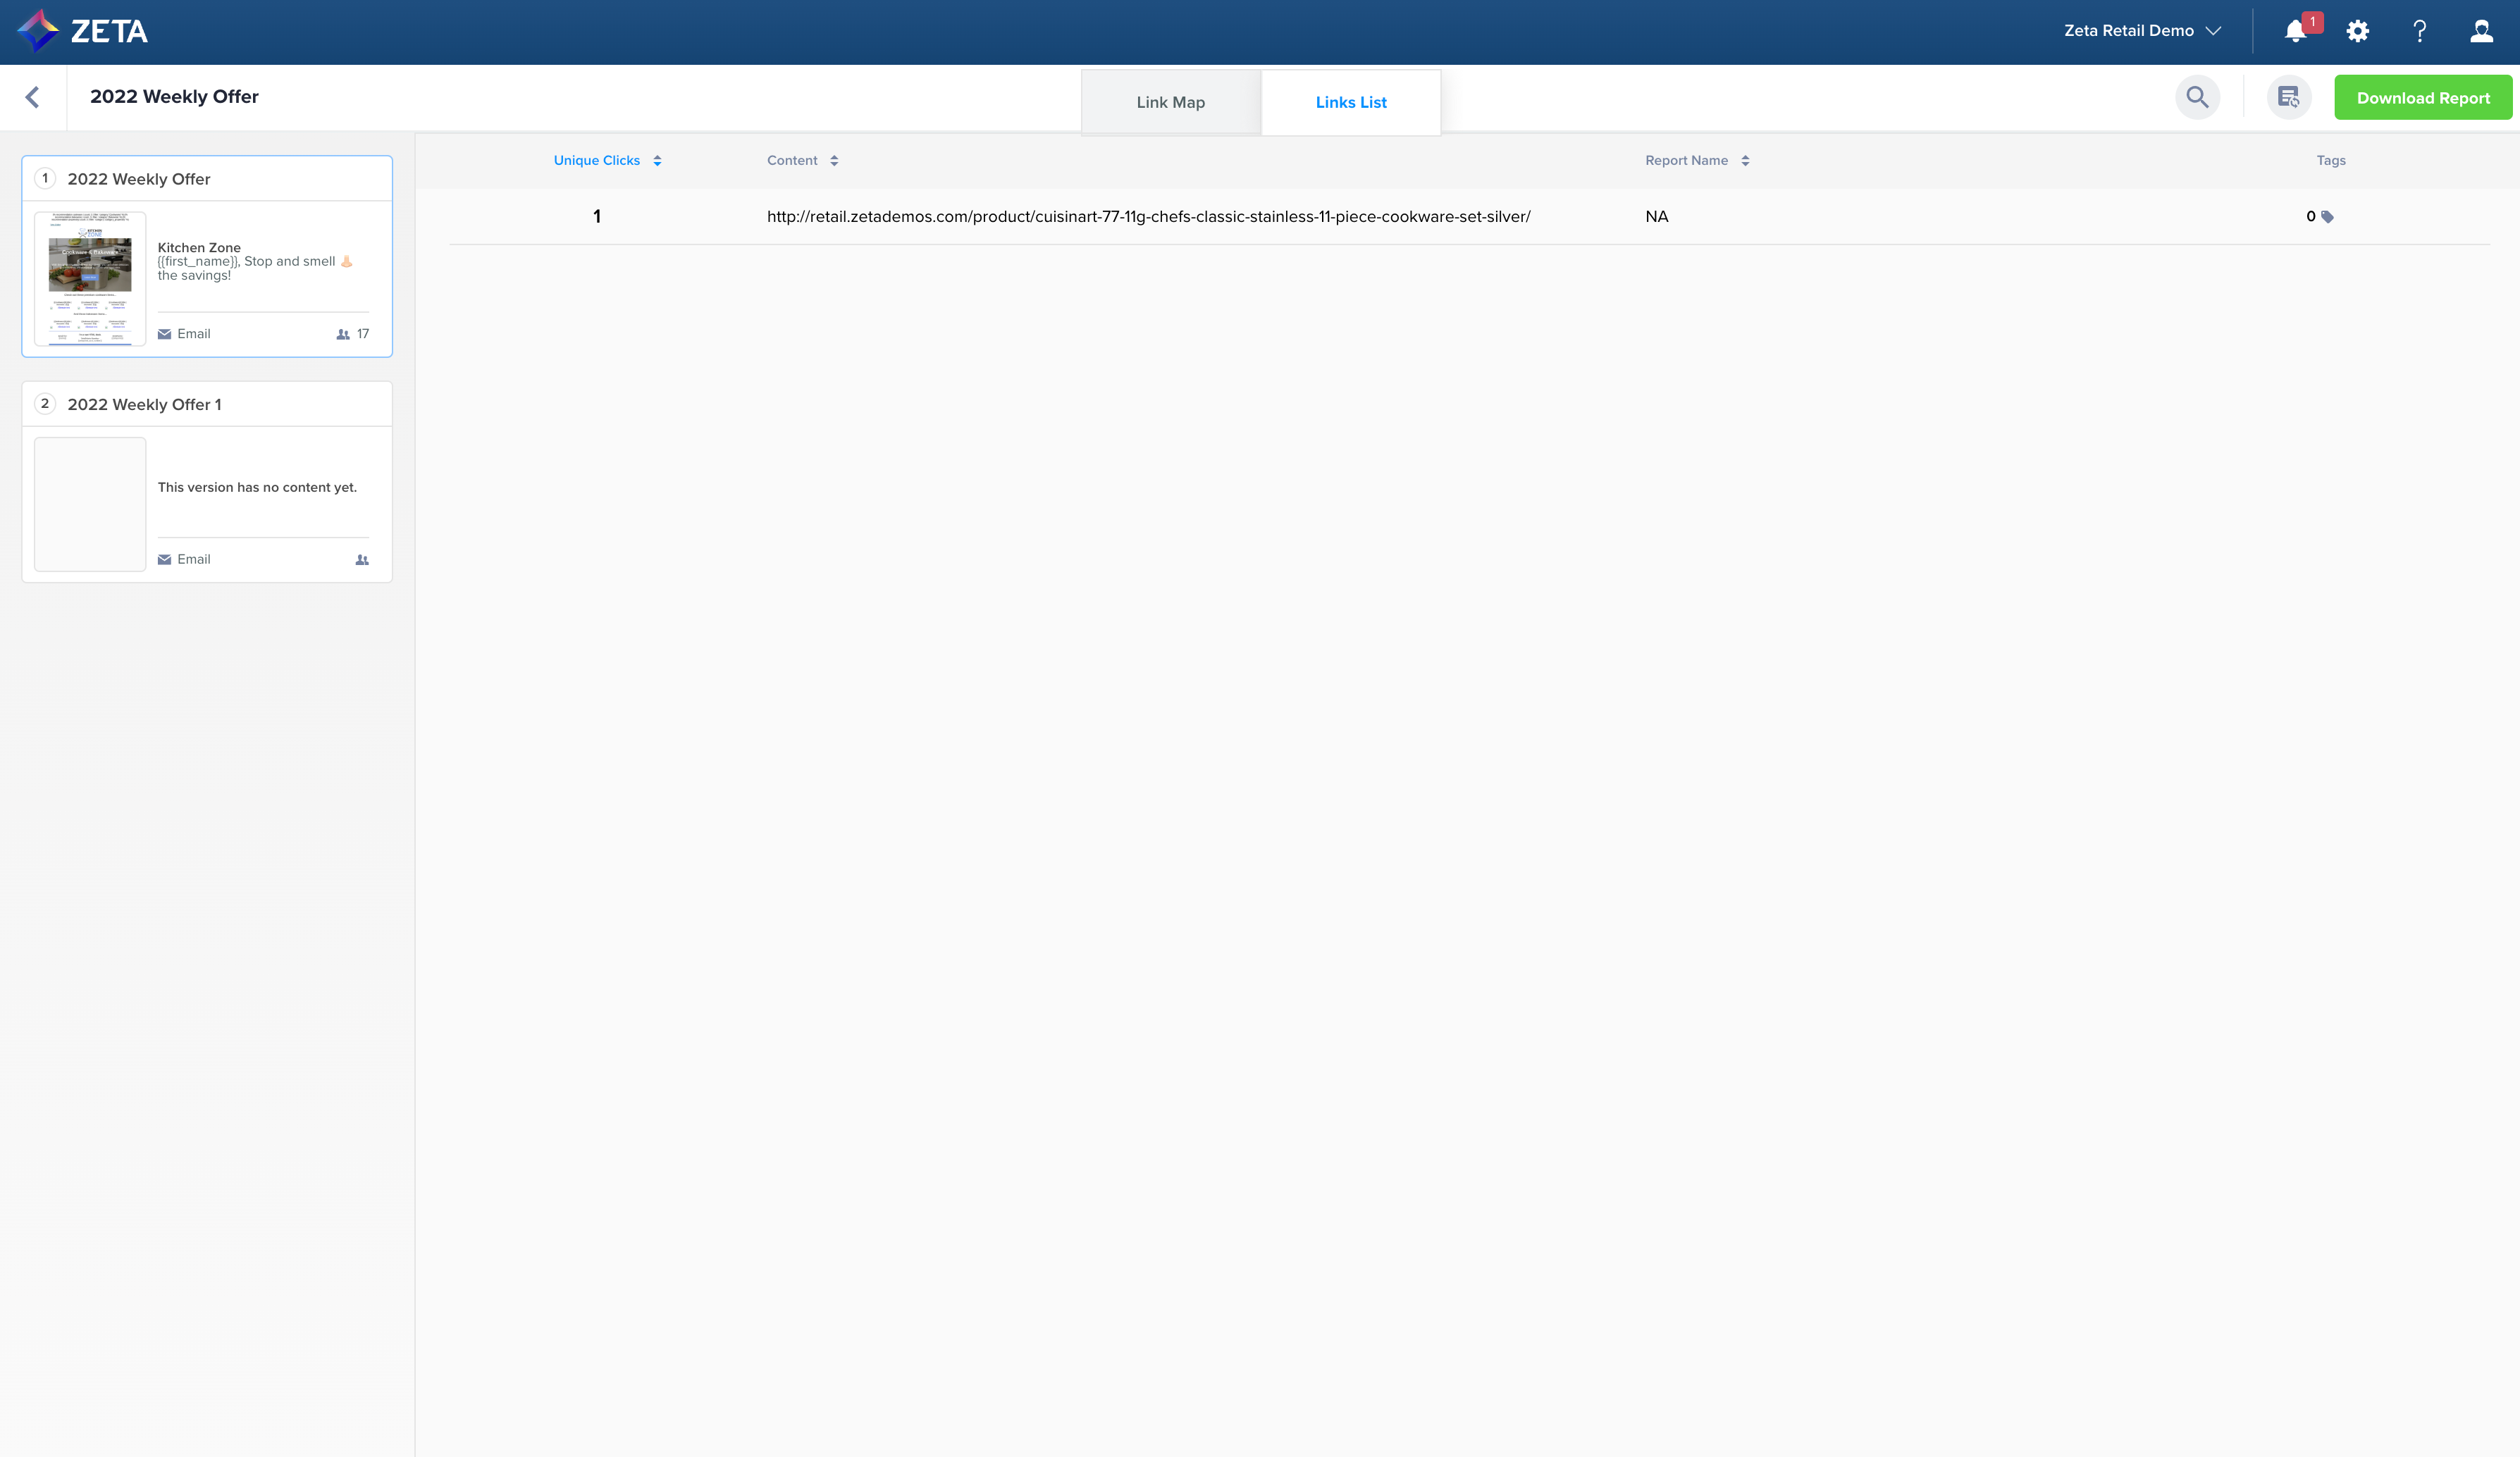
Linked elements in content can be given human-readable reporting names and tags. Use the attributes data-reportingname="Call to Action" and data-reportingtags="cta,primary" for the given HTML element to accomplish this, setting the appropriate values accordingly. These attributes can only be set in the HTML editor and are currently not available in the visual editor.
Aggregate Links List (Table)
The Aggregate Links List can be accessed from the list of Campaigns in the Content Report. Select multiple Campaigns that you'd like to aggregate and click on View Aggregated Links.
Automated Reporting
The tabular report can be automated by clicking on the Automate Report button at the top right.
-20230608-094349.gif?inst-v=e0b02120-c4bf-4009-b8b5-1c73473a87a2)
Filter | Description |
|---|---|
Report Name + Description | Name the report and add a description to easily find and make edits to the automation later. |
Select the Campaigns | If different from the previously selected set. |
Metric | Select between the following to determine what to include in the report:
|
# of Results | Limit the number of links exported to avoid files that are too large. |
Recipient | Add who should receive the report. |
Start At | Determine when the automated report should start sending. |
Repeat | Set a cadence for the automated Report. |
Link tags or reporting names for links that are included in Snippets will NOT be pulled into Content reports.
