
Report Builder

Enabling decision-making and allowing users the opportunity to investigate and solve all kinds of identified issues, reporting has stood out as a turnkey solution since time immemorial. The process of reporting begins by compiling and reviewing the information within a specific functional area where performance is monitored and measured. Once the gathered information has been reviewed, conclusions are drawn and recommendations are made. The reports might end up explaining why an issue has occurred and eventually will recommend a course of action to fight the same.
On this front, the Zeta Marketing Platform has its very own Report Builder, which is a flexible, ad hoc reporting tool that allows users to build their own Customer Marketing, Prospect Marketing, Programmatic, Customer Data Management, Website - Overlay, and Website- In Page reports in the Zeta Marketing Platform.
Choose from hundreds of metrics and dimensions, dynamic and fixed date ranges, exhaustive filters, and data visualizations to surface only the most important data.
Getting Started: Building Your Report
To get to the Report Builder, follow these steps within the ZMP:
1. From the menu on the left, navigate to Analytics > Report Builder.
2. This will open the reports list. All your saved or automated reports will be displayed here. To build a new report, click on the Build a New Report button on the top-right.
.gif?inst-v=cb96b6a4-c026-485a-8bb8-735c732cd9cf)
Now that you’re in the Report Builder, you can begin building a report.
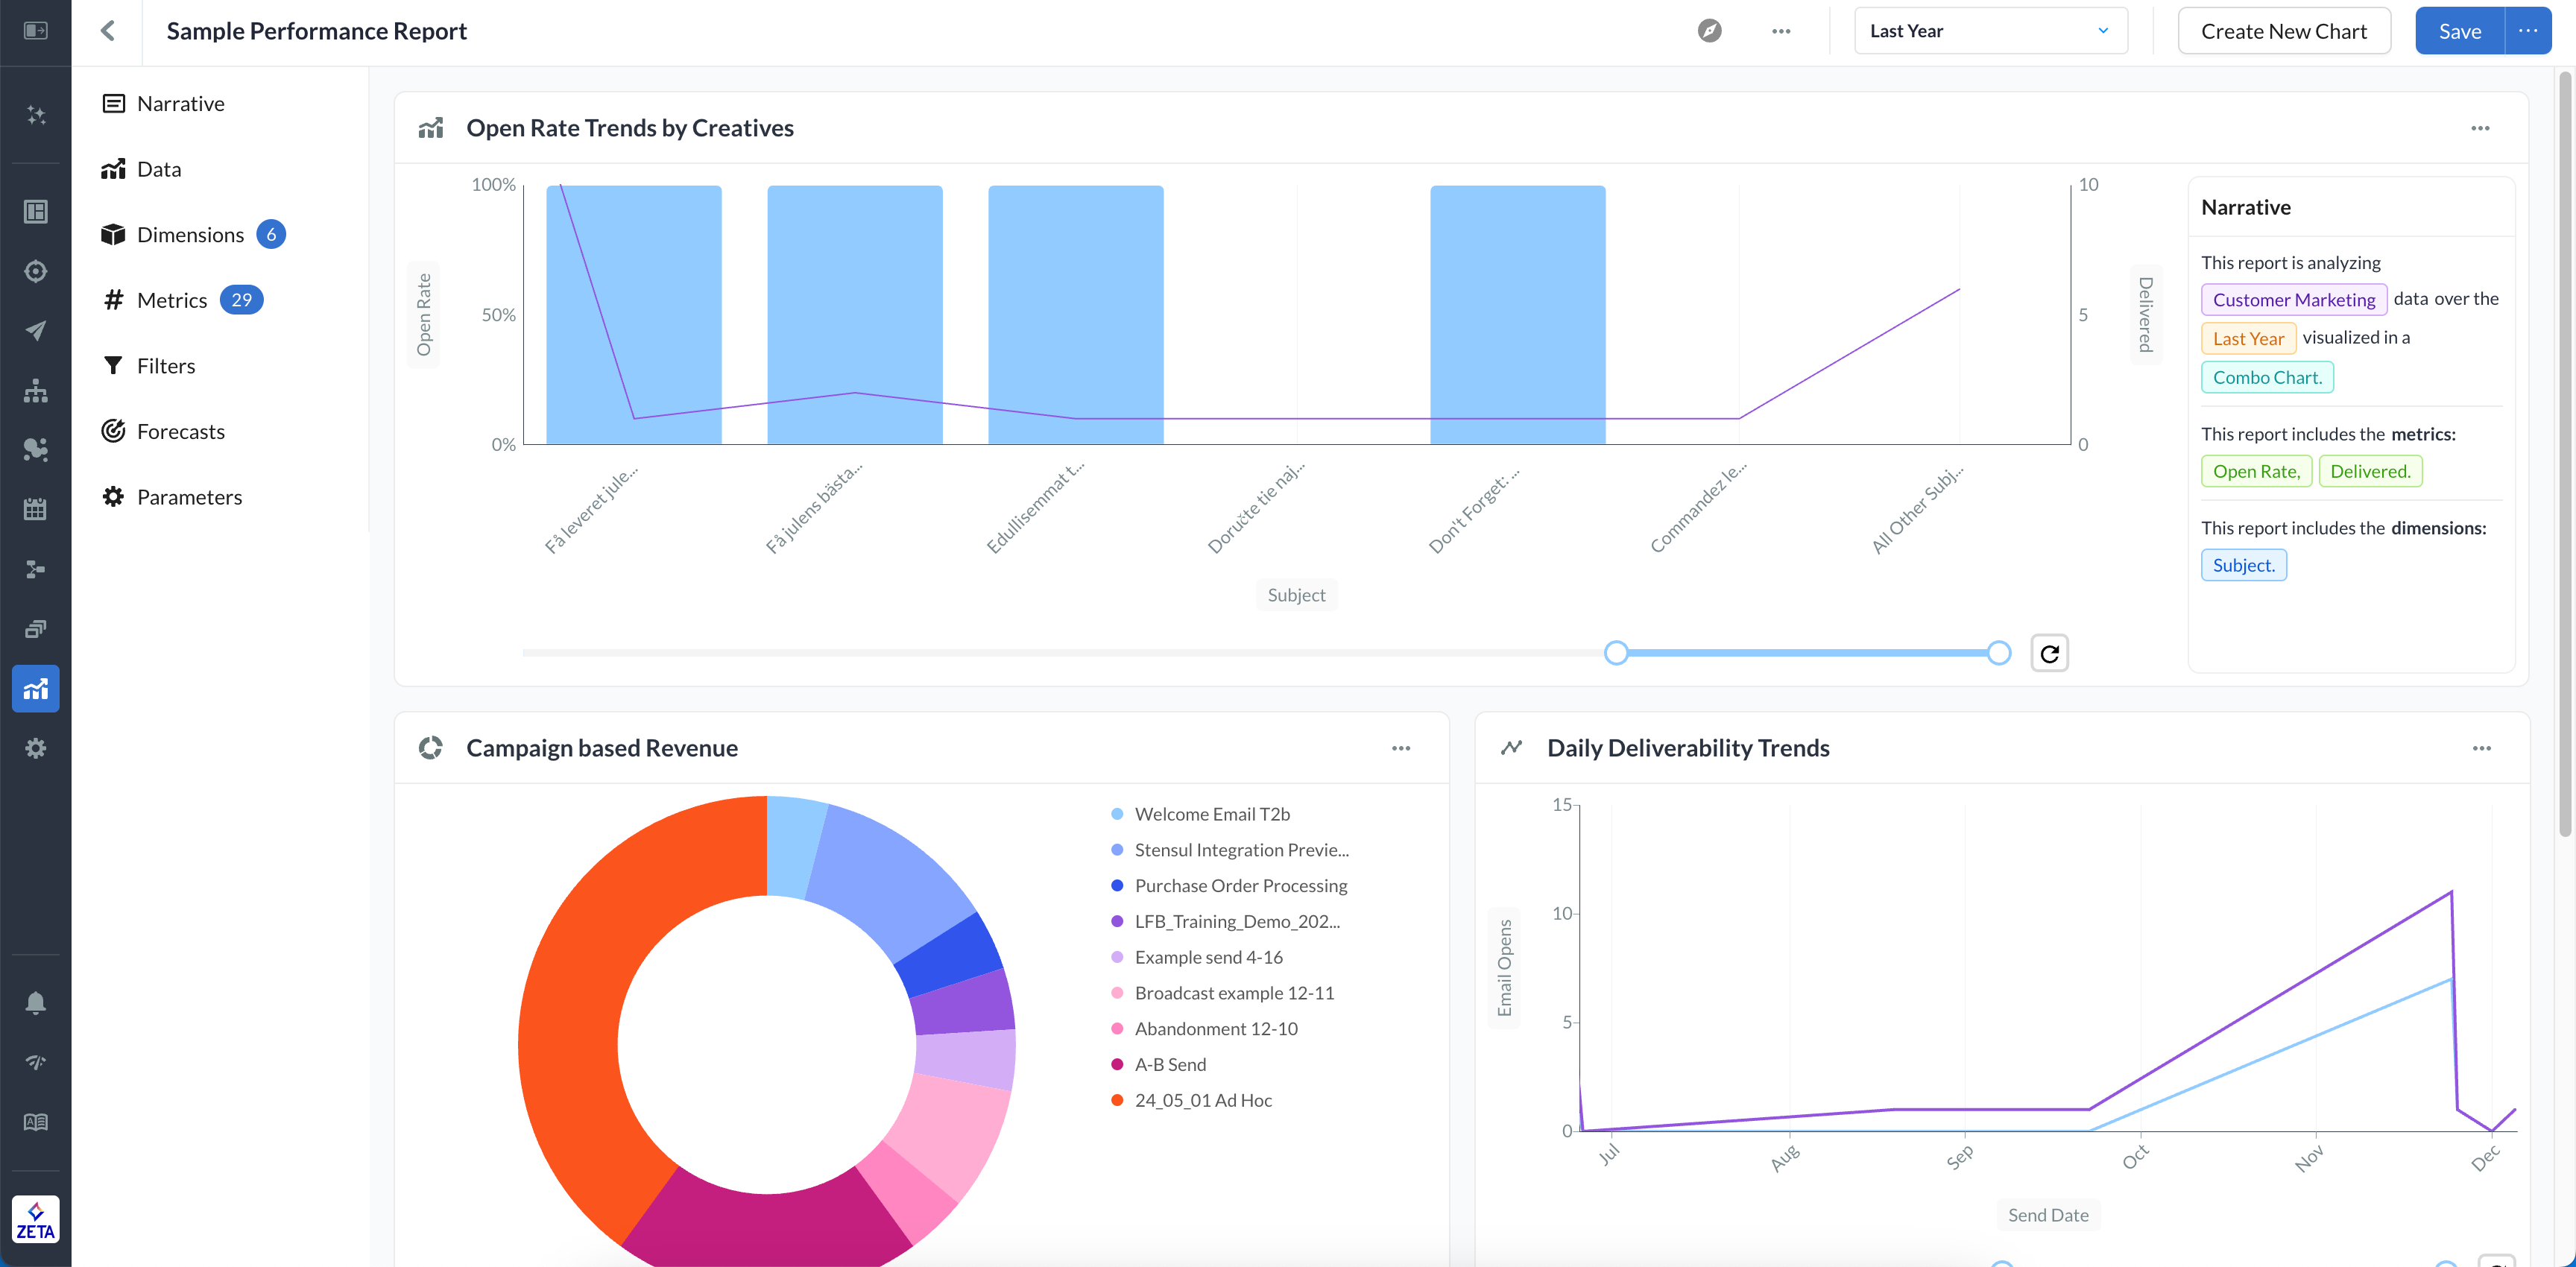
Narrative
This section shows a clear narrative for the report you’re building. As you select the report parameters like dataset, metrics, dimensions, filters, date range, etc. in your report, the Narrative will automatically update.
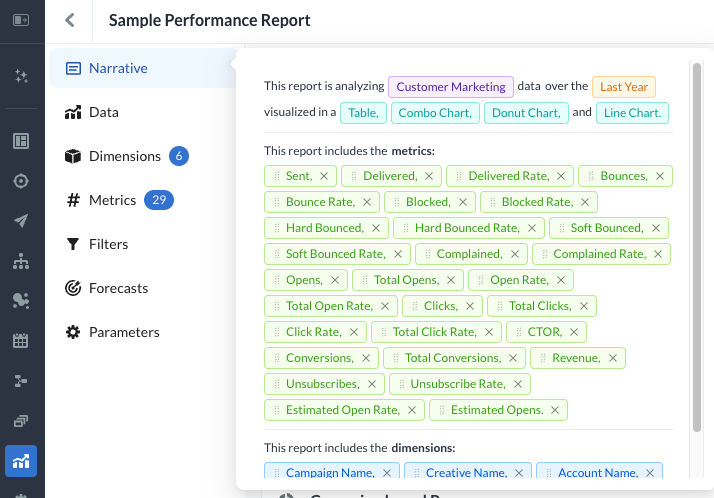
The colored pills are interactive. Metrics, dimensions, filters, and forecasts can all be removed by hovering over the pill. When you click on data, dates, and visualizations from the narrative, you will be taken to that specific tab.
Data
Below the Narrative, you can see the Data, where you will select the data you want to build your report on and its key components. Within the Data Panel, you can choose a dataset for your report:
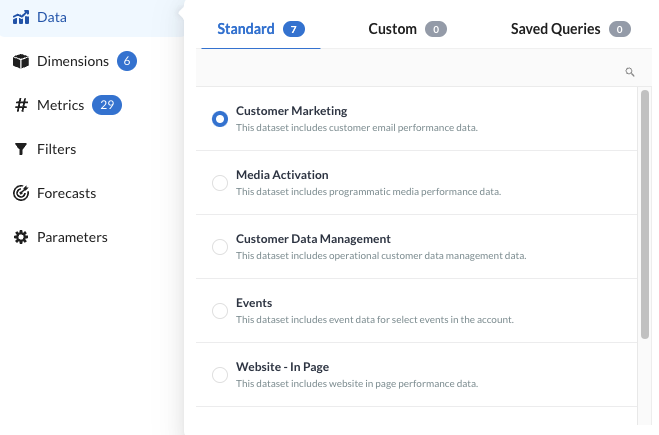
Standard Datasets
These are Zeta-offered off-the-shelf datasets based on data captured from Campaigns.
Custom Datasets
If any custom dataset is added for the account, it will show up under this tab.
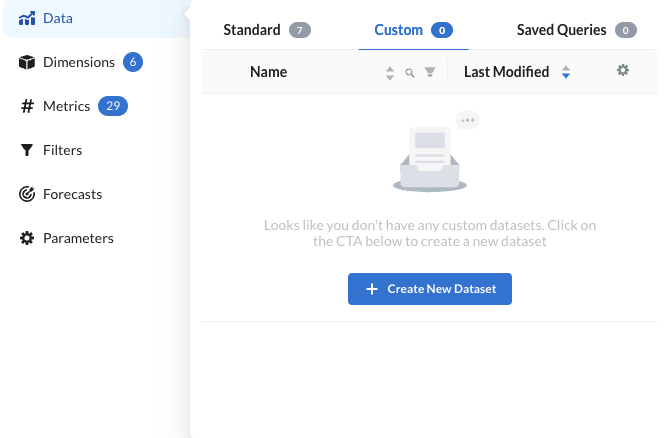
Admins: Advanced users will have the option to edit and add aggregate metrics to the custom dataset. The updated dataset will also be available to other users in the account.
Speak with your Account team if your team would like to get access to the Edit capability.
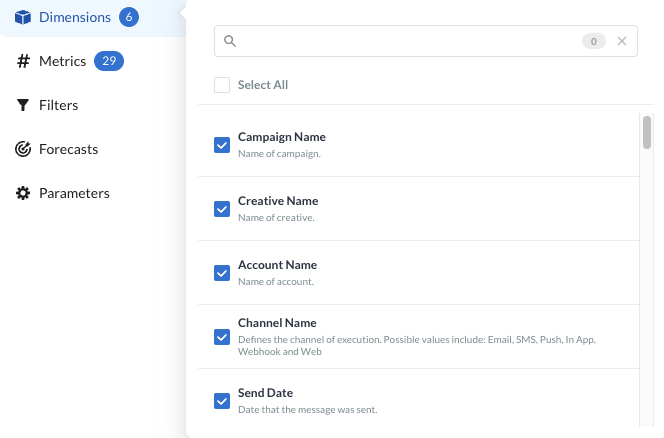
Dimensions
The Dimensions tab is where you can select all the dimensions you would like included in your report.
Metrics
The Metrics tab is where you can select all the metrics you would like included in your report.
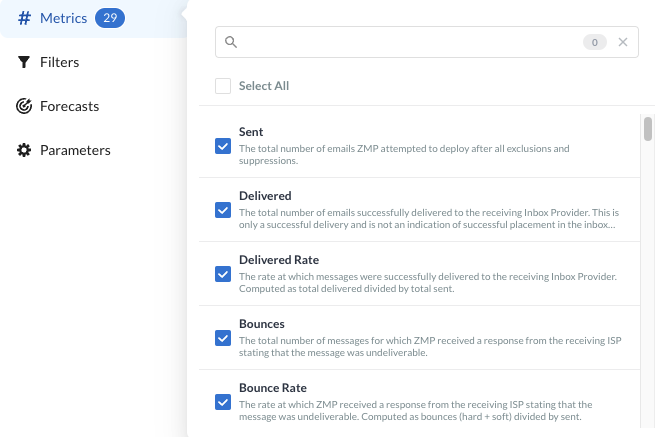
For a table to populate, you will need to select at least one metric and one dimension.
The Metrics & Dimensions Dictionary is always available for your reference.
Filters
Once you have made your metric and dimension selections, you can filter your data in the Filters tab.
Global Filters: Apply any global filters to refine data for analysis e.g. specific Campaign, Channel etc.
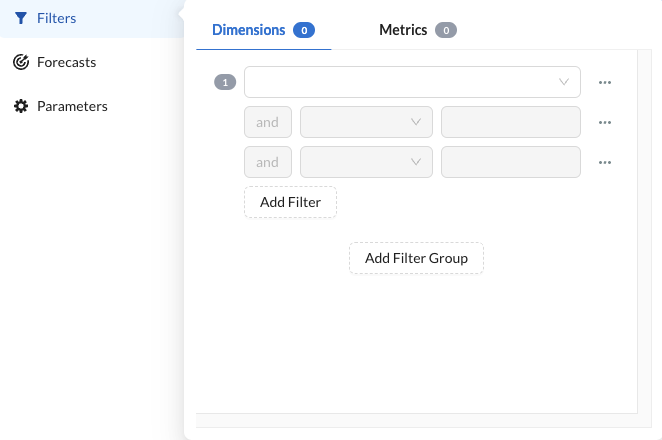
You can add more filters by selecting the Add Filter button. When adding a new filter, you can adjust the and/or operator.
To remove a filter, click on the action menu to the right of the filter and select Delete from the dropdown.
The following filters are not currently supported for Programmatic reports:
Does not contain, Contains one of, Starts with, Ends with, Lesser than or equal, Greater than or equal, Between
OR operators are not supported in the Programmatic Report Type.
Please note that some metric filters only allow numeric values
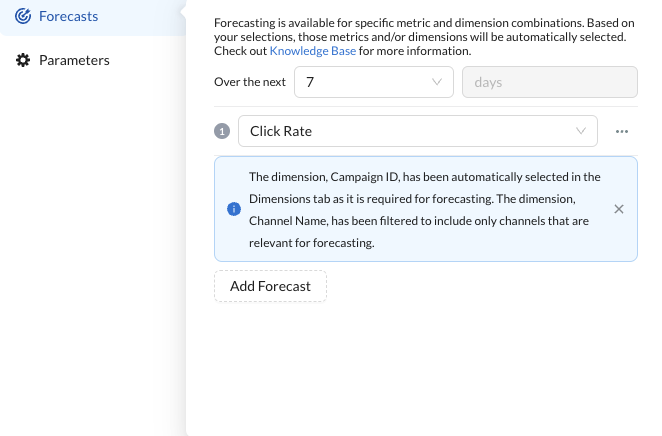
Forecasts
In the Forecasts tab of the Builder, you can select metrics from a limited list to forecast 1, 7, or 30 days out for Customer Marketing or Media Activation reports.
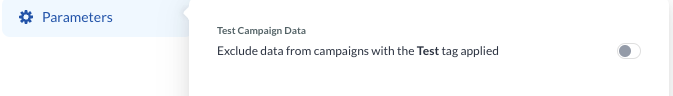
Parameters
Depending on the data type you selected in the Data tab, you may see an additional tab called Parameters. In this tab, you can make additional selections specific to that dataset.
Once selections are made, a data table preview will appear, displaying the filtered dataset for developing the report.
-20250205-080623.gif?inst-v=cb96b6a4-c026-485a-8bb8-735c732cd9cf)
Dynamic Date Ranges | Definition |
|---|---|
Today | Data available for today, the day the report is built. |
Yesterday | The day before the day the report is built. |
Last 2 days | Last 2 days, including the current day. |
Last 3 days | Last 3 days, including the current day. |
Last 4 days | Last 4 days, including the current day. |
Last 5 days | Last 5 days, including the current day. |
Last 6 days | Last 5 days, including the current day. |
Last 7 days | Last 7 days, including the current day. |
Last Week | All days in previous Monday - Sunday week, counting the Monday - Sunday that the current day falls within. |
Last 14 days | Last 14 days, including the current day. |
Last 28 days | Last 28 days, including the current day. |
Last 30 days | Last 30 days, including the current day. |
This month | All days in the current month, including the current day. |
Last month | All days in the previous month. |
Last 2 months | Last 2 months, including the current month. |
Last 3 months | Last 3 months, including the current month. |
Last 6 months | Last 6 months, including the current month. |
Last year | All days since the same day in the previous year, including the current day (last 365 days). |
Previous year | All months in the previous calendar year (in 2024 this would pull all months of 2023). |
Week to date | All days in the current week, including the current day. Weeks are defined as Monday - Sunday. |
Quarter to date | All days in the current quarter, including the current day. |
Year to date | All days in the current year, including the current day. |
All dynamic date range options include today’s (as in, the day you are building the report) data excluding yesterday’s, which includes only the day before today’s data.
Customizing: Charts & Visualizations
The Visualizations tab allows you to customize and enhance your report with intuitive chart configuration options:
Chart Type Selection
Choose from the following chart types:
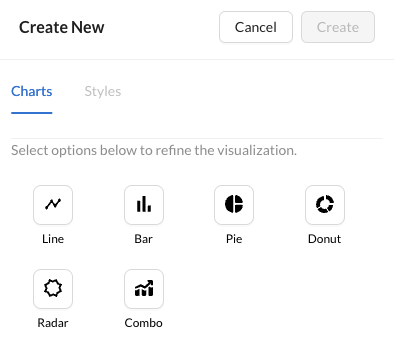
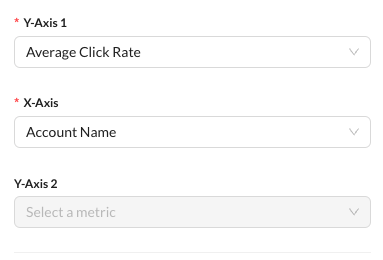
X-Axis & Y-Axis Configuration
Define how your data is visualized.
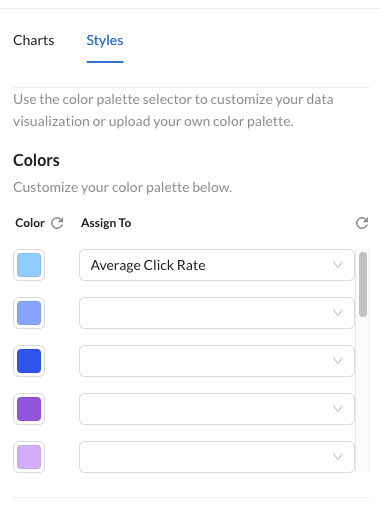
Color Customization
Within the Styles tab, adjust colors for better differentiation in your charts.
Single Pallete applied per Report -
Changing color assignment to a metric will assign the color to all chart visuals using that metric.
If the Color swatch is updated to a new color, all metrics using 1st color in pallete will be updated to use the new color.
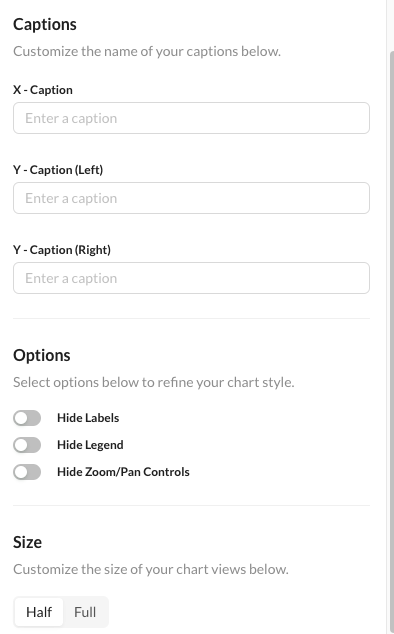
Caption Label, Legend & Zoom Controls
Within the Styles tab, show/hide controls:
Rename Axis Caption
Show/Hide Legend
Show/Hide Axis Labels
Zooming Control for deeper analysis
Half Row or Full Row Chart Size
.gif?inst-v=cb96b6a4-c026-485a-8bb8-735c732cd9cf)
Finalizing: Saving & Exporting
Review your report and Save the report giving it a name and optional question and description. Also, you could choose to save this report as a template for future use.
-20250205-090848.gif?inst-v=cb96b6a4-c026-485a-8bb8-735c732cd9cf)
You can also export or schedule ongoing report delivery by clicking on the action menu icon (…) on the header and clicking on Export/Automate.
-20250205-090956.gif?inst-v=cb96b6a4-c026-485a-8bb8-735c732cd9cf)
Select the way in which you want to receive your report: Amazon S3, Microsoft Azure Blob Storage, Email, Google Buckets, or SFTP, and click on Next.
Select the cadence at which you want to receive your report: Daily, Weekly, Monthly, Quarterly, Yearly.
Learn more about the Export Destinations.
You can modify charts or data selections anytime for up-to-date insights.
Check out our FAQs page to find all your answers at once.