

CustomerPulse enriches any segment (1st party or prospect segments) and profiles customers across 5,000+ Zeta attributes to retain and grow your existing base and reach new customers who are most likely to engage with you. The report provides insights on demographics, psychographics, online content consumption, transactions, visitation, financial & household, CTV, and Linear TV. Simply put, CustomerPulse allows clients to:
-
Segment and analyze a variety of audience segments from prospects to first-party customer data
-
Identify unknown site visitors and unlock additional insights on potential customers
-
Gain ongoing refreshes of segment insights to understand any changes in behaviors or purchase patterns
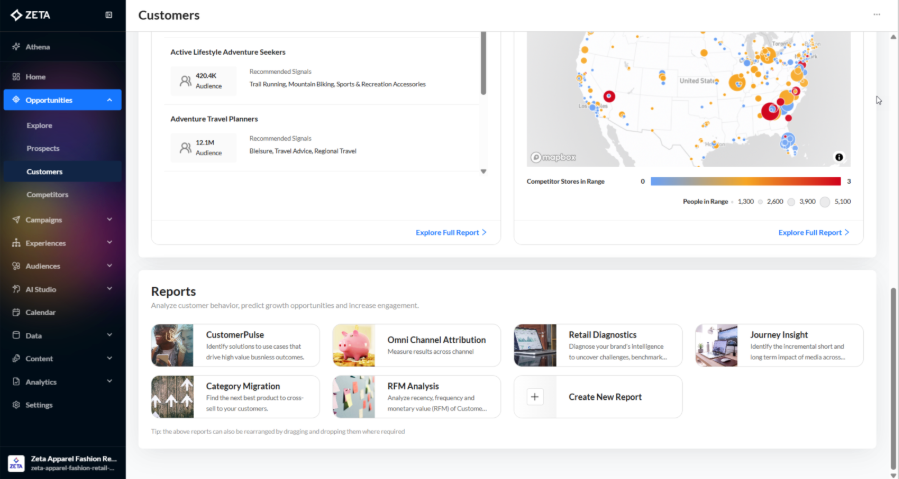
In the Opportunities menu, navigate to Customers, then scroll to the reports section.
Once you’ve created an audience segment, contact your account team to add the segment(s) to CustomerPulse.
Please select up to four segments to deep dive into their Coverage, Demographics, Psychographics, Online Content Consumption, Transactions, Visitation, Financial & Household, CTV, and Linear TV, leveraging the Data Cloud's online, transactional, location, financial, and household datasets.
Generative Personas
The Generative Personas tab will only appear as the first tab within CustomerPulse for ZMP accounts that have explicitly requested the report. For accounts where the report has not been requested, the CustomerPulse experience remains unchanged.
Generative Personas displays the top indexing personality types of your customers as identified by the Zeta Data Cloud, arranged in the order of their relative sizes.
The report highlights four key personas that represent distinct audience segments. Clicking on a persona reveals detailed insights into their behaviors and preferences. From there, you can further explore actionable recommendations tailored to that persona’s activity.
-20250430-061531.gif)
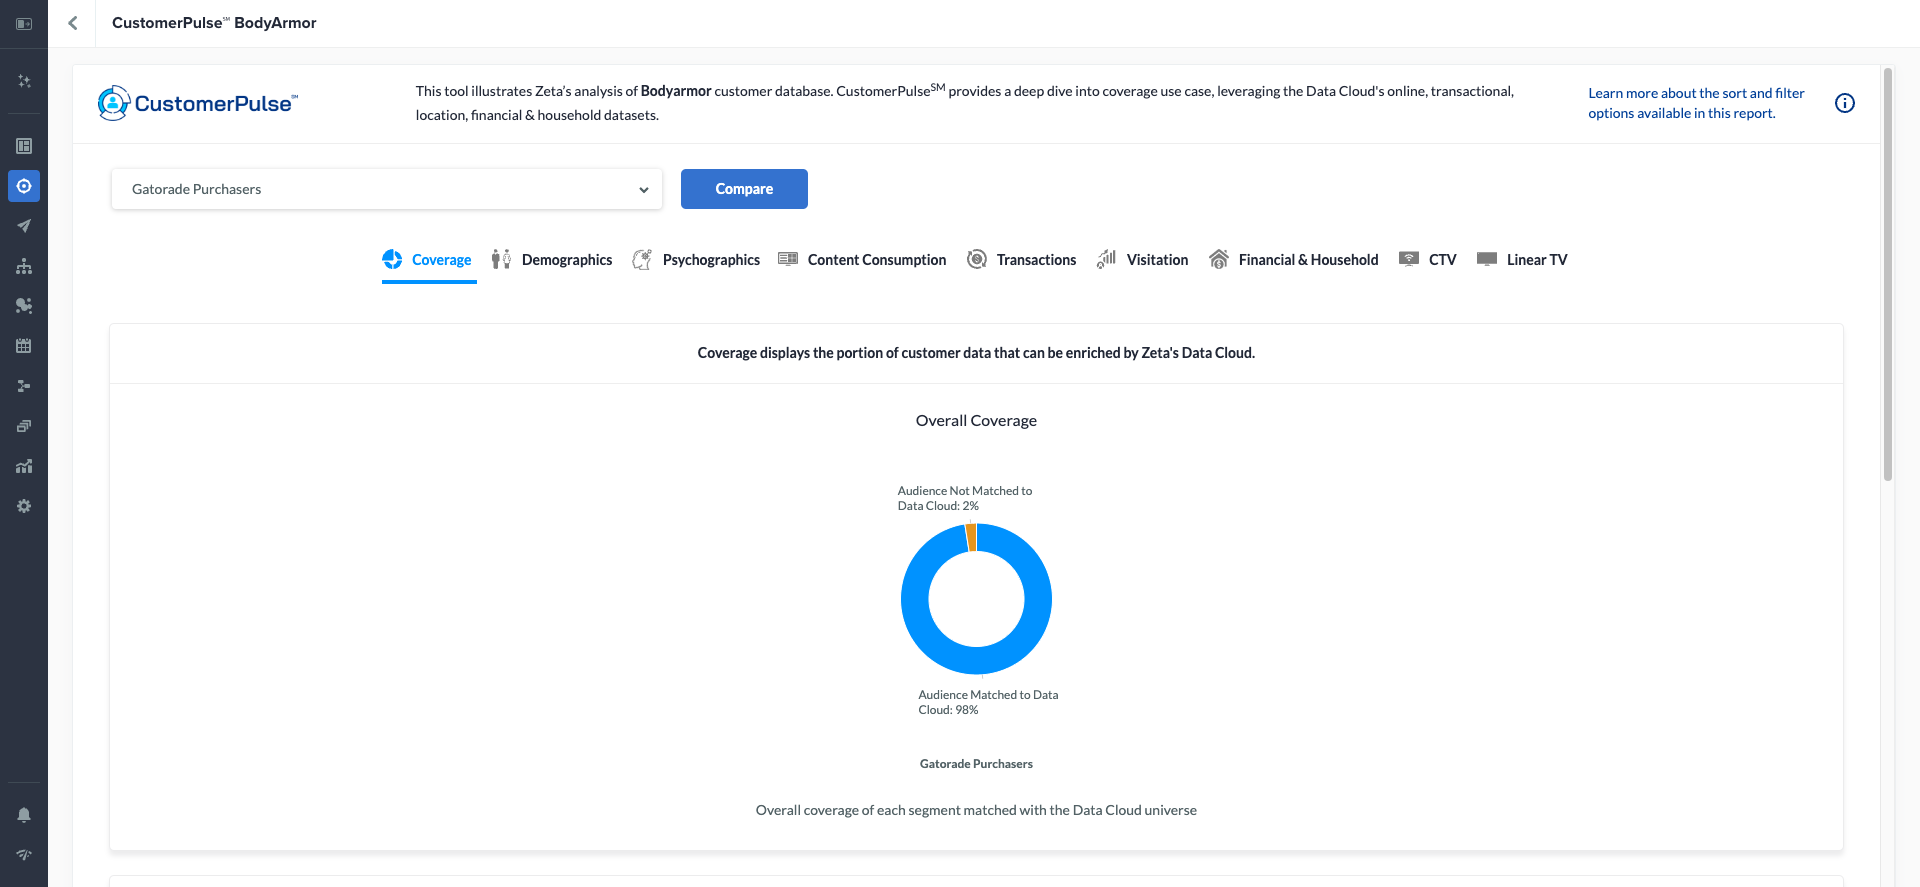
Coverage
This displays the portion of customer data that can be enriched by Zeta's Data Cloud. Under Coverage, the reachability section showcases where you can reach those individuals. Activity by Channel shows where those individuals are most likely to engage.
-20241007-091337.gif?cb=325fe6cedbb9e577f243cff0d4af4483)
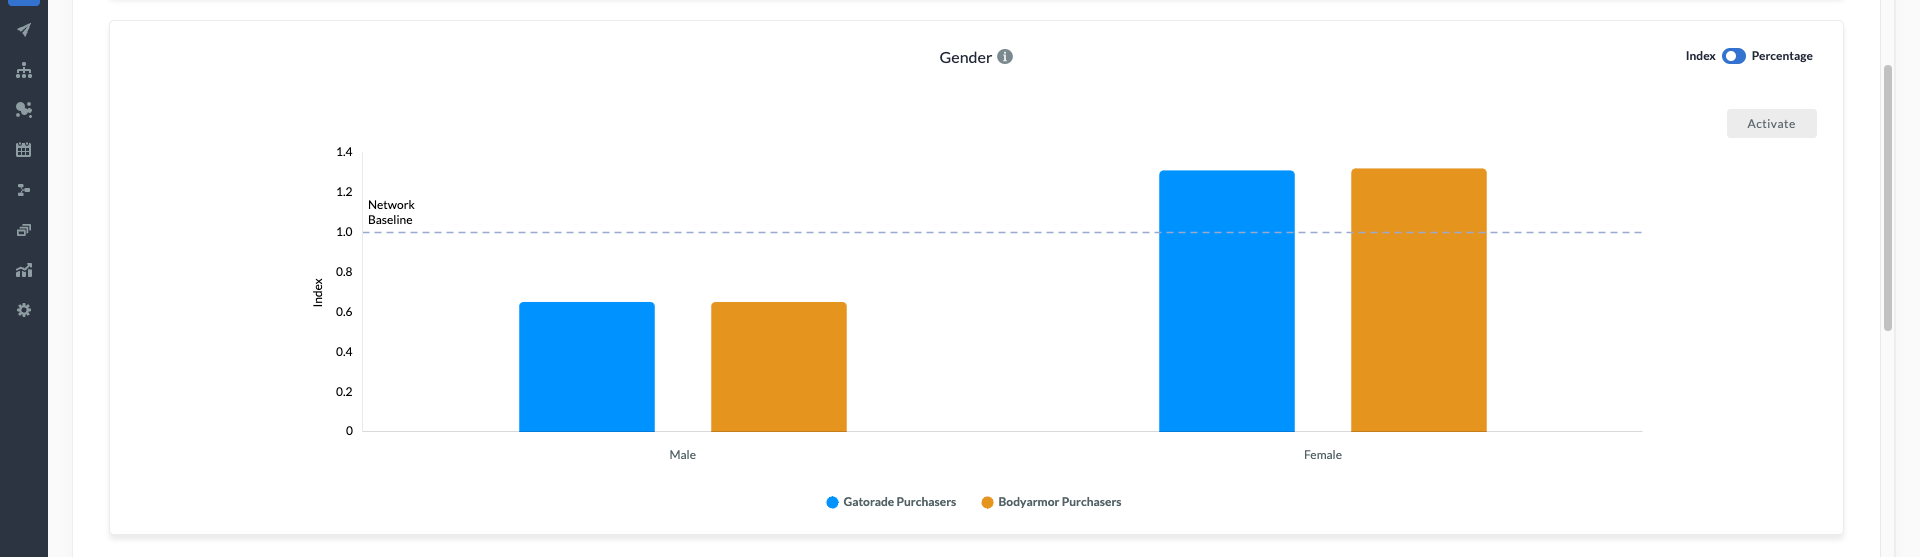
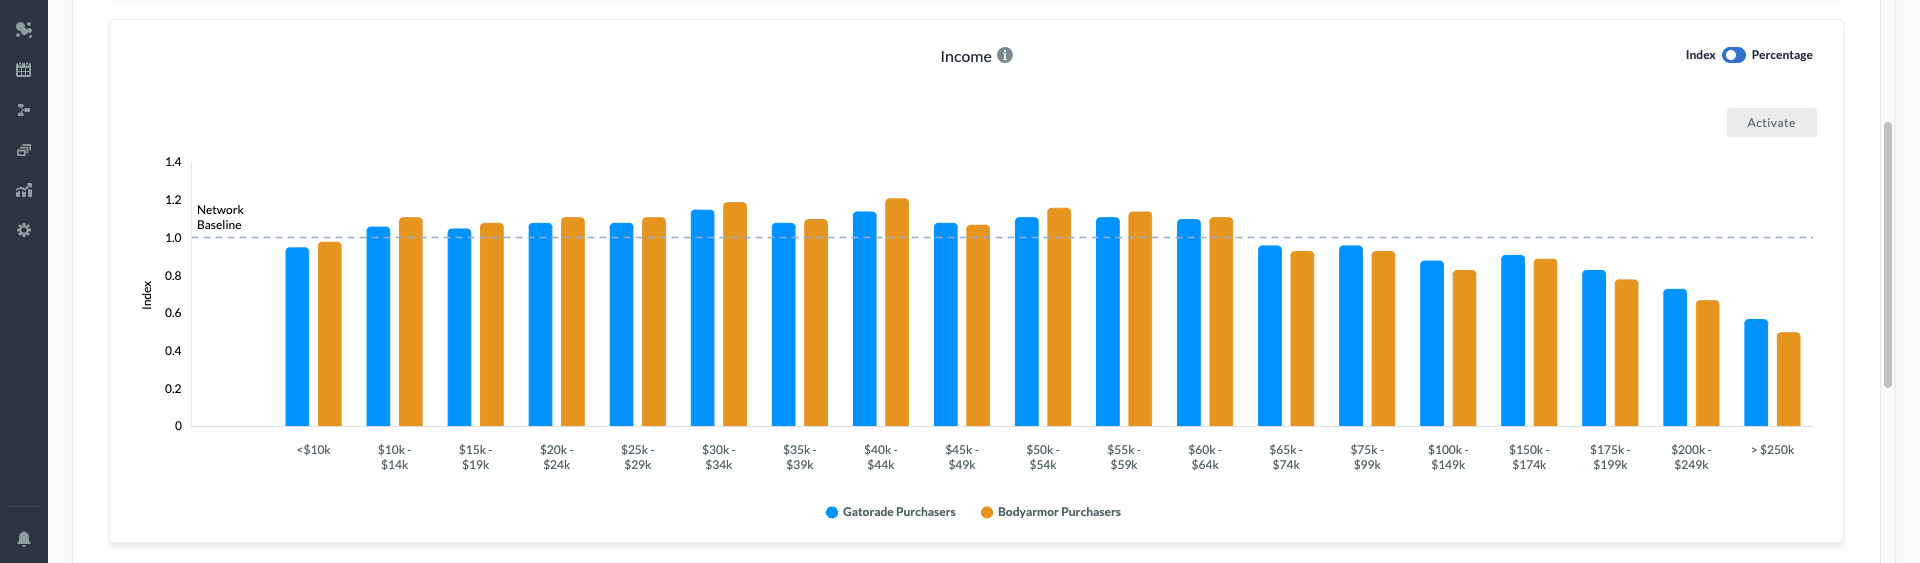
Demographics
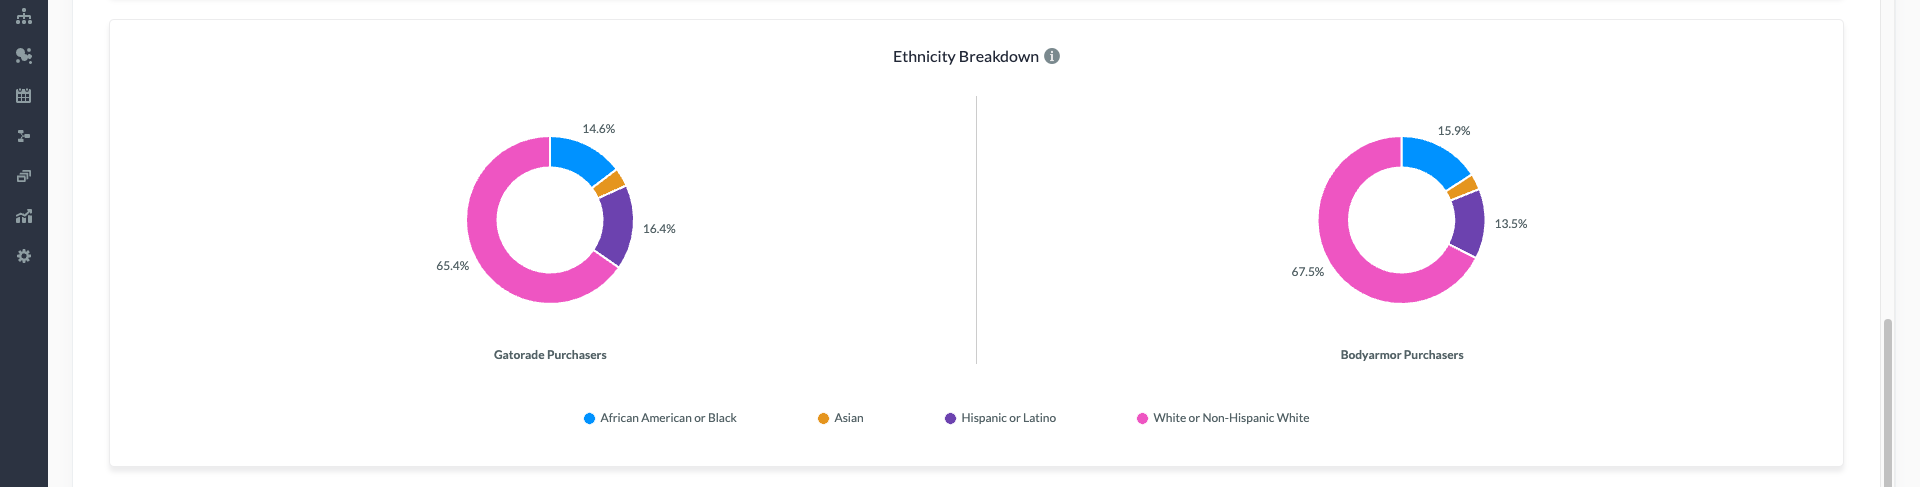
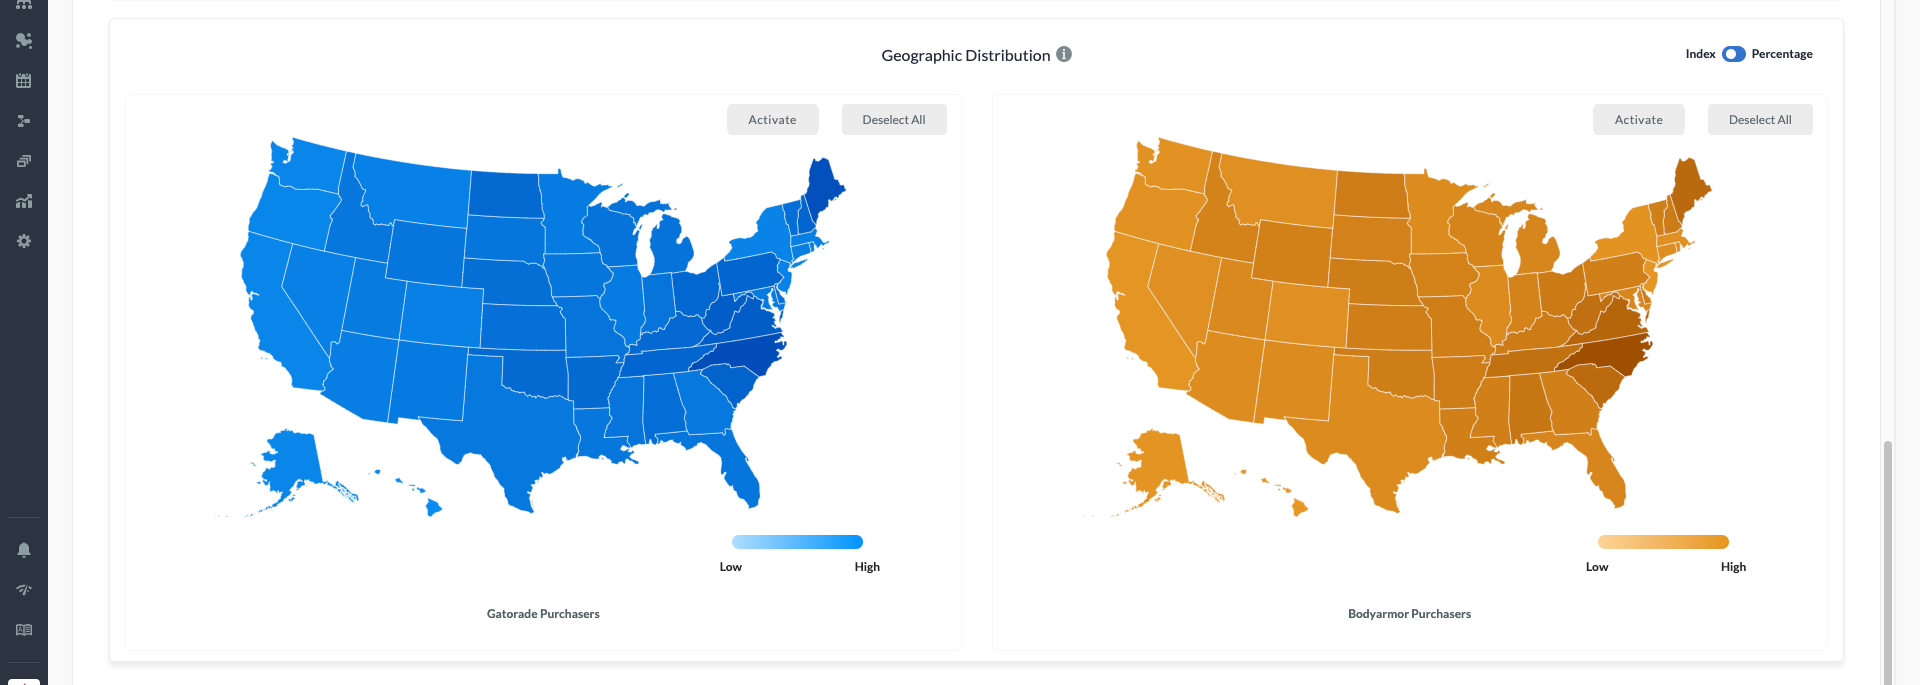
In the Demographics tab, explore the breakdowns of age, gender, income, ethnicity, and geographic location of the analyzed segments.
The indices here indicate how much more or less likely members of the analyzed audience are to exhibit a particular trait compared to Zeta’s baseline audience. An index above the network baseline means they're more likely to exhibit that trait, while an index below the network baseline means they’re less likely.
Percentages are shown upon hovering over the bars, representing relative differences from the Network Baseline, providing a quick visual reference for comparative magnitude.
|
Age Index |
|
.gif?cb=cfd331b3251362c436ddd2e5b7cd4ec4)
|
|
Gender Index |
|
|
|
Income Index |
|
|
|
Ethnicity Breakdown Index |
|
|
|
Geographic Distribution Index |
|
|
Psychographics
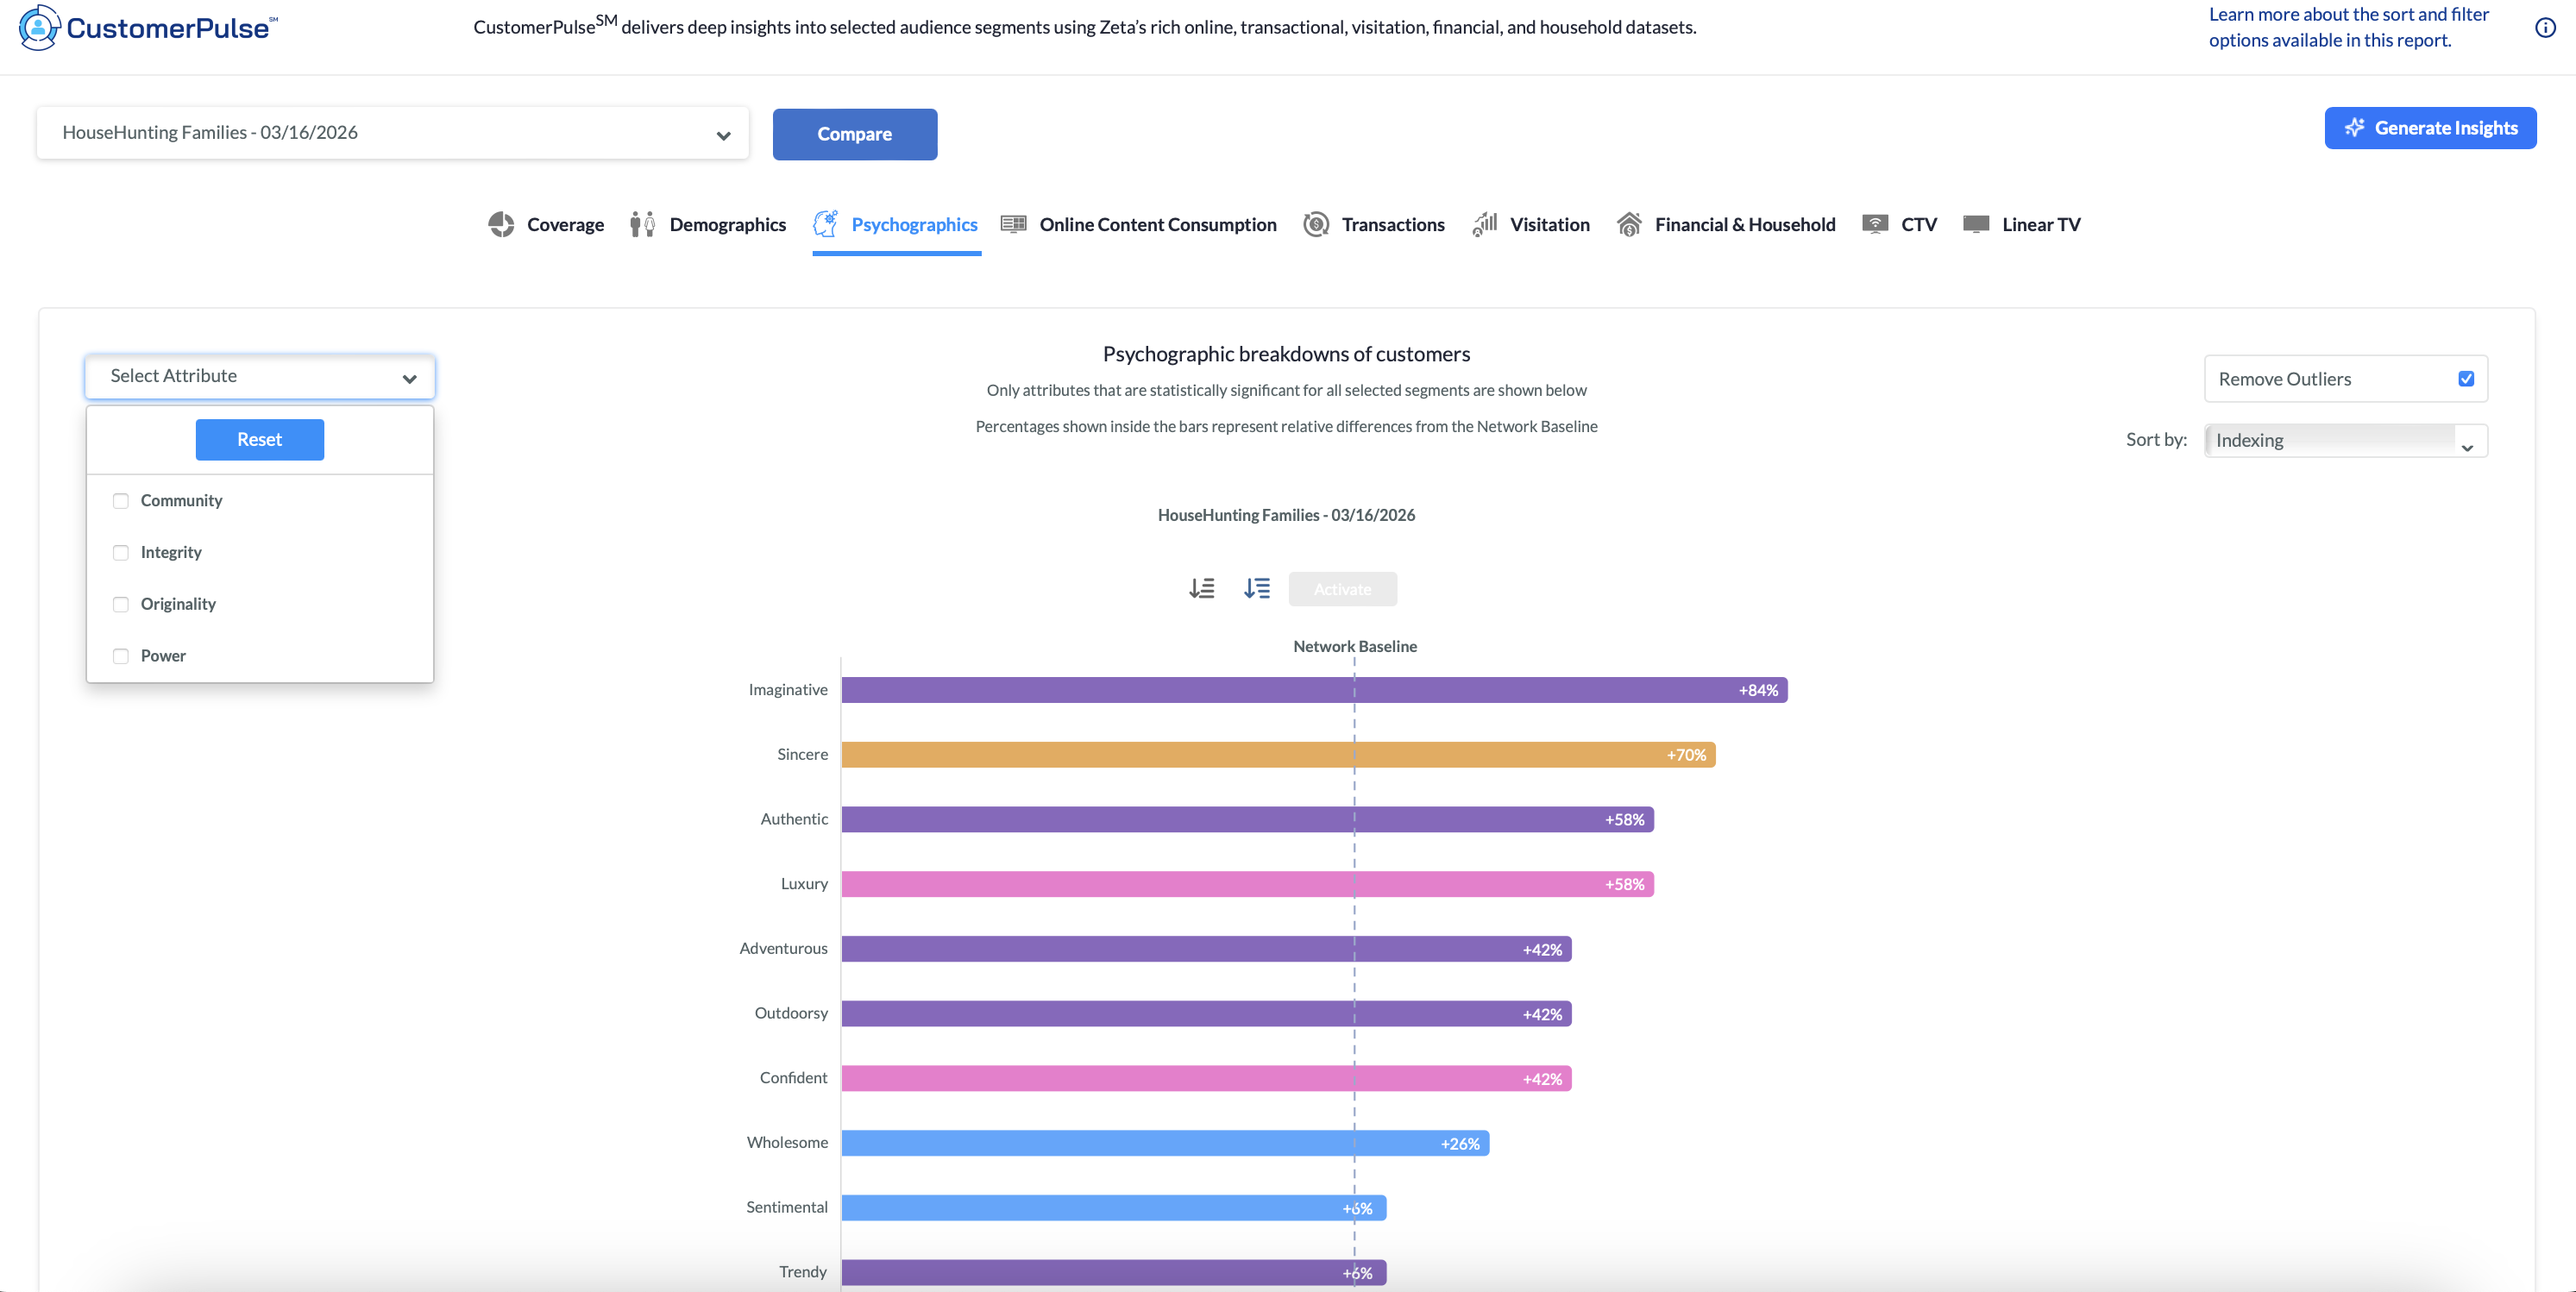
This shows the Psychographic breakdowns of the analyzed segments. Psychographics is Zeta’s method for identifying the real values consumers express through behavior, guiding both precise targeting and message development to improve campaign performance.
You can select categories from the dropdown on the left to refine the view.
Online Content Consumption
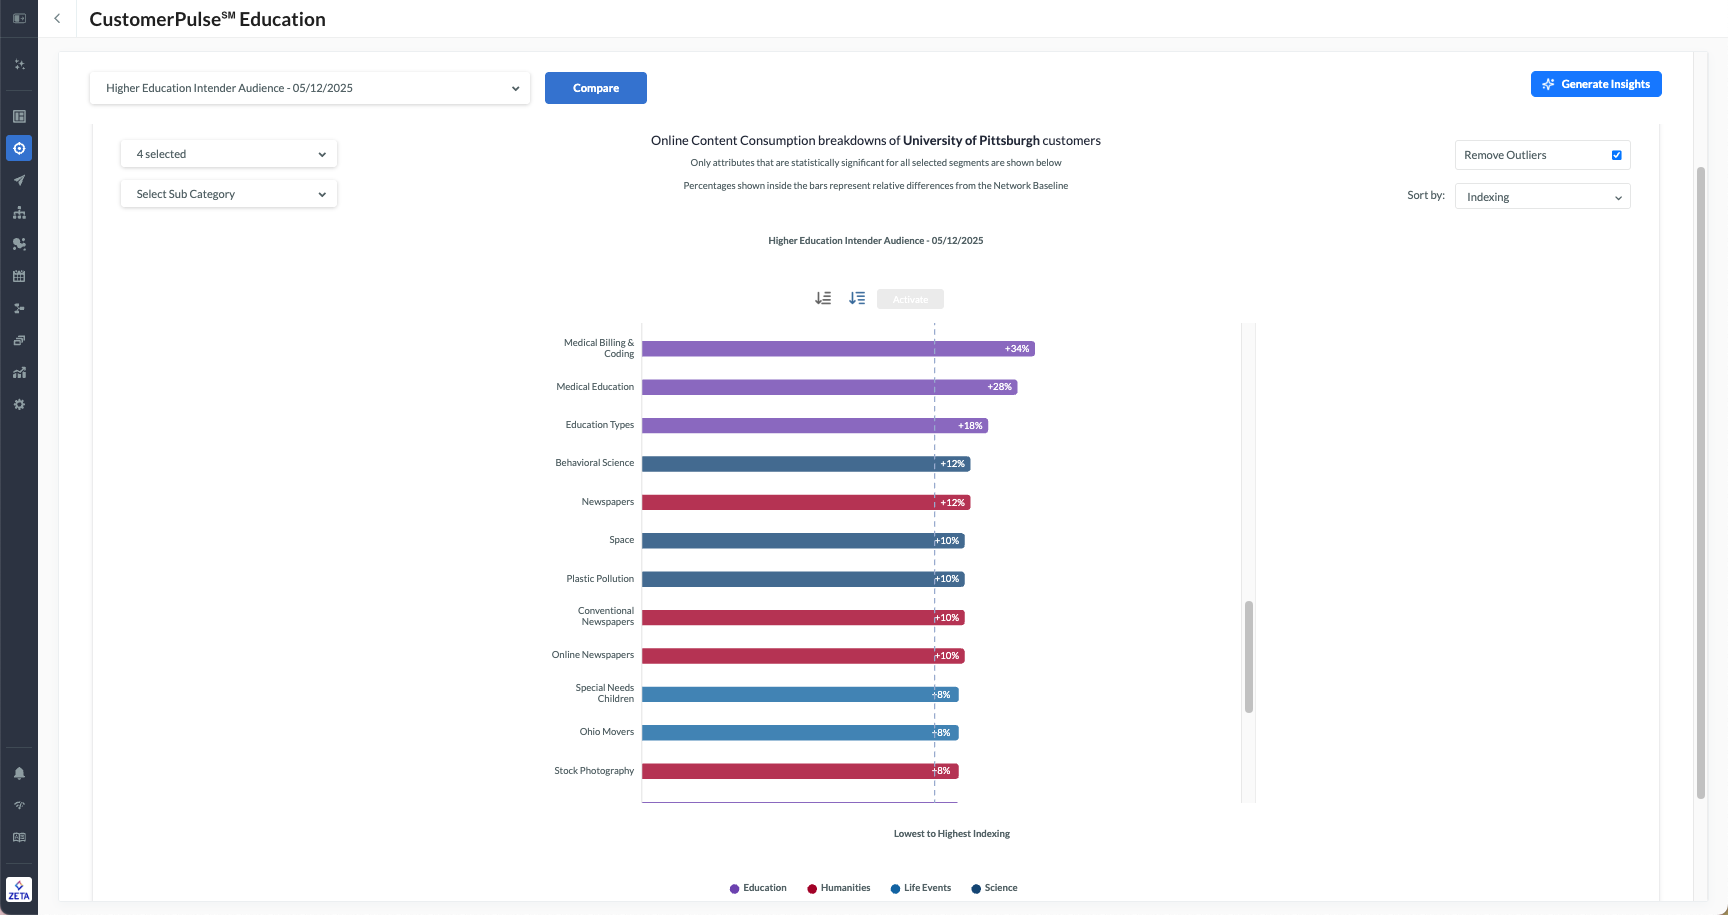
This shows the online content consumption topics of the analyzed segments.
-
You can select/deselect specific attributes from the dropdowns on the left to refine your statistics for the selected segments.
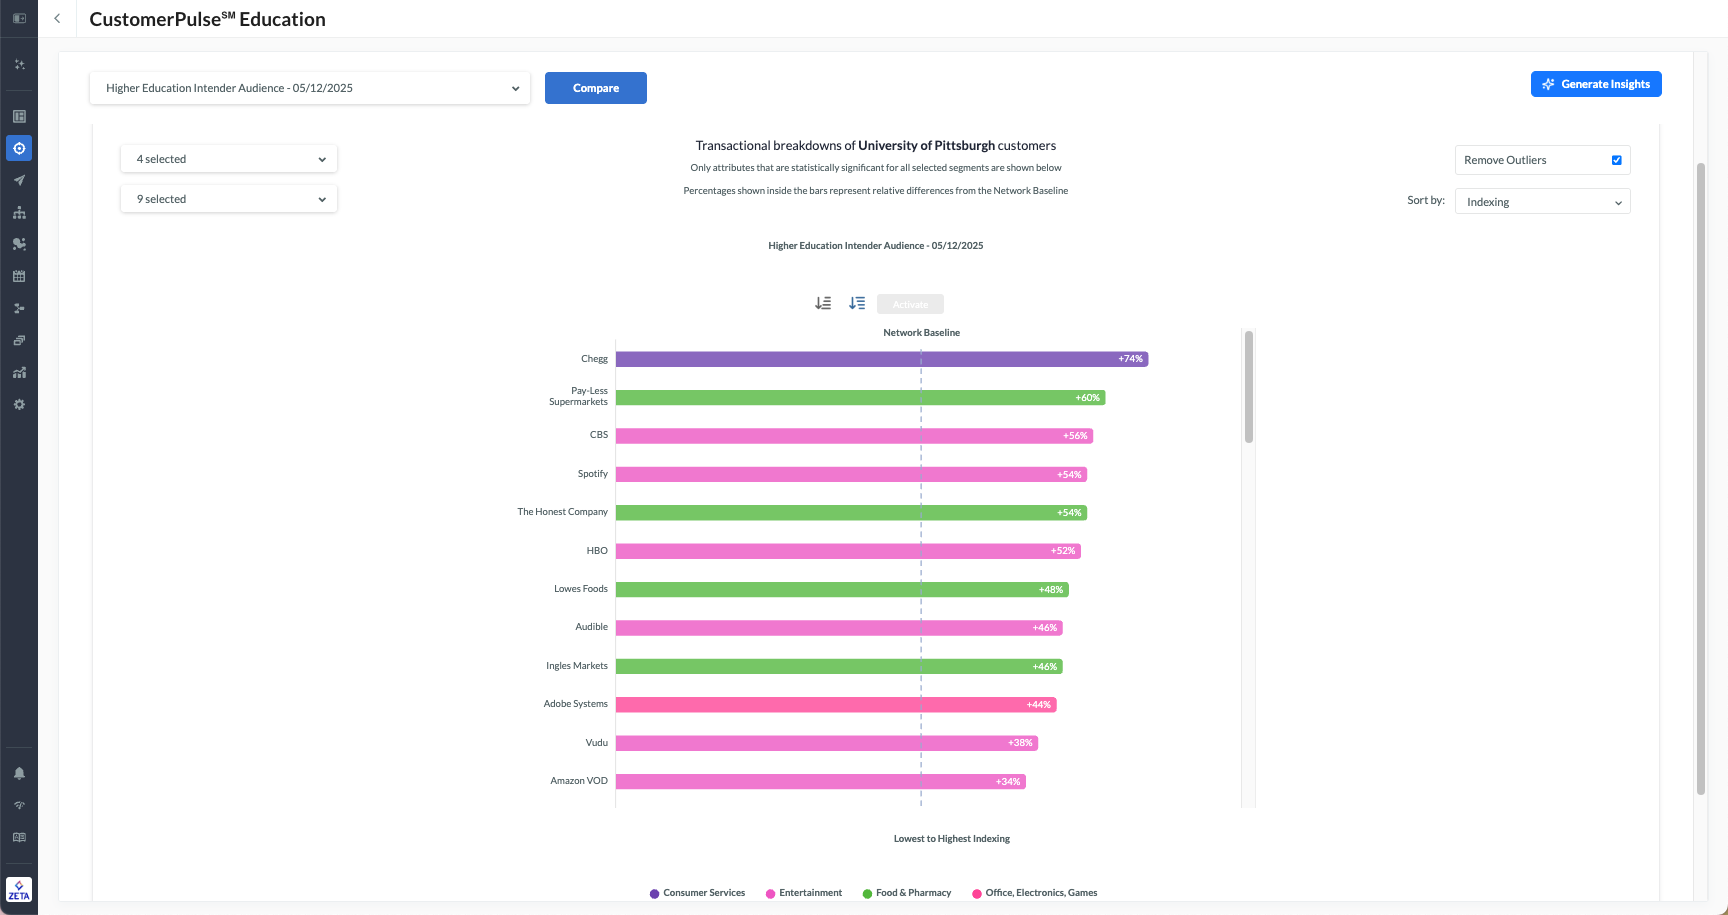
Transactions
This shows the brands where the analyzed audiences are mostly likely to transact with.
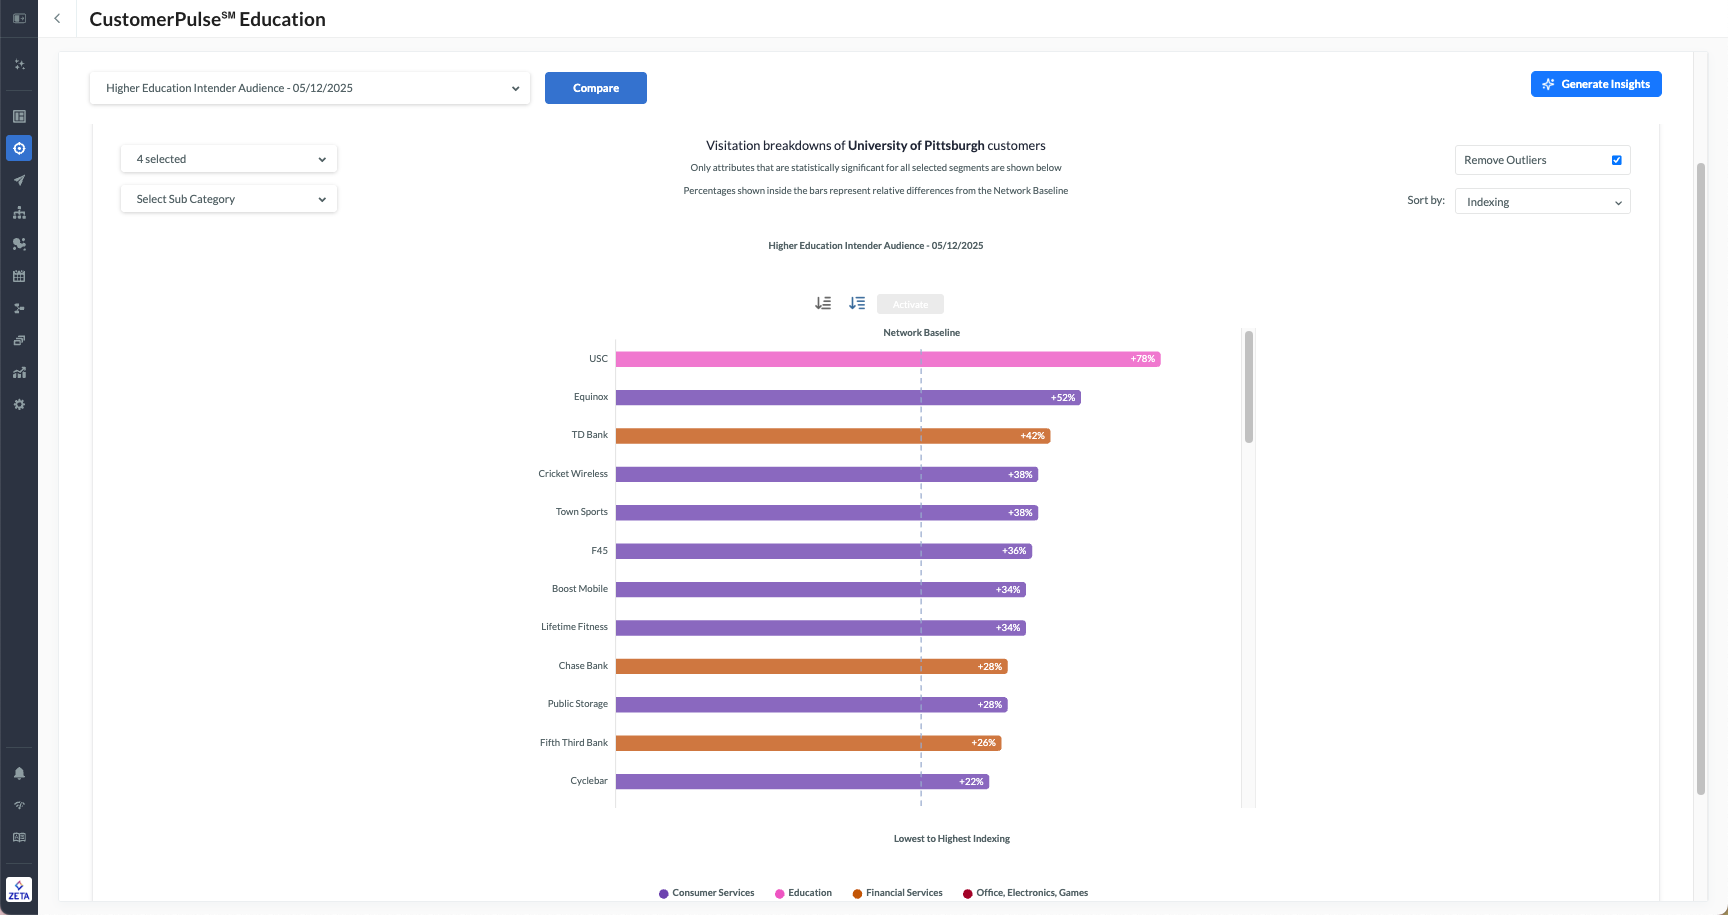
Visitation
This shows the brands and locations that the analyzed segments have visited in the last 90 days.
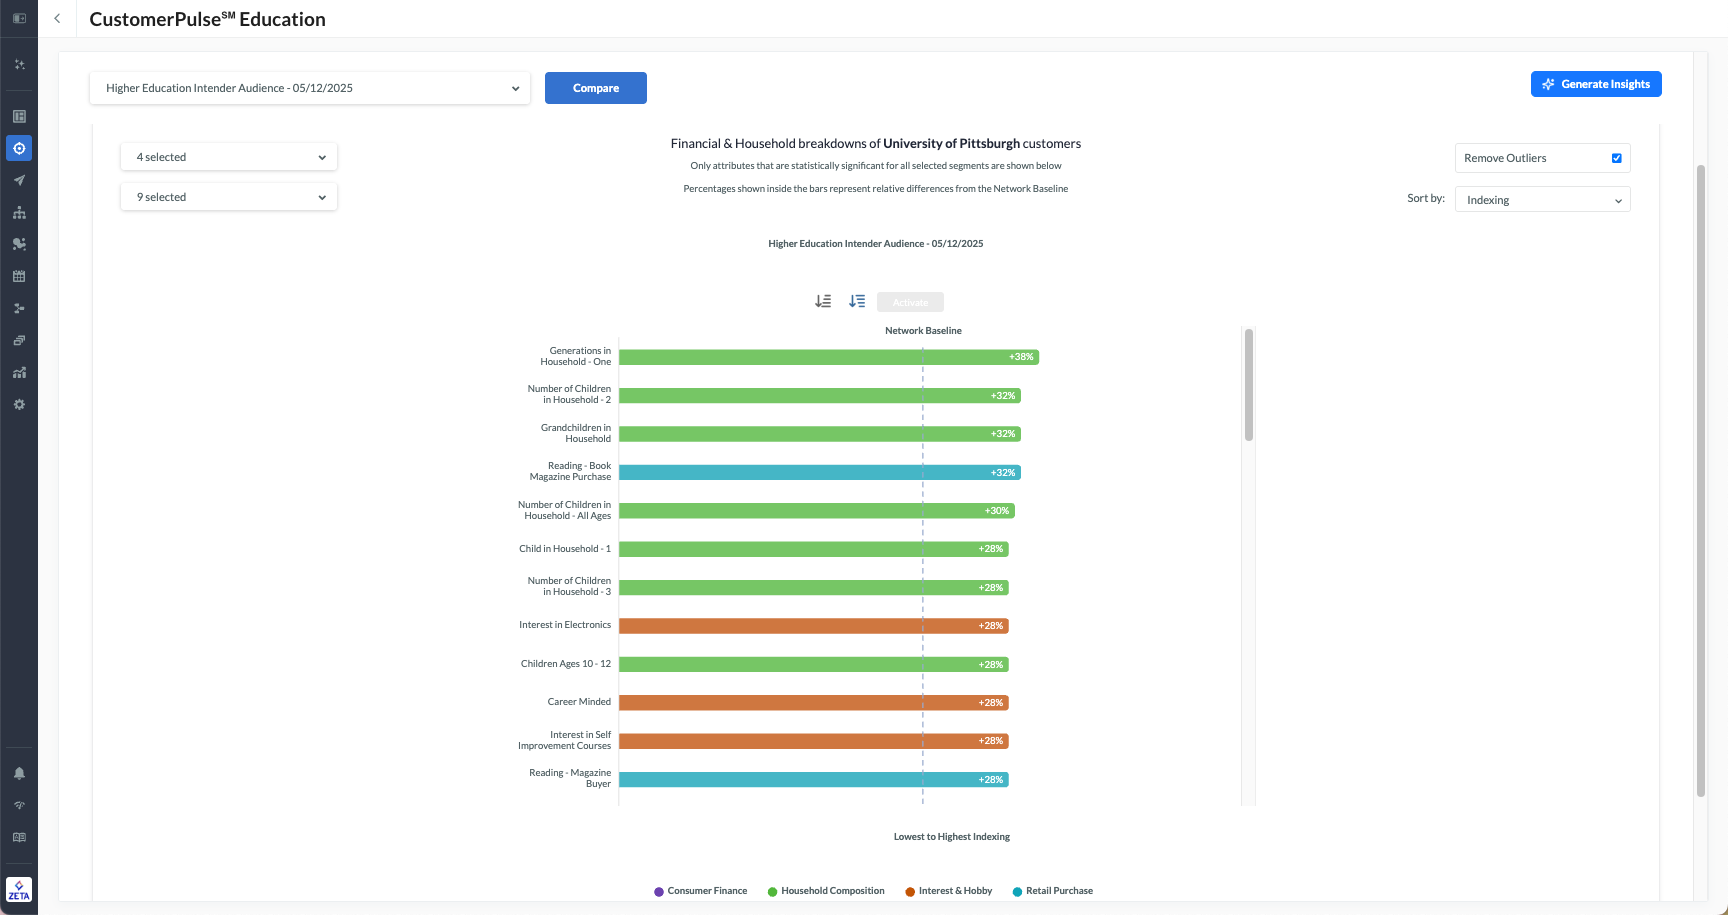
Financial & Household
This shows the Financial & Household breakdowns of the analyzed segments.
CTV
This shows the Connected TV (CTV) consumption levels and viewing habits of the analyzed segments.
-20250611-053012.gif?cb=3c5b47cb92d895d68460ce5e00a76c0a)
-
Hovering over the bars reveals the percentage difference relative to the Network Baseline.
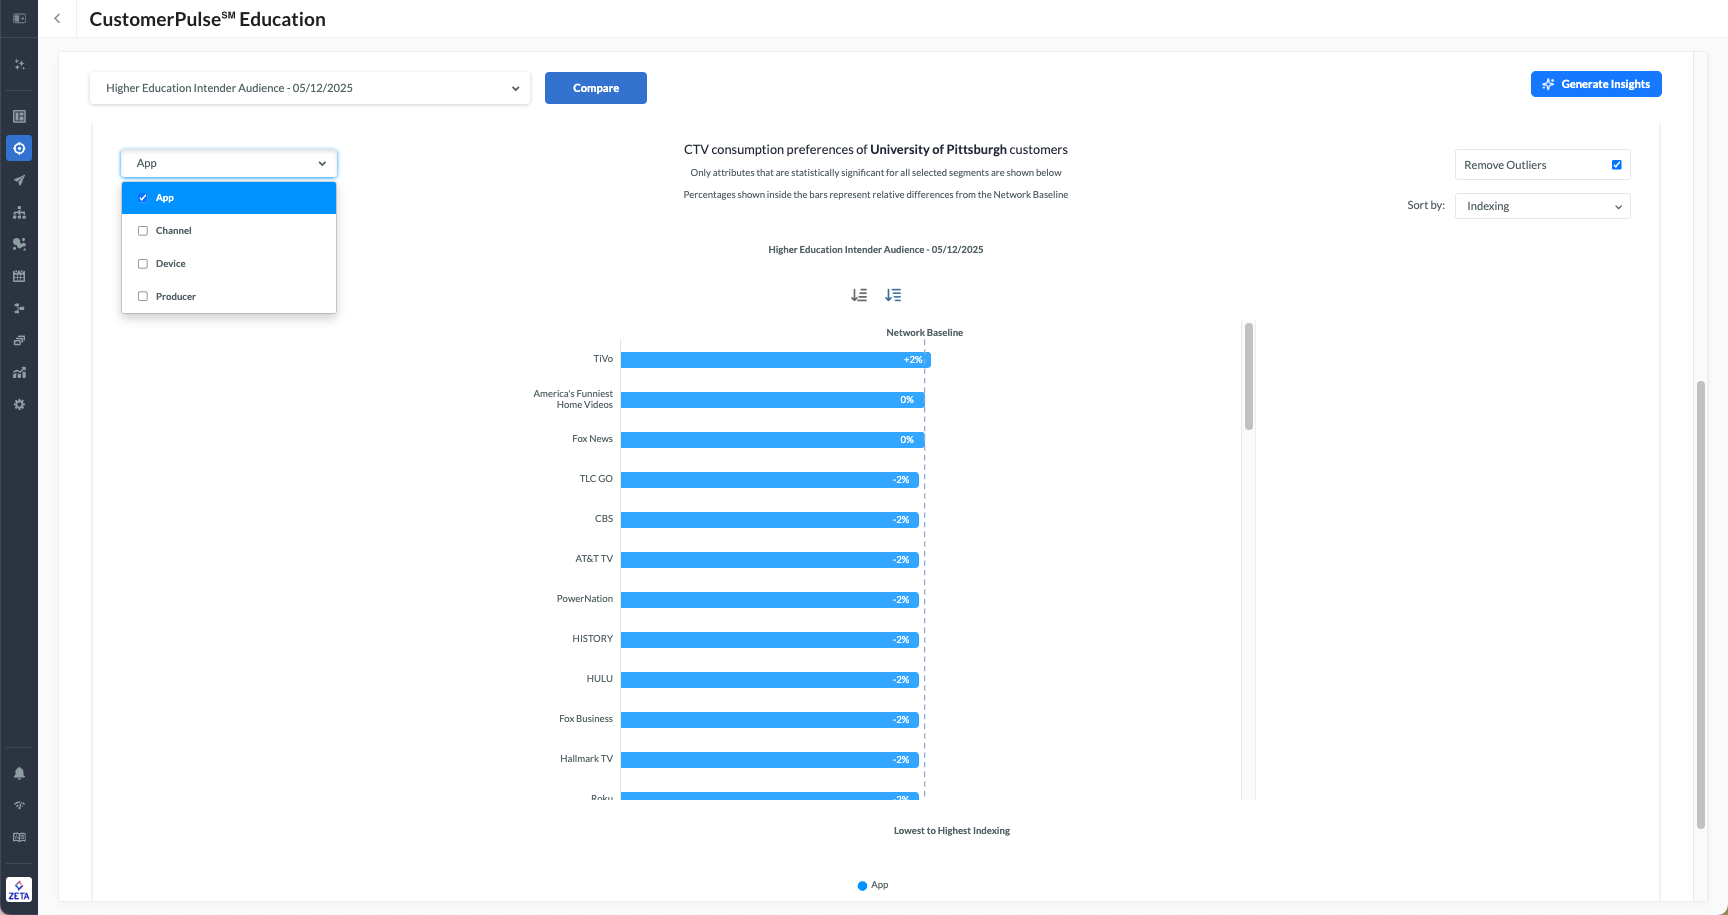
-
You can choose between App, Channel, Device, and Producer from the dropdown on the left.
Linear TV
This shows the Linear TV consumption levels and viewing habits of the analyzed segments.
-20250611-053150.gif?cb=8d745650d131124f255a509e7a40237a)
-
Hovering over the bars reveals the percentage difference relative to the Network Baseline.
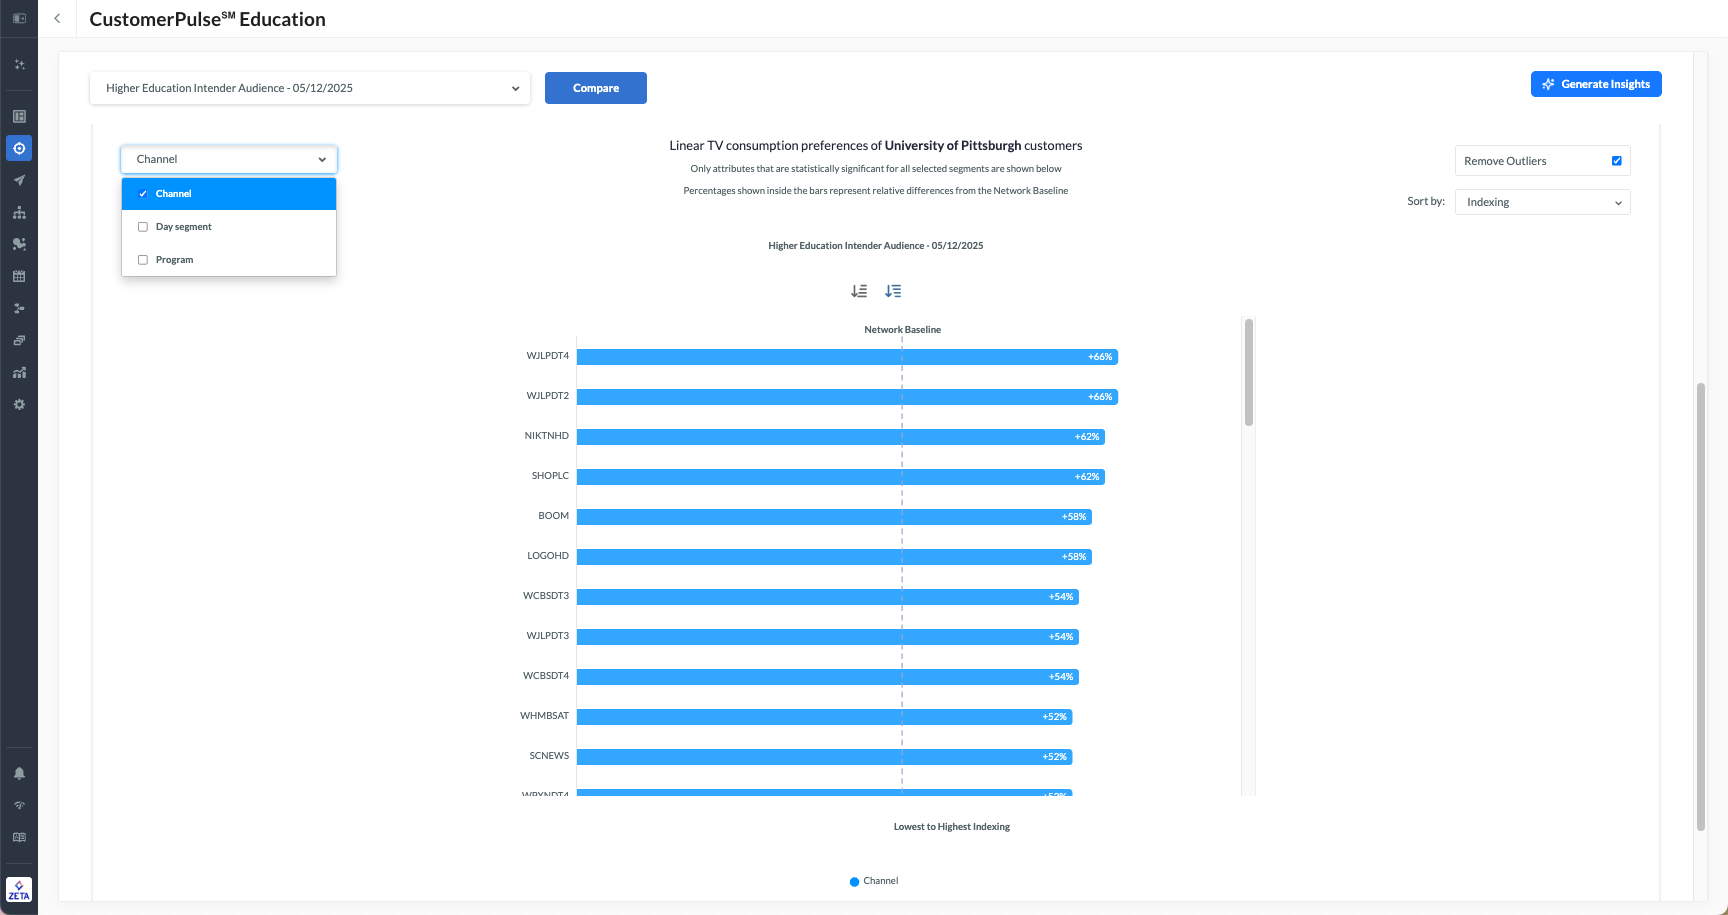
-
You can choose between Channel, Day Segment, and Program from the dropdown on the left to refine your statistics for the selected segments.
Generate Insights
Within any section of CustomerPulse, you can click on the Generate Insights button at the top-right to let AI generate an insight and recommendation report for your selected segments.
-20240415-100401.gif?cb=9f59cb3df8db92e905f3fe1219bdfafb)
-
You can further download the generated insights report.
-
You can also provide your feedback on the generated report.
CustomerPulse Customization
CustomerPulse customization allows you to customize your views including automatically removing outliers and you can also select the customer match percentile thresholds. Additionally, you can display indexing vs customer ratio.
Click on the icon at the top-right for detailed instructions on the various customization options available in the CustomerPulse report.
-20241007-092844.gif?cb=90e8e9b340461a3e985718705edb7a32)
|
|
Question |
Answer |
|---|---|
|
Are these lookbacks customizable, e.g., does Zeta retain historical data that we can access with this tool? |
Lookbacks in CustomerPulse are not customizable, but Leading Indicators, another Opportunity Explorer report, has more flexibility for viewing historical data. |
|
For a Customer Pulse segment, will the data six months from now reflect the prior 3 months, or July/August/September 2023 in perpetuity? |
The members of the segment itself will change over time as new users are added to that segment, but the insights generated in the CustomerPulse will not update over time. The insights shown are relative to when the analysis was run. If you'd like to get regularly refreshed insights for this segment, we can schedule the CustomerPulse to run on a weekly, monthly, or quarterly frequency. |