

The Forecaster is fed by a 7-day rolling sample of data. We sample 0.015% of bids a 1.5% of wins on total available inventory. The Forecaster pipeline takes 2-3 days to run. Therefore, a user looking at the Forecaster today can expect the forecast to include days starting from the current day -10 (7 days of sample data +3 days for the process to run = 10 total days) and moving forward 7 days.
Navigation
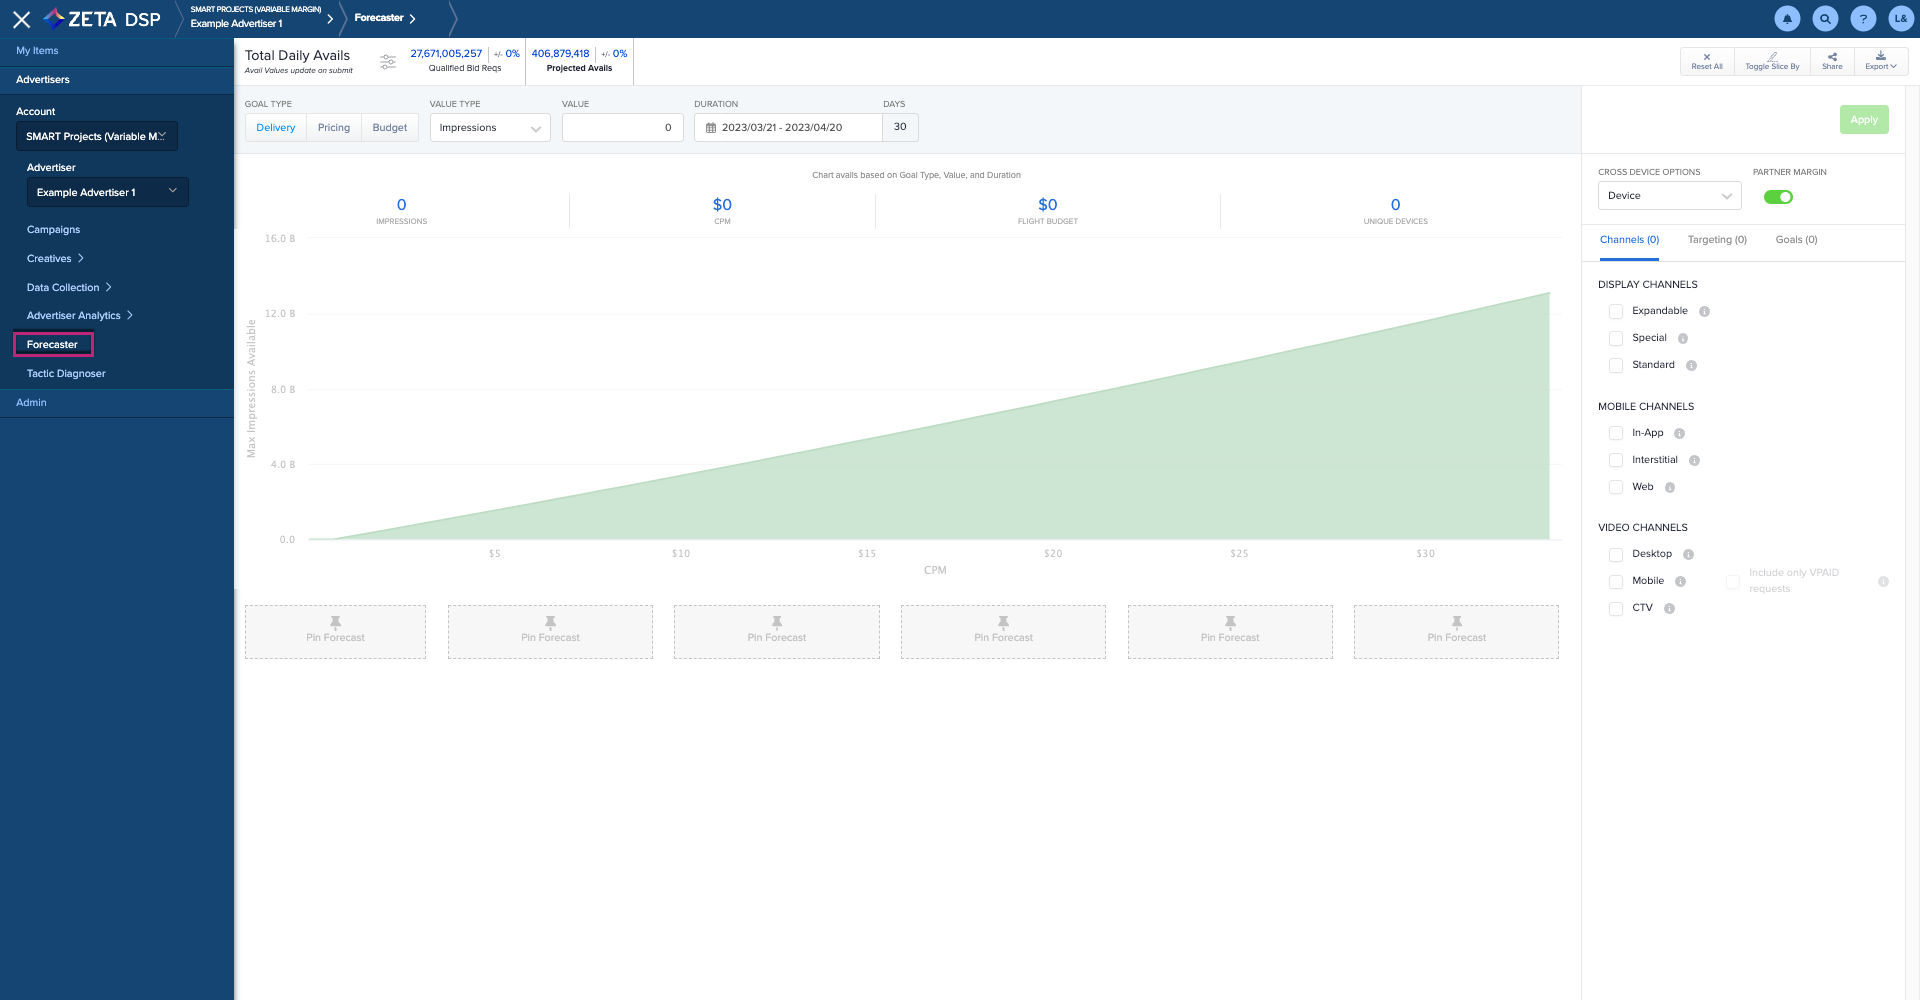
Click on the DSP logo in the upper left corner. Within the menu that appears for Advertisers and Admin, select your desired account and advertiser. Click on Forecaster.
Adjustment Layers
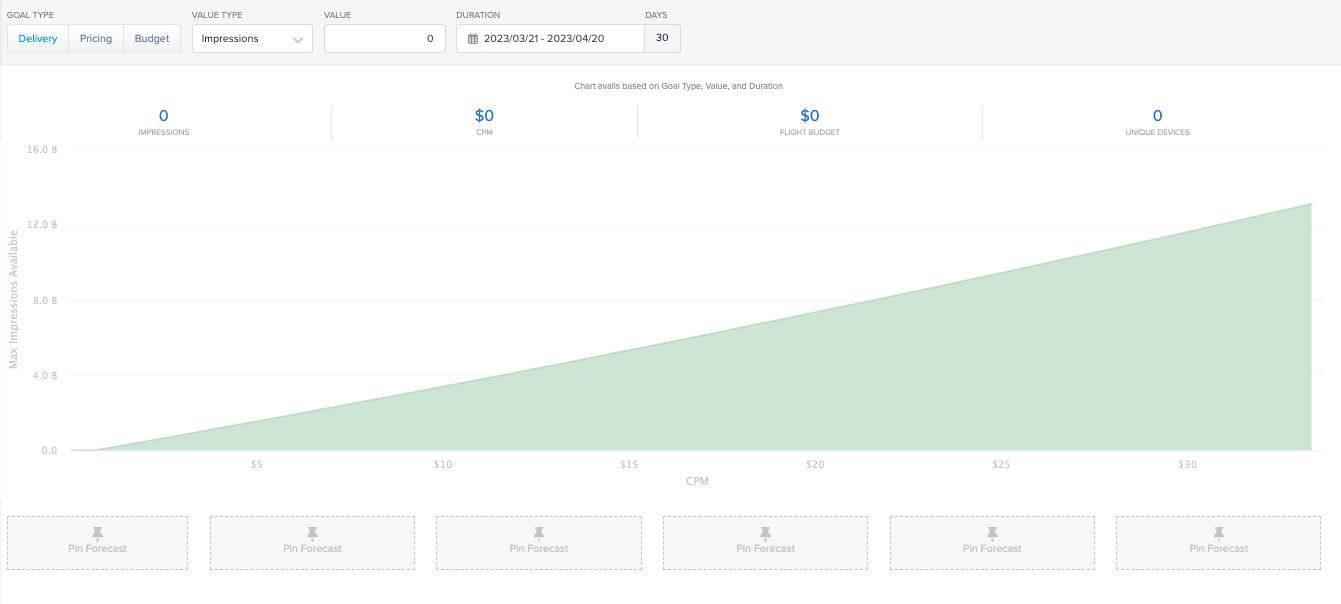
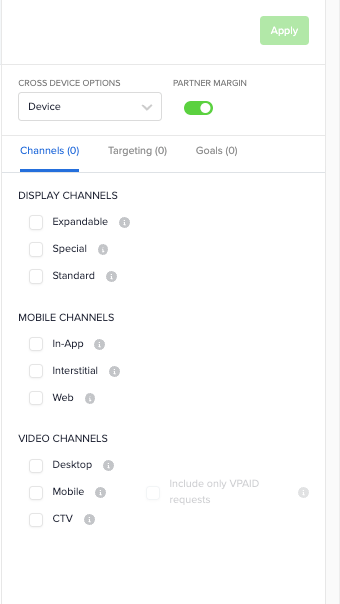
There are three areas to adjust within the Forecaster:
-
The Scorecard
-
The Goals Chart
-
Campaign Parameters
Pinning your Forecast
1. Once a forecast is created, click on Pin Forecast below the chart.
.gif?cb=60ca8ddc8e5247c42688ddc3984c9de0)
2. Provide a name for the forecast and hit Save.
-
The forecast is now saved for your use and will appear below the chart.
3. To view a pinned forecast again, hover over it and click on Load.
4. To update a pinned forecast, click on Update. Make any adjustments to the Campaign Parameters and/or Goal Chart, and click on Apply. Updated avails will be reflected in the Scorecard.
Updates made to a pinned forecast will not override its original configuration. To save an updated view, you will need to create a new pin.
5. To delete a pinned forecast, click on Remove. When asked Are You Sure?, click on Remove Pin.
6. To edit the name of a pinned forecast, click on the pencil icon. Provide a new name in the pop-up window that appears and hit Save.
Sharing your Forecast
To share a Forecast, click on the Share icon located in the toolbar in the upper right-hand corner.
.gif?cb=6fa49e0a3bdd8c54247ee69962fbc009)
-
Select Copy to share the Forecast link with any DSP user via any means of communication.
Slicing Your Forecast
You can slice your forecast in many ways by replacing the graph with a chart of your data.
1. To slice your forecast (current view), click on the Toggle Slice By icon located in the toolbar in the upper right-hand corner.
.gif?cb=cfa0b2014f71346d35234c8b16118983)
2. By default, the Scorecard will be visible in the chart. This data includes values for:
-
Qualified Bid Reqs
-
Projected Avails
3. To filter the columns shown for the Scorecard, click on the grid icon.
4. Select the Scorecard metrics you want to view. Additionally, there is an option to slice by the targeting and restriction types applied to the forecast. To achieve this, navigate to the Slice By filter above the chart.
There is no option to slice by device at this time.
5. Select a single parameter you would like to slice by. The metrics and values present in the chart will be updated based on the selection you have chosen.
You are limited to slicing by one parameter at a time.
Exporting your Forecast
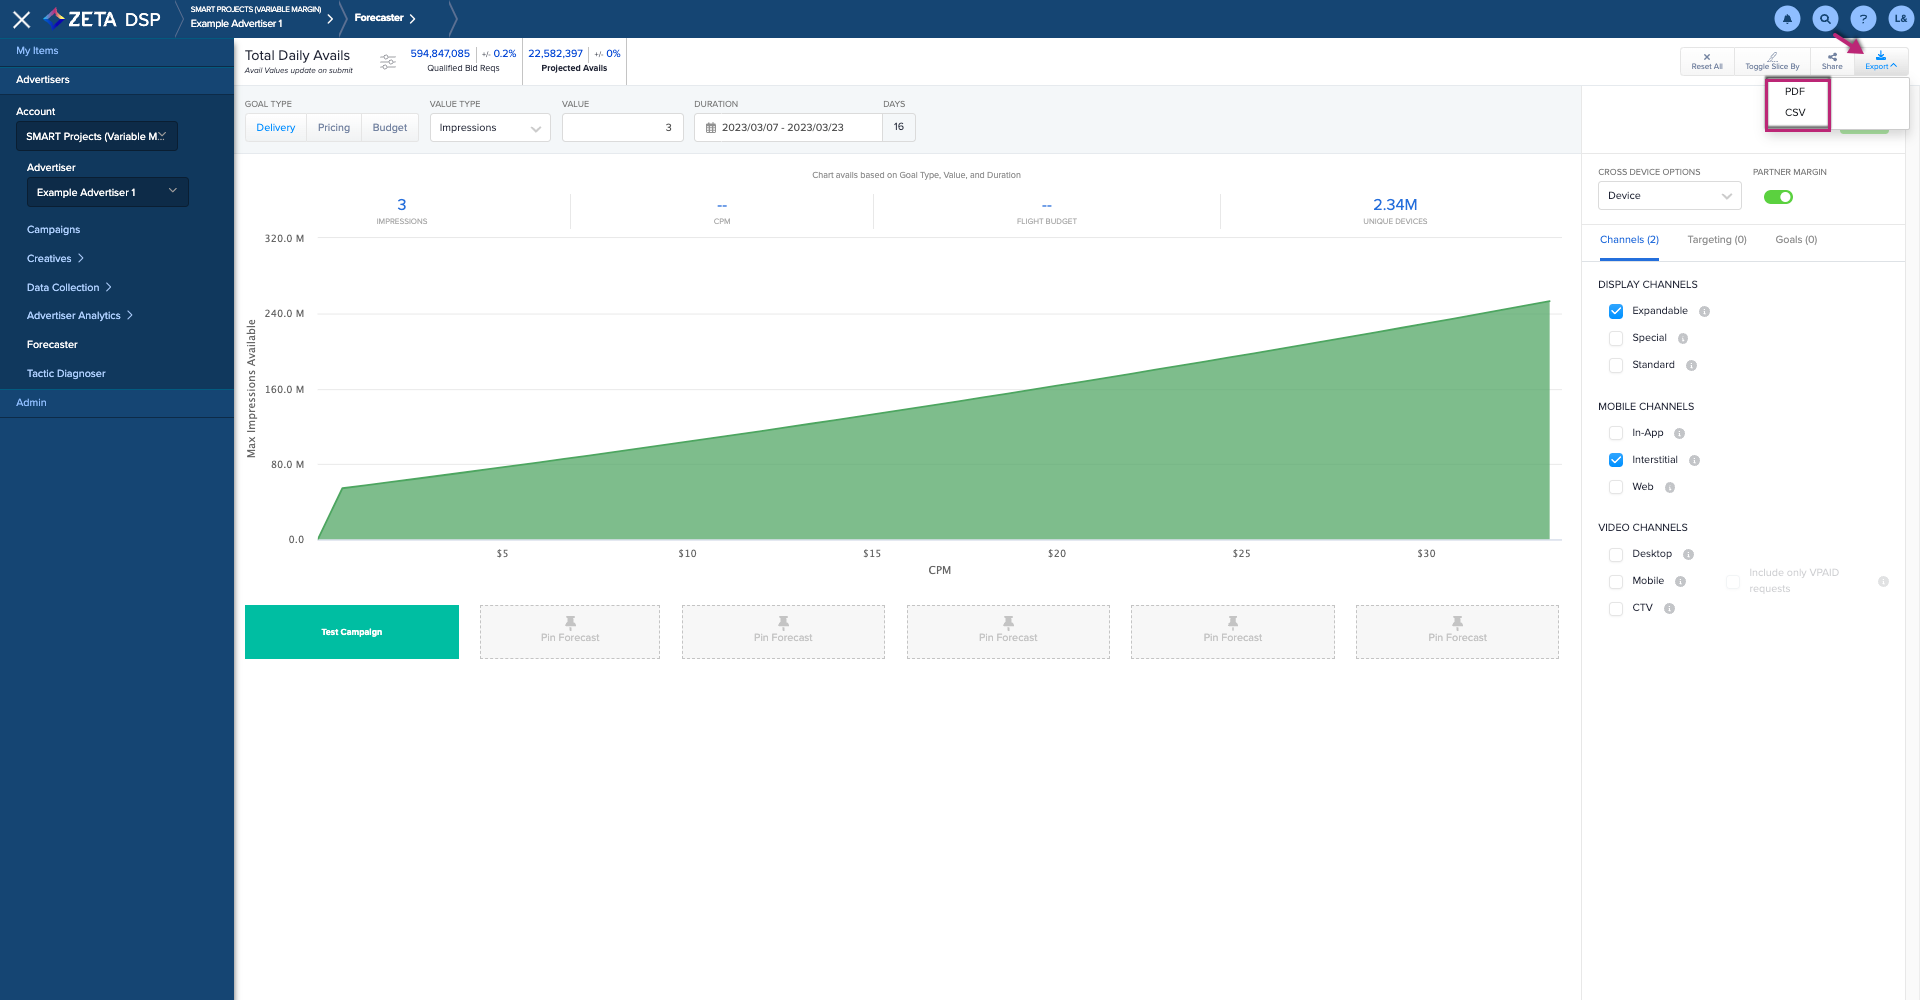
To export your forecast, click on Export to download a CSV or PDF version of your forecast.
The PDF option is only available for the main Forecaster page and not in the Toggle Slice By view.
-
The PDF export option includes Projected Avails, Channel, Targeting, and Goals data (if entered, otherwise these fields will be blank).
-
The CSV export option does not include Channel, Targeting, and Goals data.
Export both PDF and CSV files to get a complete picture of your forecast.