

Enabling decision-making and allowing users the opportunity to investigate and solve all kinds of identified issues, reporting has stood out as a turnkey solution since time immemorial. The process of reporting begins by compiling and reviewing the information within a specific functional area where performance is monitored and measured. Once the gathered information has been reviewed, conclusions are drawn and recommendations are made. The reports might end up explaining why an issue has occurred and eventually will recommend a course of action to fight the same.
On this front, the Zeta DSP has its very own Report Builder, which allows you to analyze data in our system. With the Report Builder, you will be able to slice the data in many different ways to accomplish various different goals and also navigate to the sliced data quickly and easily. Additionally, you can keep closer tabs on your DSP Campaigns, Advertisers, and Accounts. The DSP Report Builder also allows you to export reports and/or share them with partners directly from the platform.
Navigation
The Report Builder is available at the Account, Advertiser, and Campaign level(s) within the Zeta DSP.
Account Level
At the Account level, you can view data for all Advertisers on your Network or Account.
Click on the DSP logo in the upper left corner. Within the menu that appears for Advertisers and Admin, navigate to Admin > Account Analytics > Report Builder.
.gif?cb=ea0876def93e398a5423fea610fea011)
Advertiser Level
At the Advertiser level, you can view data for all campaigns for the selected Advertiser.
Click on the DSP logo in the upper left corner. Within the menu that appears for Advertisers and Admin, select the Account that contains your advertiser, and then select your Advertiser.
.gif?cb=f4b9f67d04fd32a381c405ac7a84459a)
-
The DSP shows all the Advertiser's campaigns. From the menu, select Advertiser Analytics > Report Builder.
Campaign Level
At the Campaign level, you can view data for all Line Items and Tactics assigned to a single Campaign:
1. Click on the DSP logo in the upper left corner. Within the menu that appears for Advertisers and Admin, select the Account that contains your advertiser, and then select your Advertiser.
.gif?cb=8cd6ee1a96579b7b1f6855f5c507a912)
-
The DSP shows all the advertiser's campaigns. Within the Campaign Grid, select a Campaign.
-
From the breadcrumb menu at the top of the screen, hover over to Manage Campaign and select Campaign Analytics.
-
From the same breadcrumb menu, select Report Builder.
View
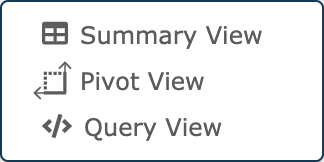
The Report Builder allows for three different ways to view data. To change the view, select the view button in the top toolbar and select a view type from the drop-down.
The three view types are:
|
Summary View |
This view displays data in the standard grid format. Users can search, filter, rearrange, resize, etc. columns per usual in this view. By default, the Report Builder will open on the Summary View. |
|---|---|
|
Pivot View |
This view displays data for the user to select, drag, and drop each metric and dimension into a pivot grid. Columns and rows can be rearranged and resized in this view. |
|
Query View |
This view helps you access the underlying queries behind your reports, unlocking a range of benefits that enhance data analysis, collaboration, and customization. |
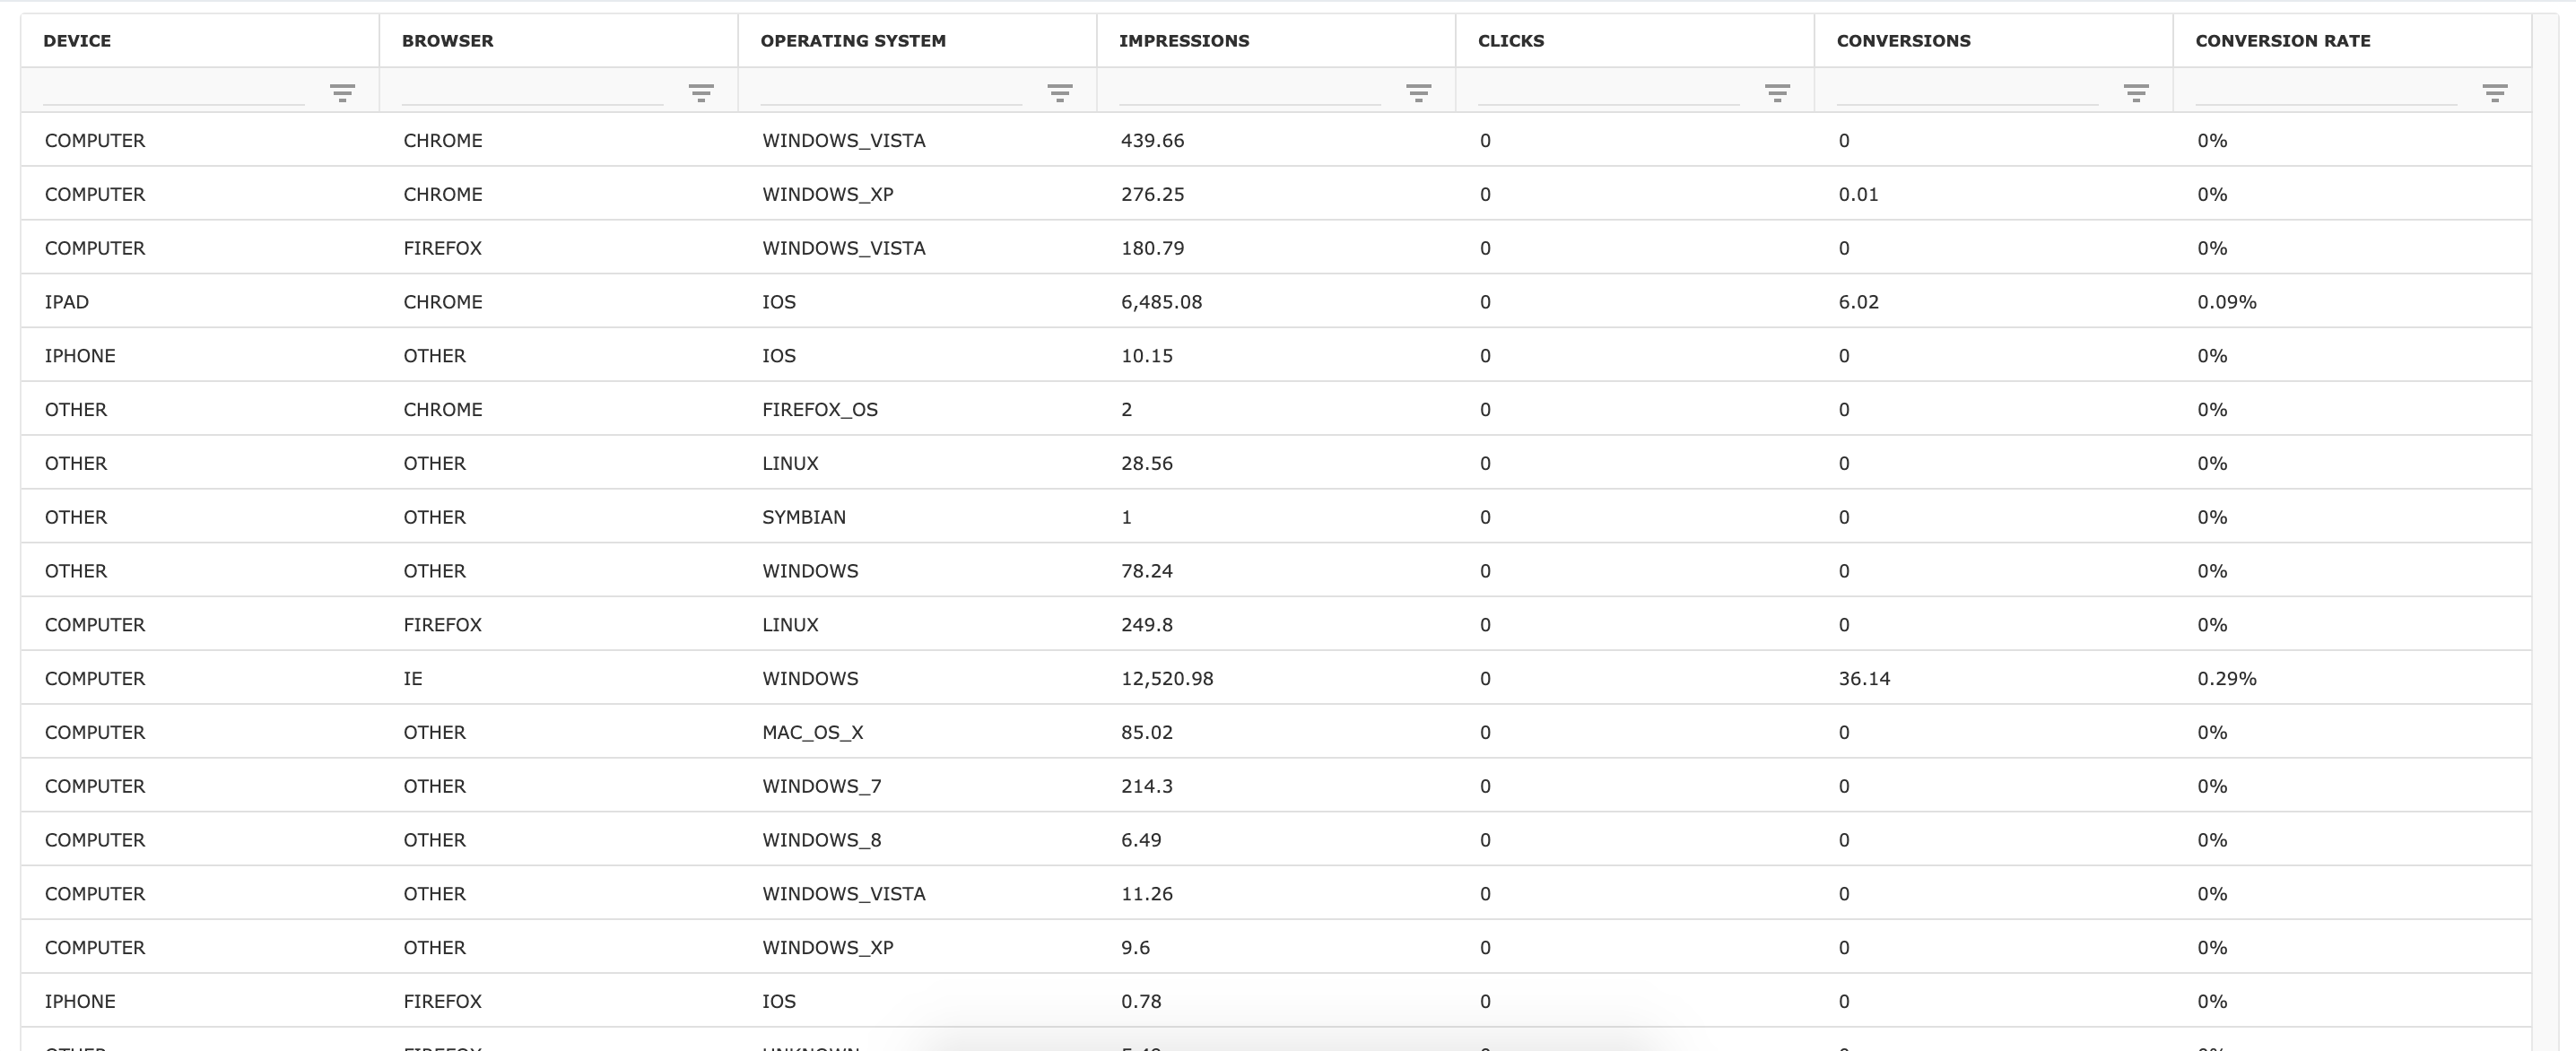
Summary View
Within Summary View, you can search, filter, rearrange, and resize columns.
Filter
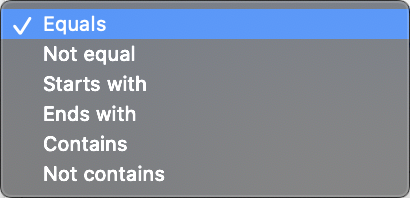
Filter columns by either typing in the search and filter box at the top of any column or by clicking on the symbol to the right of the search and filter box.
After clicking on the symbol, more robust filter options will appear. This is where you can select one of the following filter options:
Search
Search columns by typing in the search and filter box at the top of any column.
Apply Boolean logic to search and filter options (as shown above) to narrow results even further.
Rearrange
Change the order in which data is displayed by dragging and dropping the column headers.
Resize
Change the width of the column by dragging the sides of the column left or right.
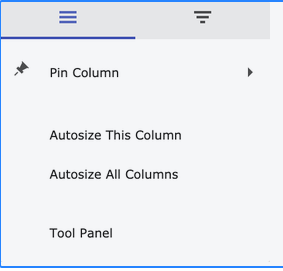
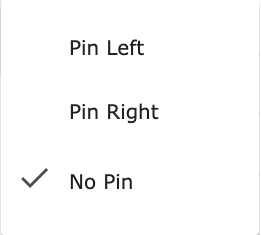
Pin & Autosize
You can also pin and autosize one or all columns by selecting the icon.
Pivot View
Within Pivot View a user can summarize large data sets and group data together in a meaningful way.
By default, Pivot View is blank with all selected metrics and dimensions in the right-side pivot panel. Start by selecting the metrics and dimensions you'd like to pivot or by dragging and dropping them into place in the right side pivot panel.
Select your metrics and dimensions first!
If you need to select a new metric or dimension in Report Options while in Pivot View, the pivot will reset.
Toggle Chart
The Report Builder allows for four different ways to view data in a chart within the Zeta DSP/DMP.
By default, the chart is not displayed. To view the chart, select Toggle Chart from the toolbar. Once the screen loads, adjust your Chart Settings and input a desired date range via the Date Selection tool.
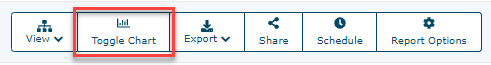
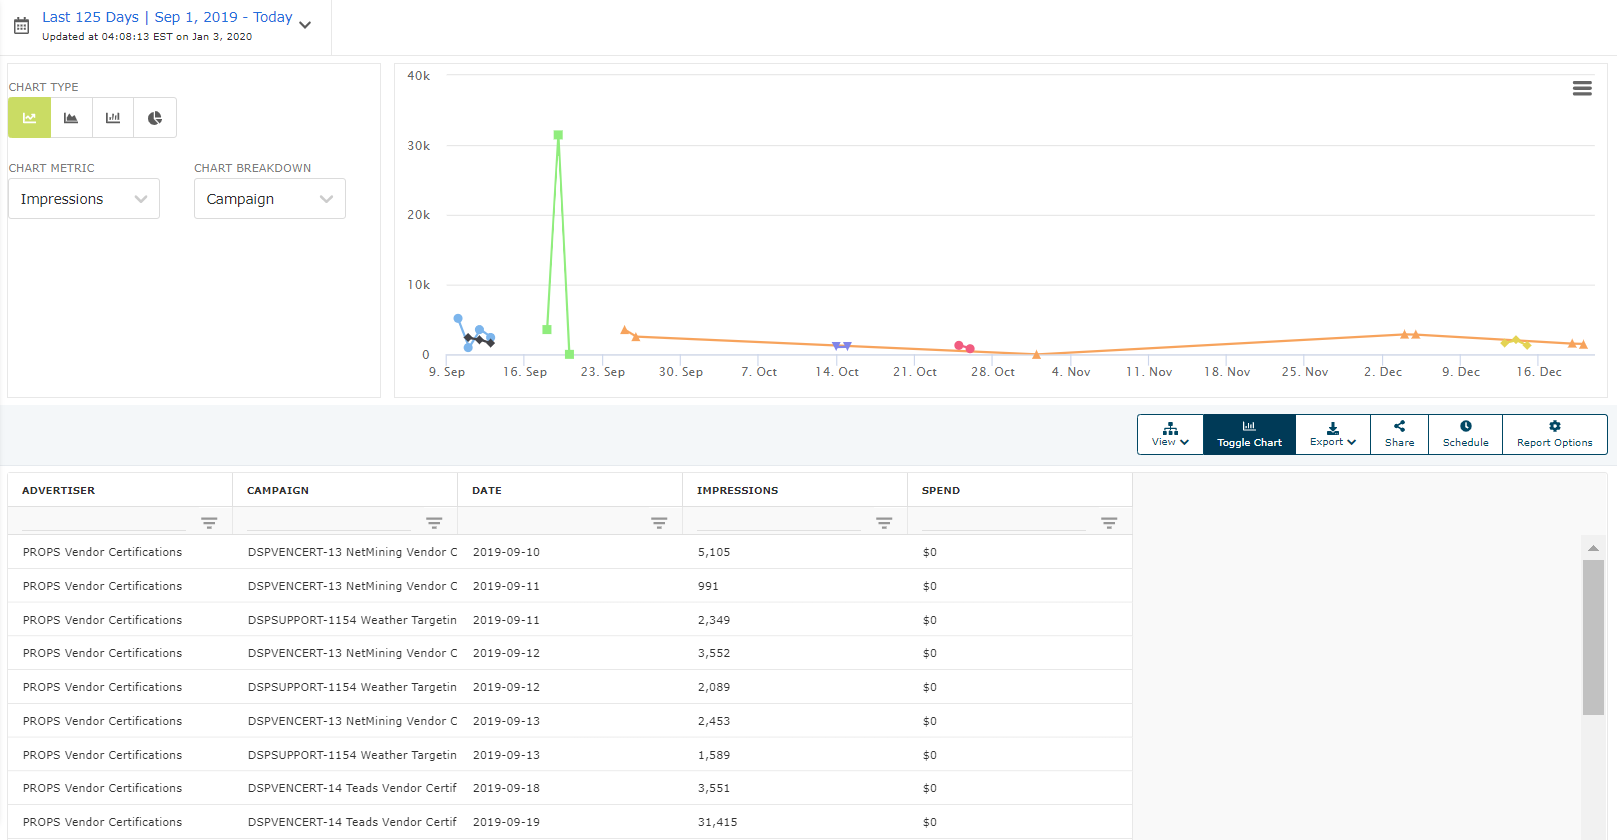
Chart Types
The four types of Charts available are:
|
Line Chart |
|
This chart type displays data as a series of data points connected by straight line segments.
|
|
|---|---|---|---|
|
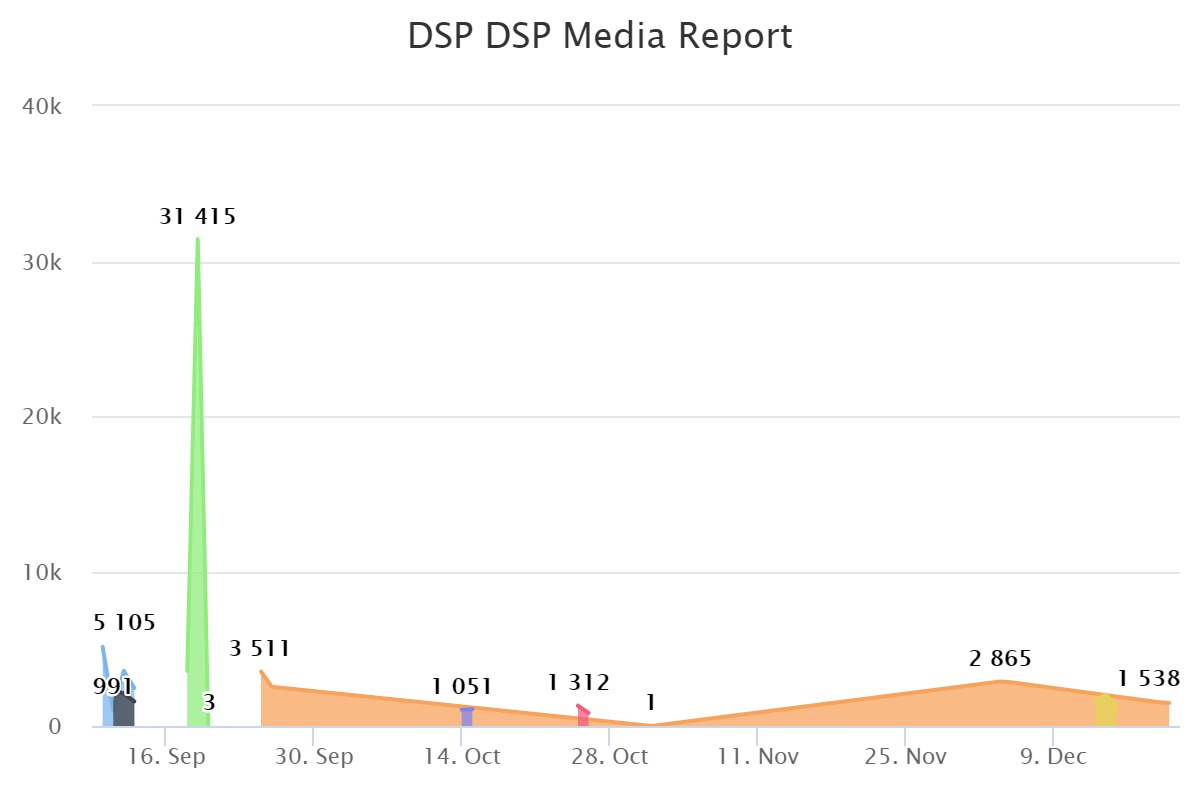
Area Chart |
|
This chart type displays graphically quantitative data. It is based on the line chart. The area between axis and line is emphasized by different colors.
|
|
|
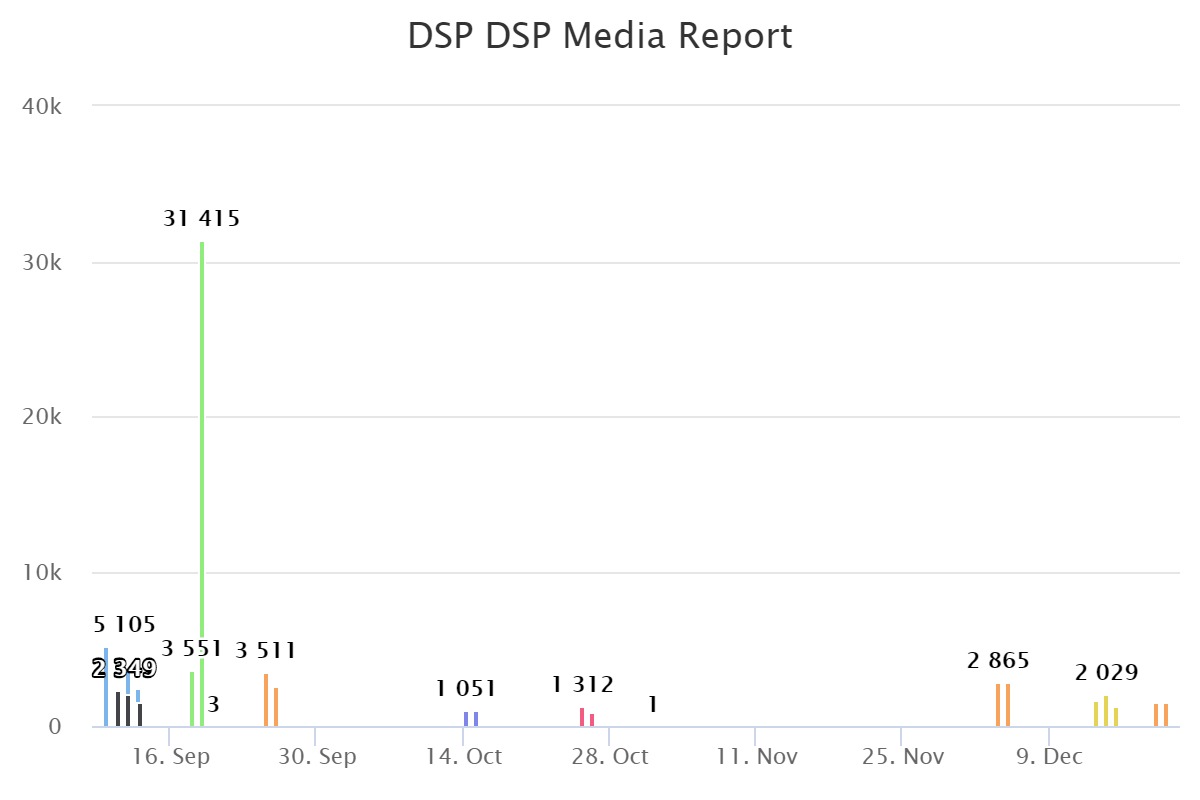
Bar Chart |
|
This chart type displays data categorically on rectangular bars with heights proportional to the values that they represent.
|
|
|
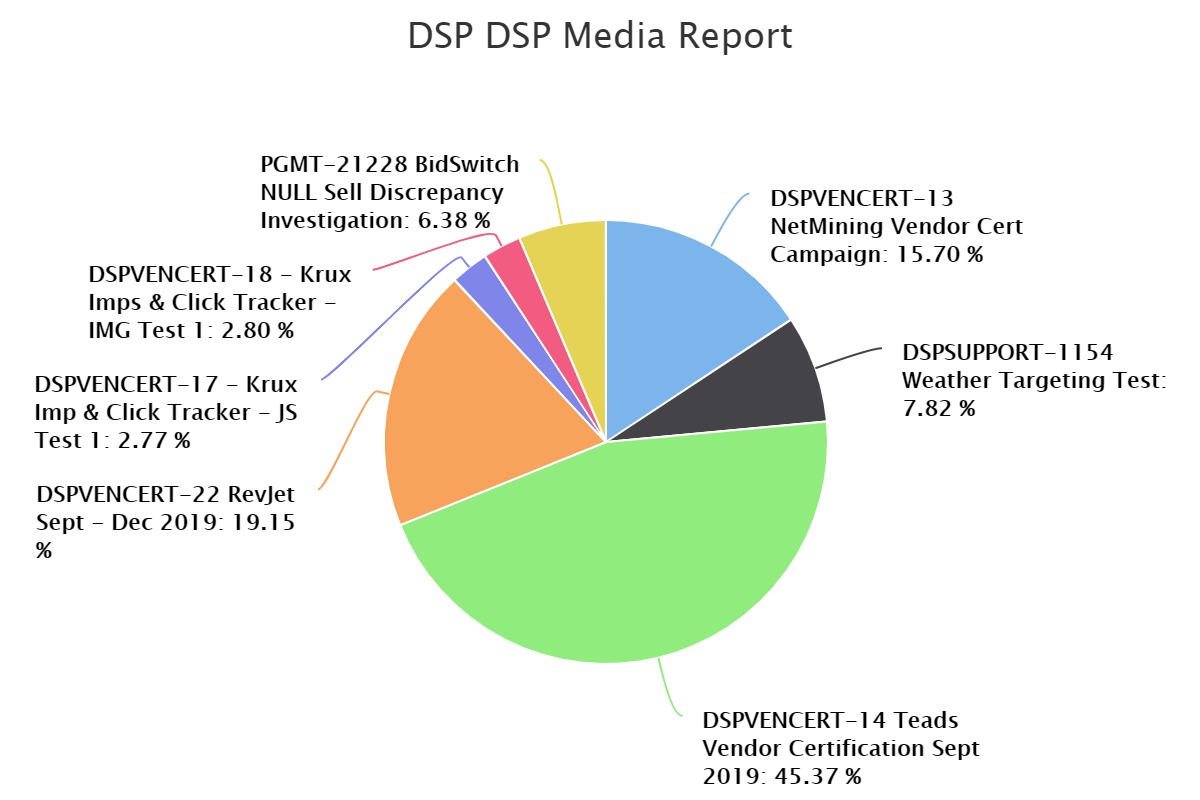
Pie Chart |
|
This chart type is divided into slices to illustrate numerical proportion. In a pie chart, the arc length of each slice, is proportional to the quantity it represents.
|
|
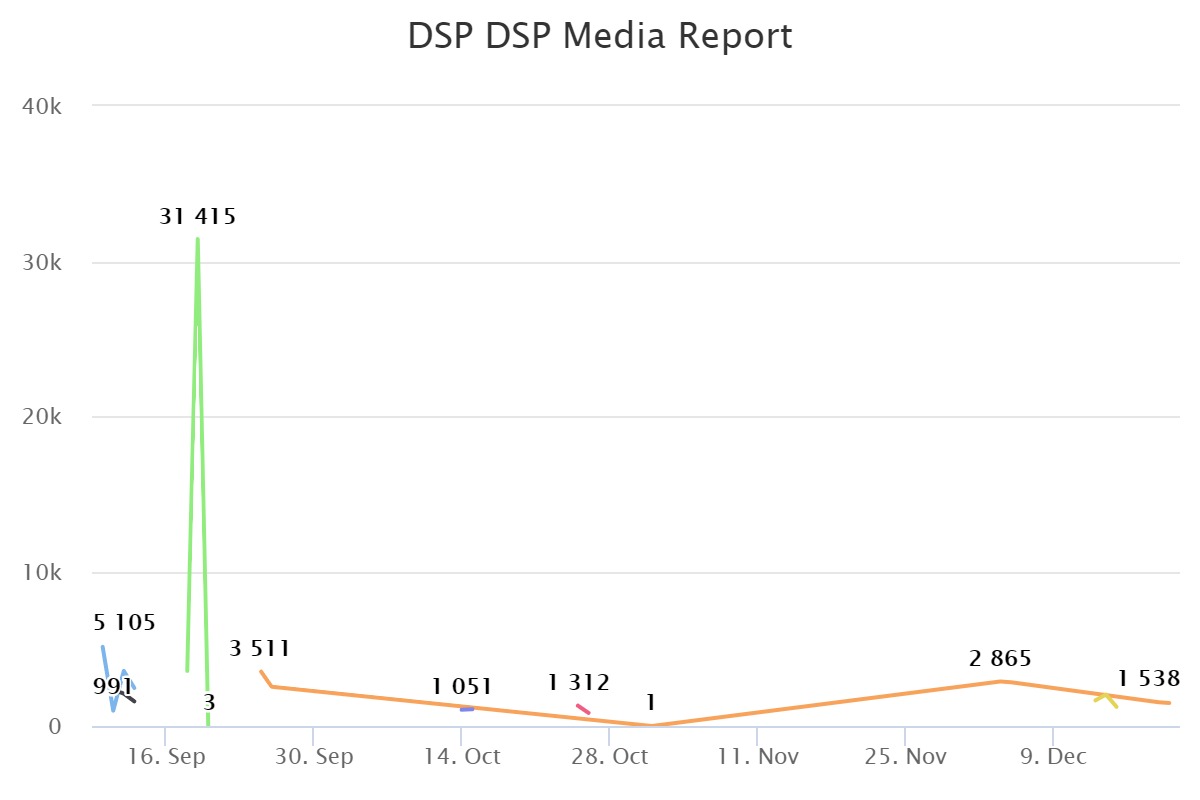
Export
To export any of the charts, select the icon located in the top-right corner of the chart. The chart export options include:
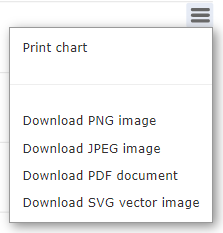
Zoom
To zoom into a particular data set, simply click and drag your cursor across an area in which you'd like to take a closer look. To reset after zooming in, click 
Hover
To view more information on a single data point, hover over to view.
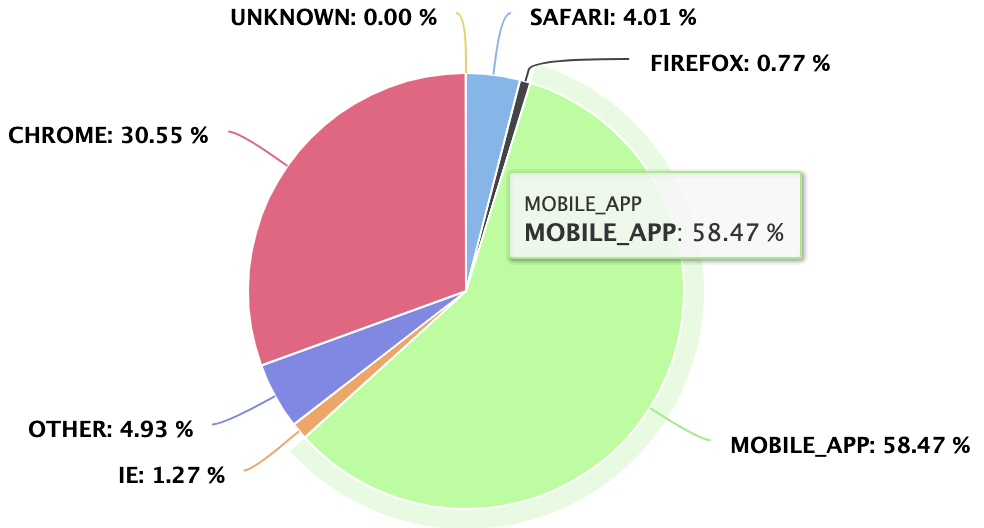
Chart Settings
To open the Chart Settings pane, click Open Settings. To close the Chart Settings pane, click Close Settings.
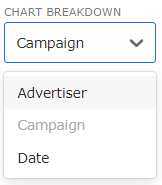
To customize the Chart Breakdown, select from the drop-down. The drop-down is populated based on the selections made in Report Options.
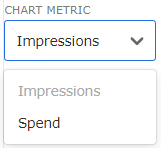
To customize the Chart Metric, select from the drop-down. The drop-down is populated based on the selections made in Report Options.
Export Your Report
To export the grid, click the Export icon located in the toolbar in the upper right-hand corner and select the file type from the drop-down.
The grid export options are:
-
CSV
-
XLSX
Share Your Report
-
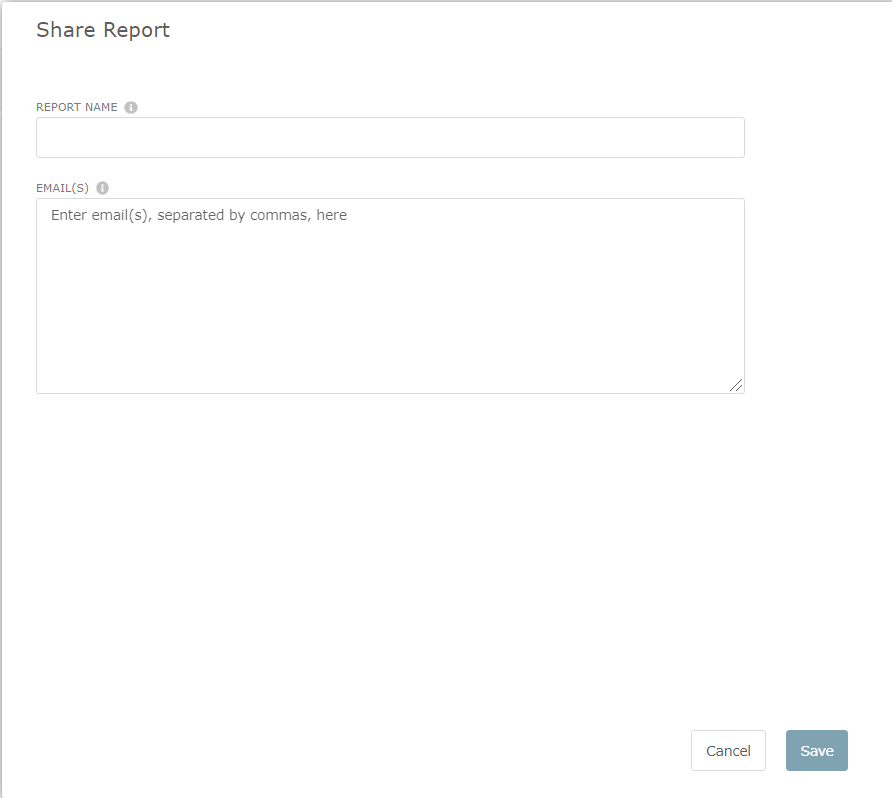
To share a report, click the Share icon located in the toolbar in the upper right-hand corner.
2. Input the required fields for Report Name and Email(s). Click Save when complete.
Sharing is caring!
If you plan to share this report with multiple recipients, the email addresses must be separated by commas and/or semicolons.
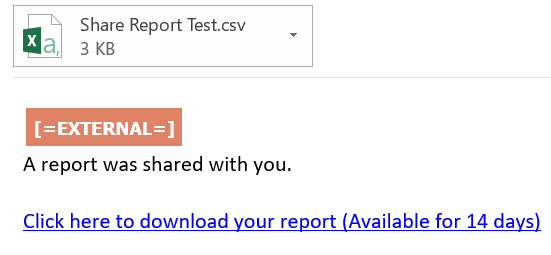
3. The report will be sent to the intended recipients. The message will include a link, in which users can download the report (as a CSV file) within 14 days of being received.
Schedule Your Report
The Schedule option gives users the ability to have reports sent to themselves (via email or S3) and/or other account stakeholders on a regular cadence over a designated period of time.
Users have 2 designated ways to schedule reports:
-
Email
-
S3
-
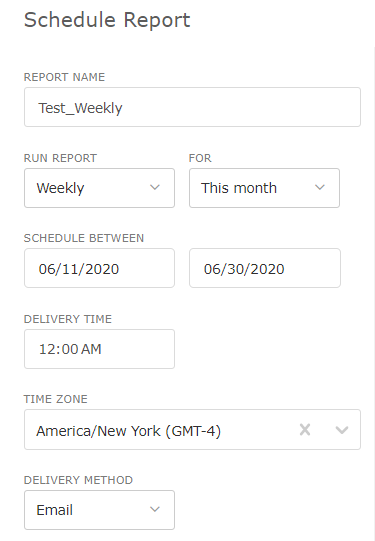
To schedule a report, click the Schedule icon located in the toolbar in the upper right-hand corner.
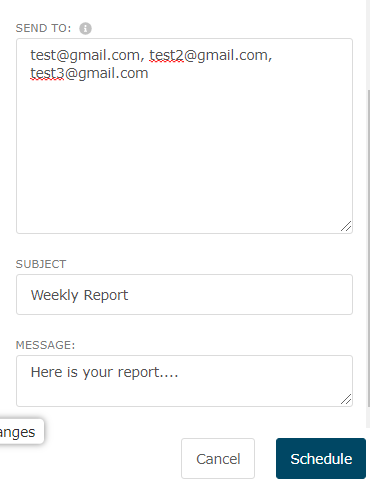
2. The schedule blade will appear. Input the required fields accordingly to the delivery method:
Email Delivery Example Below:
S3 Delivery Ex. Below:
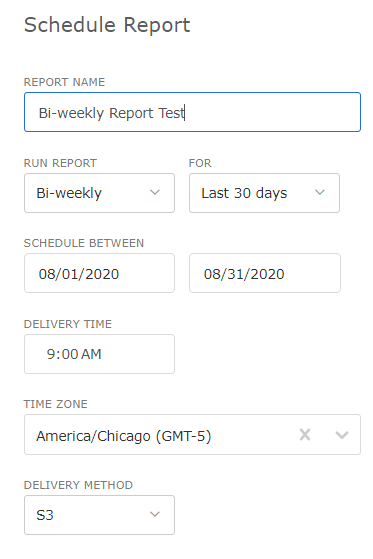
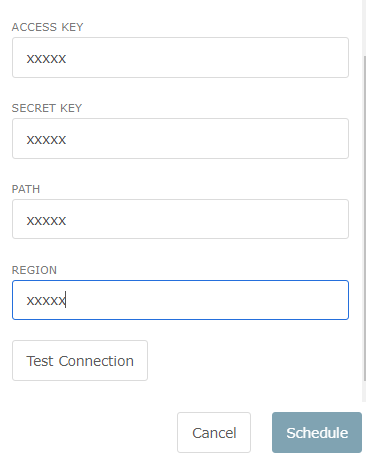
3. Click Schedule to schedule your report or Cancel if you change your mind. Once your report is scheduled, the recipients you added in the Schedule modal will receive a CSV file of the report via email at the selected cadence until the selected end date.
Note - When you select S3 as an option as a delivery method, a successful test of an S3 connection is required before allowing the user to proceed with scheduling - this can be done by clicking “Test Connection” after filling out the necessary criteria
Schedule Blade Fields
|
Report Name |
Provide a name for your report. |
|---|---|
|
Run Report |
Select the Cadence at which you want to receive your report via email. |
|
For |
Select the Dynamic Date Range to be reported on each time the report runs. |
|
Schedule Between |
Select the Date Range that your report will be scheduled for. |
|
Delivery Time |
User can select the time the reports are delivered |
|
Time Zone |
User can select the time zone for delivery |
|
Delivery Method
|
Email - Allows users to send Report via Email
|
|
S3 - Allow users to enter in an Amazon S3 cloud location details where the scheduled report can be delivered
|
Users can Edit a Scheduled report by clicking in the (…) Menu, Click Edit, Make the necessary changes, and click Schedule to save.
A visual with workflow is below:
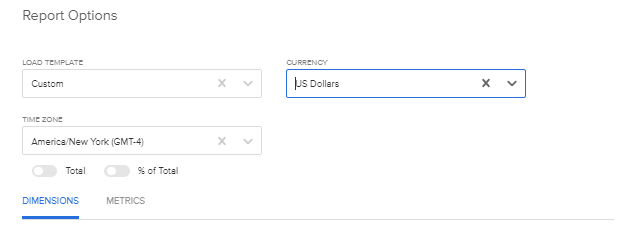
Report Options
Within the Report Options blade, there are five key components to refine: Load Template, Currency, Time Zone, Dimensions, and Metrics.
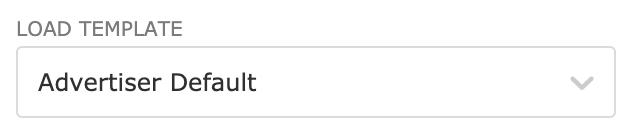
Templates
The Report Builder supports templates for all three Product Types. Templates enable users to bypass the initial setup and configuration time necessary to create standardized or frequently used reports. Click Load Template to load any of the other templates available in that level of the Report Builder.
The Zeta Templates that are available for selection within the Report Options are as follows:
|
Template Name |
Level |
Description |
|---|---|---|
|
Custom |
All Levels |
This is a custom template. The graph and grid will show the metrics and dimensions that have been applied. |
|
Daily Delivery: Line Item |
All Levels |
The data grid displays Impressions, Spend, Clicks, CTR, CPC, Conversions, CPA, Client Revenue, and ROAS broken out by date. |
|
Daily Deliver: Impressions |
All Levels |
The data grid displays Impressions, Spend, Clicks, CTR, CPC, Conversions, CPA, Client Revenue, and ROAS broken out by date. |
|
Daily Delivery: Ads |
All Levels |
The data grid displays Impressions, Spend, Clicks, CTR, CPC, Conversions, CPA, Client Revenue, and ROAS broken out by date. |
|
Monthly Delivery: Impressions |
All Levels |
The data grid displays Impressions, Spend, Clicks, CTR, CPC, DSP Click Conversions, CPA, Client Revenue, and ROAS broken out by date. |
|
Account Default |
Account |
The data grid displays Impressions and Spend out by Date, Advertiser Name, Advertiser ID, Campaign Name, Campaign ID, Subnetwork, and Subnetwork ID. This is the default view for Report Builder at the account-level. |
|
Advertiser Default |
Advertiser |
The data grid displays Impressions and Spend out by Date, Campaign Name, and Campaign ID. This is the default view for Report Builder at the advertiser-level. |
|
Campaign Default |
Campaign |
The data grid displays Impressions and Spend out by Date, Line Item Name, and Line Item ID. This is the default view for Report Builder at the campaign-level. |
Currency
The Report Builder supports 20 currency types for DSP Media. Currently, USD is the only currency option for Partner Media and Site Optimization.
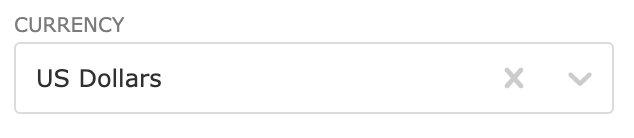
The DSP converts to using the currency type you select after you click Apply. Currency options are:
-
Australian Dollar
-
Brazilian Real
-
British Pounds
-
Canadian Dollars
-
Chinese Yuan
-
Danish Kroner
-
Euros
-
Hungarian Forint
-
Indian Rupee
-
Japanese Yen
-
New Zealand Dollar
-
Norwegian Krone
-
Polish Zloty
-
Russian Ruble
-
Singapore Dollar
-
South African Rand
-
Swedish Krona
-
Swiss Franc
-
Turkish Lira
-
US Dollar
Exchange Rates
The DSP maintains a database of daily currency exchange rates and uses this information to display past currency quantities using the rate that applied on the date the activity occurred. However, invoices are based on monthly averages so you may see some variation in totals.
Dimensions
Dimensions are attributes of your data. For example, the dimension Browser indicates the browser in which the Ad was served, for example, "Chrome" or "Firefox", on which an ad was served.
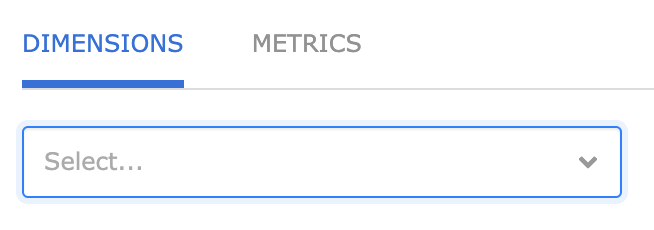
Use the dimensions multi-select drop-down list to add dimensions to your report. Simply begin typing to view a list of dimensions.
To remove a dimension, click the X in the dimensions multi-select dropdown.
It is required that you select and apply at least one dimension.
To view the full list of metrics and dimensions available in the Report Builder, refer to the Metrics & Dimensions Dictionary.
Metrics
Metrics are quantitative measurements. The metric Clicks is the number of clicks on ads delivered.
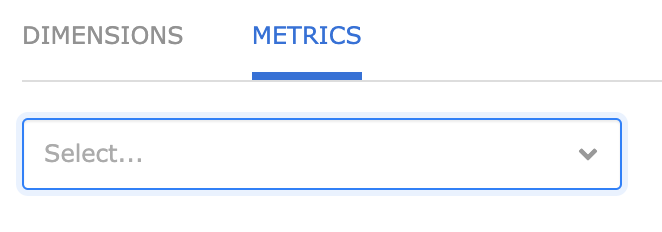
Use the metrics multi-select drop-down list to add metrics to your report. Scroll to see all dimensions available or simply begin typing to view a list of metrics.
To remove a metric, click the X in the metrics multi-select dropdown.
It is required that you select and apply at least one metric.
To view the full list of metrics and dimensions available in the Report Builder, refer to the Metrics & Dimensions Dictionary.
Apply
Once you've made all of your selections, click Apply. This will close Report Options and apply your selection to view in the Report Builder.
If you'd like to begin again, click Reset to reset to the last applied settings.
To close the Report Options without applying any changes, click Cancel.

Date Selection
The Report Builder's date selection tool is located in the top left corner of the page. The default date selections are noted in the Templates section.
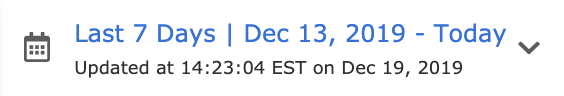
Click anywhere in the date selection tool to expand the calendar:
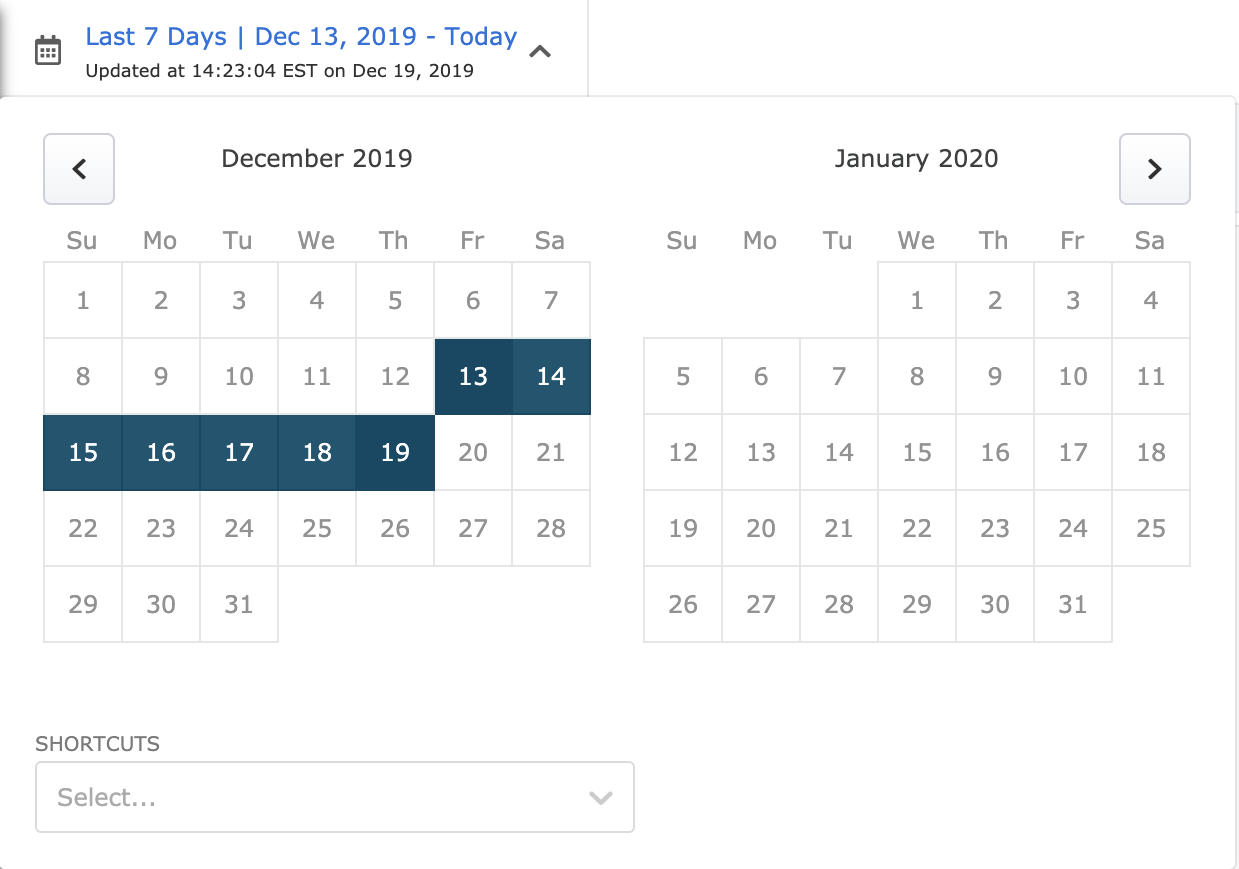
There are three types of date selection in the Report Builder:
|
Custom Date Range |
The numerical dates that represent a specific date(s) in time with a particular start and finish date and all dates in between. A Custom Date Range can be either one day or a range of days with a specific start and end date. For example, one day: 08/10/2018 or date range: 12/3/2018 - 12/11/2018. |
|---|---|
|
Cadence |
Cadence represents the frequency at which a user would like to receive their report and is only used in the Schedule feature. Cadence options are Daily, Weekly, Bi-weekly, Monthly, and Quarterly. |
|
Dynamic Date Range |
Non-date specific time periods. For example, "Last Month" and "Last 3 days." In the date selection tool on the main page (shown above), Dynamic Date Ranges can be found in the Shortcuts dropdown. Dynamic Date Ranges are listed with examples in the table below. |
There are 19 Dynamic Date Ranges options. Those marked with an * are only available for the DSP Media Product Type. Those marked with ** are only available for Partner Media and Site Optimization Product Types. The full list of Dynamic Date Ranges is as follows:
|
Dynamic Date Ranges |
Definition |
For example, if I build a report on Tuesday, January 22nd, 2019, when I select a Dynamic Date Range, these are the dates I will get in my report: |
|---|---|---|
|
Today* |
Data available for today, the day the report is built. |
1/22/2019 |
|
Yesterday |
The day before the day the report is built. |
1/21/2019 |
|
Last week** |
All days in previous Monday - Sunday week, not counting the Monday - Sunday that the current day falls within. |
1/14 - 20/2019 |
|
Last 2 days* |
Last 2 days, not including the current day. |
1/20 - 21/2019 |
|
Last 3 days* |
Last 3 days, not including the current day. |
1/19 - 21/2019 |
|
Last 4 days* |
Last 4 days, not including the current day. |
1/18 - 21/2019 |
|
Last 5 days* |
Last 5 days, not including the current day. |
1/17 - 21/2019 |
|
Last 7 days |
Last 7 days, not including the current day. |
1/15 - 21/2019 |
|
Last 14 days* |
Last 14 days, not including the current day. |
1/8 - 21/2019 |
|
Last 28 days* |
Last 28 days, not including the current day. |
12/25/2018 - 1/21/2019 |
|
This month |
All days in the current month, not including the current day. |
1/1 - 22/2019 |
|
Last 30 days** |
Last 30 days, not including the current day. |
12/23/2018 - 1/21/2019 |
|
Last month |
All days in the previous month. |
12/1 - 31/2018 |
|
Last 2 months* |
Last 2 months, not including the current month. |
11/1/2018 - 12/31/2018 |
|
Last 3 months* |
Last 3 months, not including the current month. |
10/1/2018 - 12/31/2018 |
|
Last 6 months* |
Last 6 months, not including the current month. |
7/1/2018 - 12/31/2018 |
|
Week to date** |
All days in the current week, not including the current day. Weeks are defined as Monday - Sunday. |
1/20 - 21/2019 |
|
Quarter to date** |
All days in the current quarter, not including the current day. |
1/1 - 22/2019 |
|
Year to date |
All days since the same day in the previous year, not including the current day. |
1/22/2018 - 1/21/2019 |
Some more clarifications on Date Selection in the Report Builder:
To Schedule a report, you must include a Dynamic Date Range that runs over the course of a Custom Date Range.
To save a report, you must have a Custom Date Range, but cannot include a Dynamic Date Range.
Campaign Lifetime is considered a Custom Date Range.
Where do I pick dates?
Date Selection options are available in several areas of the Report Builder: top left-hand of the main page, Schedule, and Save features.
FAQs
|
Question |
Answer |
|---|---|
|
How often is my data refreshed? |
The ETL for DSP Media data runs hourly. If you need data from within the last hour, you must return to the Report Builder after an hour. The ETL for Partner Media and Site Optimization runs nightly. If you need data from within the last day, you must return to the Report Builder the next day. |
|
Where can I review metrics and dimensions definitions? |
You can review all metrics and dimension definitions is the Metrics & Dimensions Dictionary. |
|
What happened to metric sets? |
Metric Sets were useful and popular groupings of Metrics that allowed users to get a quick picture of your campaigns from a particular standpoint. Metric Sets were replaced by Templates in the Report Builder. |
|
What does RF mean in my report? |
RF abbreviates Zeta and indicates the metric includes only Zeta-specific data. |
|
Can I share my scheduled report, saved template, or saved report? |
Yes, you can share each via email using the share feature. Your scheduled reports, saved templates, and saved reports are available in the UI to you alone |
|
How long is data stored for? |
Zeta's data retention policies are set based on the data types available in each analytics tool. For example, aggregated data is kept for 3 years and hourly data is stored for 60 days. |
|
What are the rounding rules in the Report Builder? |
The Report Builder will round all values to the 2nd decimal if the value is > 1 and 4th decimal or first not zero if the value is < 1. All actual values can be seen in the export of the report. |
|
How can I sort my Data? |
Users can sort the following columns:
|