

The Campaign Troubleshooting screen ties together a variety of campaign-level metrics to provide a single, concise analysis of your campaign's performance to date.
-
Check this screen often during the early days of your campaign.
-
Once it is performing well, check this screen once per week to ensure that your campaign is operating correctly.
Opening the Troubleshooting Report
1. Click on the DSP logo in the upper left corner. Within the menu that appears for Advertisers and Admin, select your desired account and advertiser.
2. As the DSP displays all of the advertiser's campaigns, click on the Campaign you would like to view from the list.
.gif?cb=371a7eacb920ee4f9988f642d1974500)
3. Click on Manage > Troubleshooting to display the report.
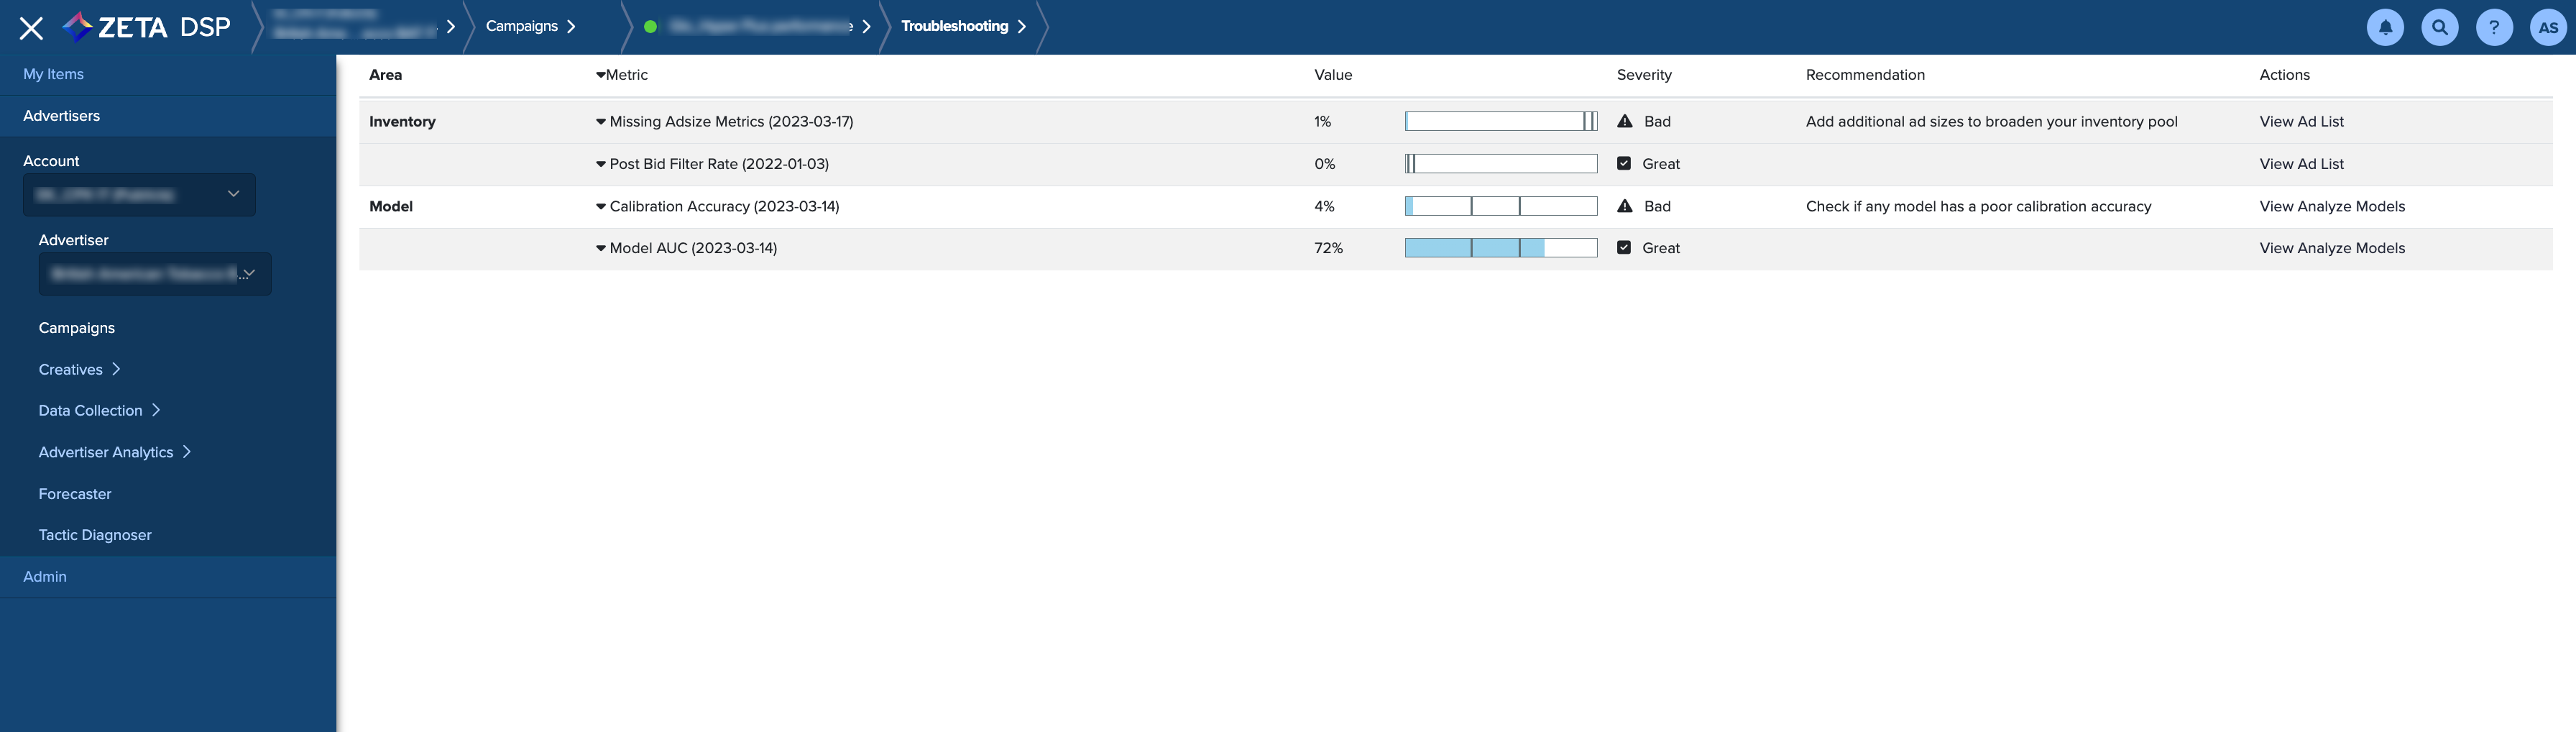
Report Details
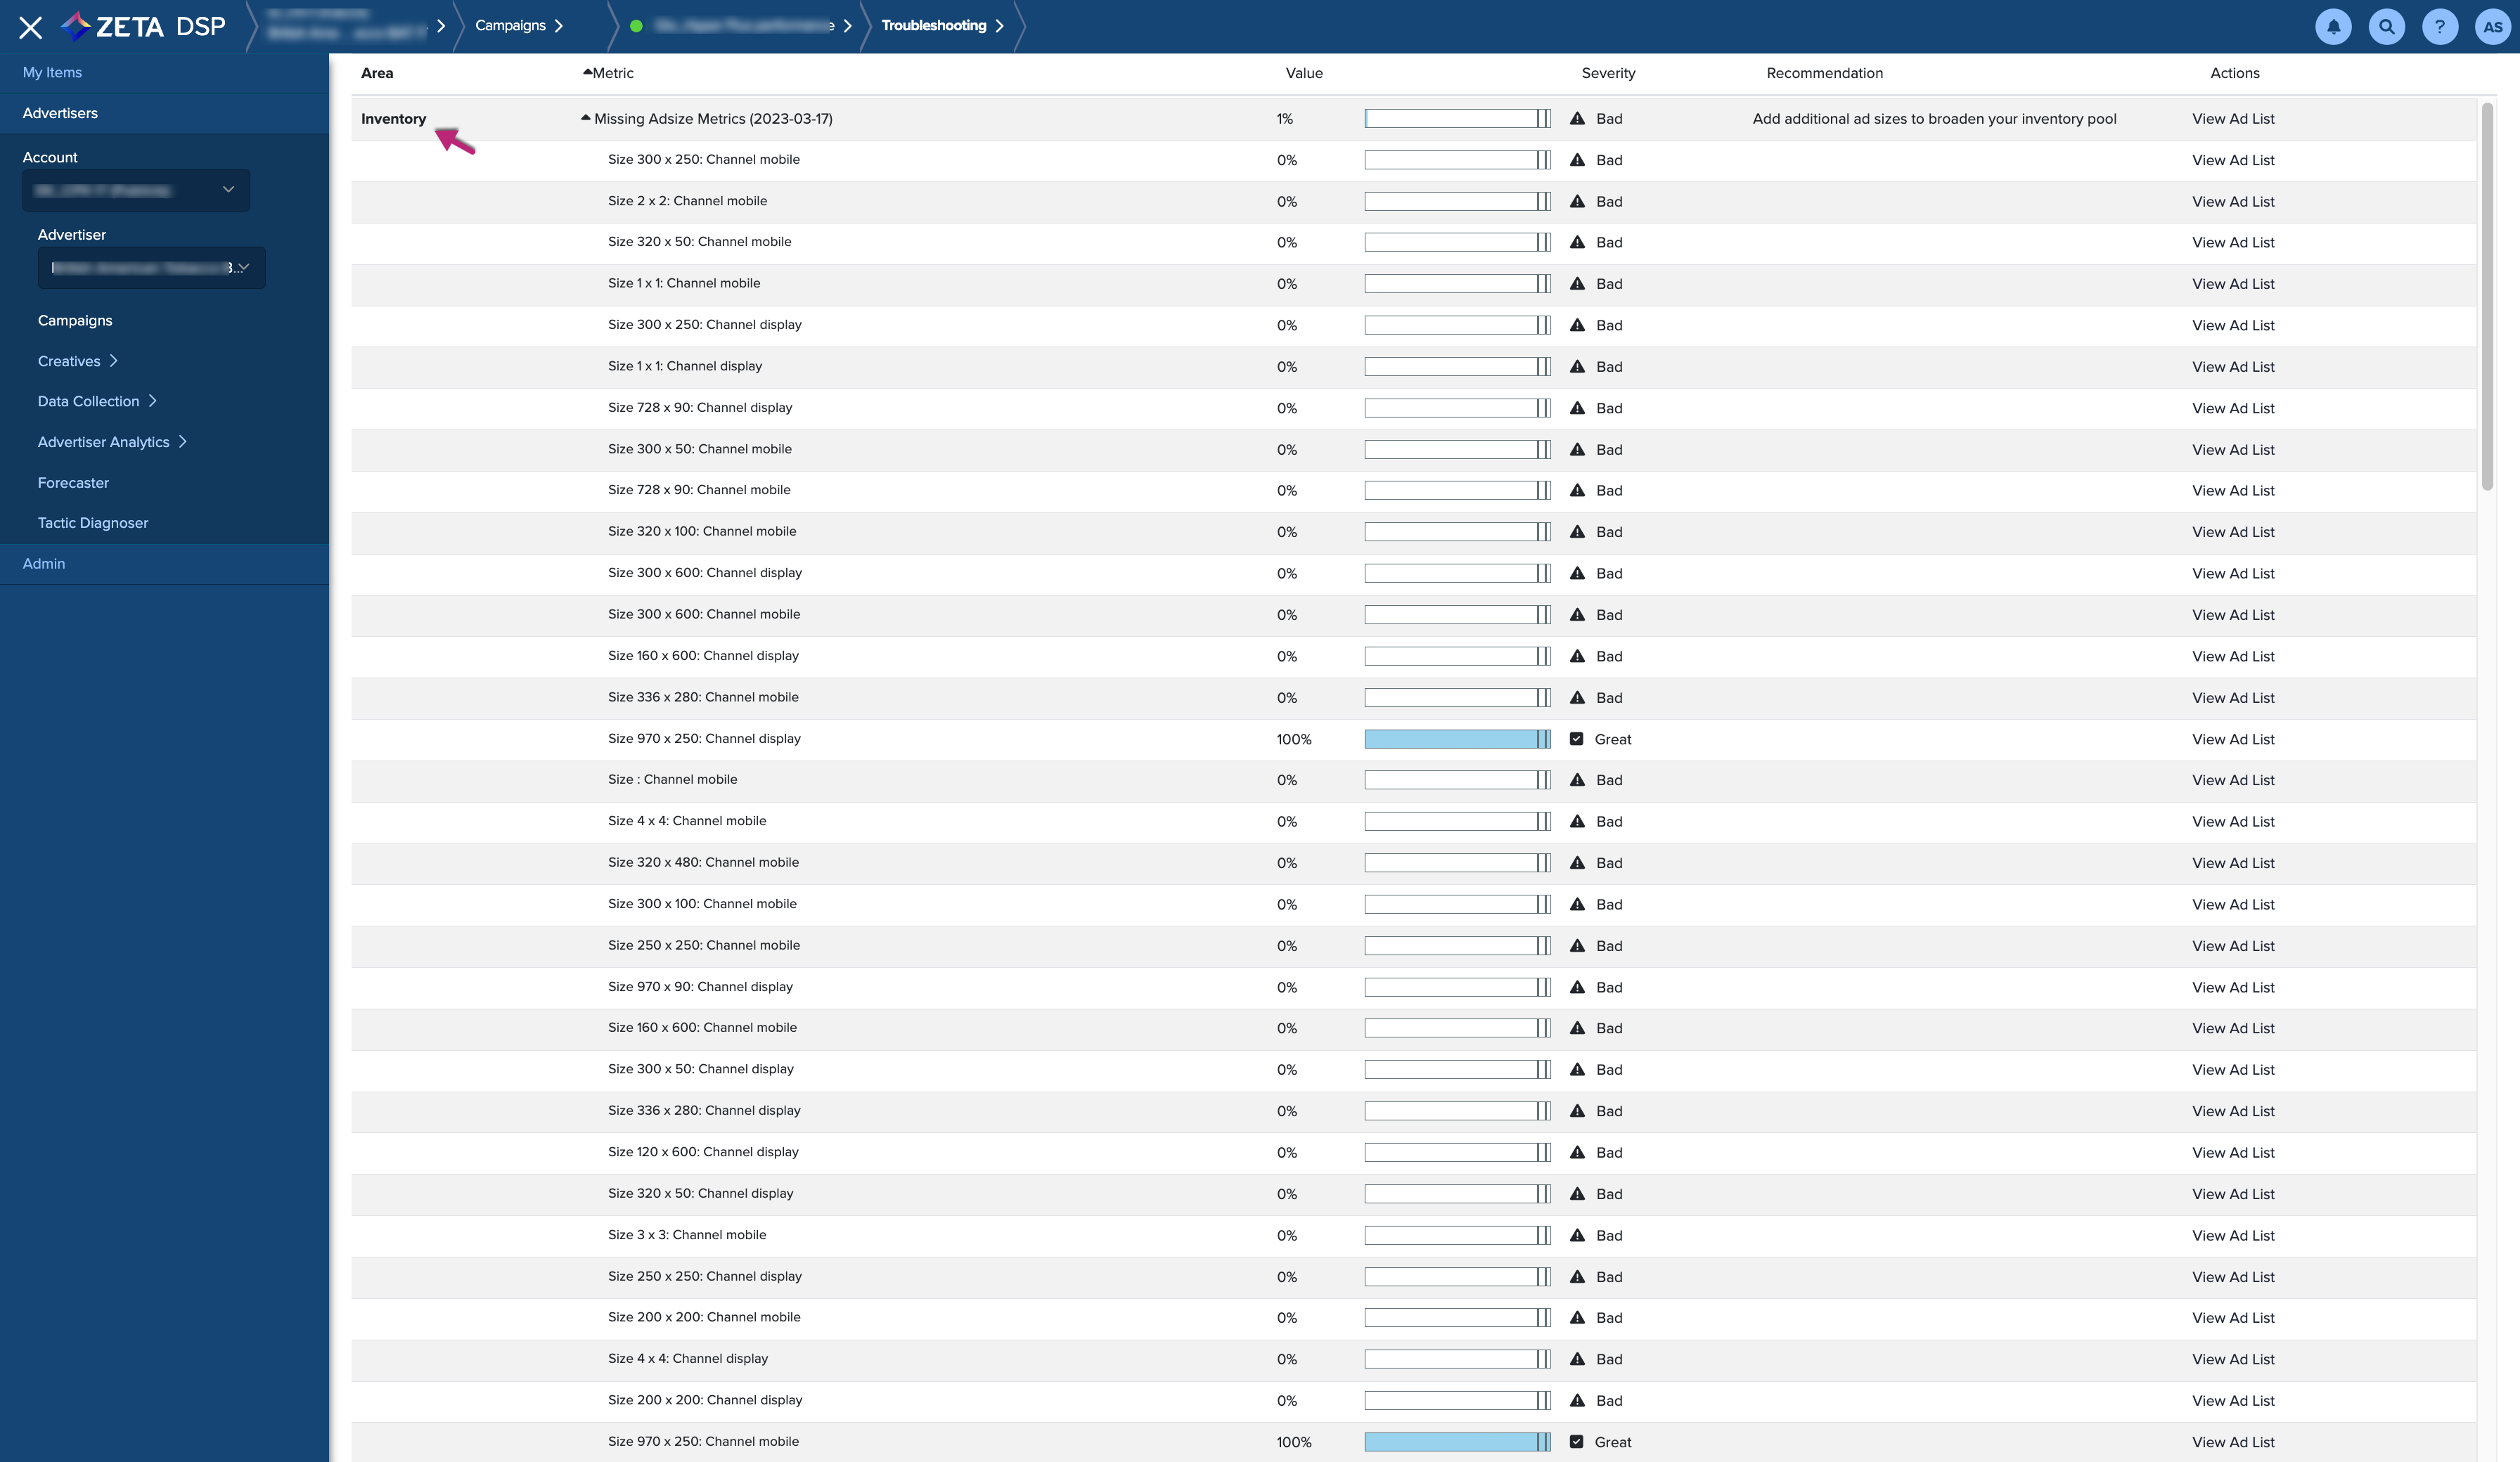
A quick way to obtain more detail on a particular category is to click on the Area Name:
Area Metrics
|
Area |
Description |
|---|---|
|
Inventory |
The Inventory category covers all troubleshooting metrics related to Ads and Ad delivery. |
|
Ad Rejection Block Rate |
Measures the extent to which the campaign's ability to bid on Ad placement opportunities is hampered by Ads that one or more exchanges have rejected. If you have problems in this area, identify the failing Ads, fix or replace them and get them approved. |
|
Missing Ad size Metrics |
Measures the extent to which the campaign's ability to bid on Ad placement opportunities is hampered by not having Ads in one or more particular sizes. If you have problems in this area, identify the missing sizes, provide Ads for them and get the new Ads approved.
|
|
Post Bid Filter Rate |
Measures the extent to which the campaign's ability to bid on Ad placement opportunities is hampered by Ads that one or more exchanges have later disqualified. If you have problems in this area, identify the failing Ads, fix or replace them, and get them approved. Note that this category only appears once the campaign has begun to deliver. |
|
Data Quality |
The Data Quality category reports the condition of data gathered by Pixels on the advertiser's site. |
|
Competitor Loss Percentage |
Describes the performance of the Pixels on the advertiser's site as compared to other company Pixels on the site. If other company Pixels are on more pages than DSP Pixels this constitutes an unfair advantage that should be rectified by also placing the DSP Pixels on these pages. |
|
JavaScript Pixel Coverage |
Measures data received by JavaScript Pixels. If this area is labeled as a problem, use the Web Crawlers screen to generate JavaScript Pixels and have the resulting code installed on the appropriate pages of the advertiser's site. |
|
DSP Pixel Coverage |
Measures data received by DSP-create Pixels in general. If this area is labeled as a problem, use the Web Crawlers screen to generate DSP Pixels and have the resulting code installed on the appropriate pages of the advertiser's site. |
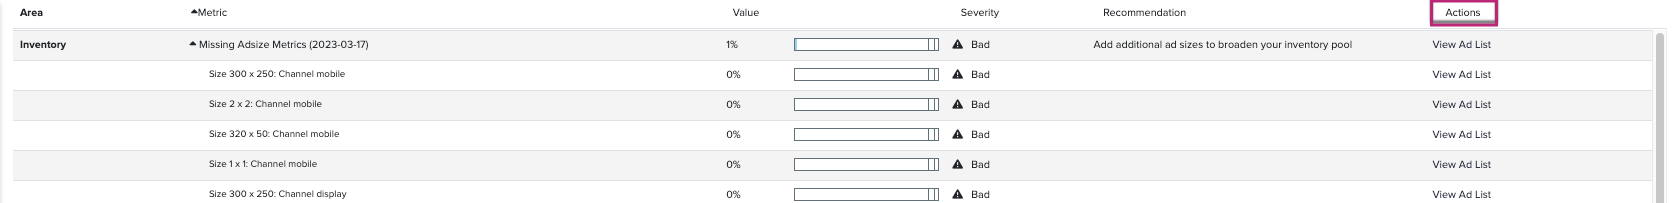
Using the Troubleshooting Report
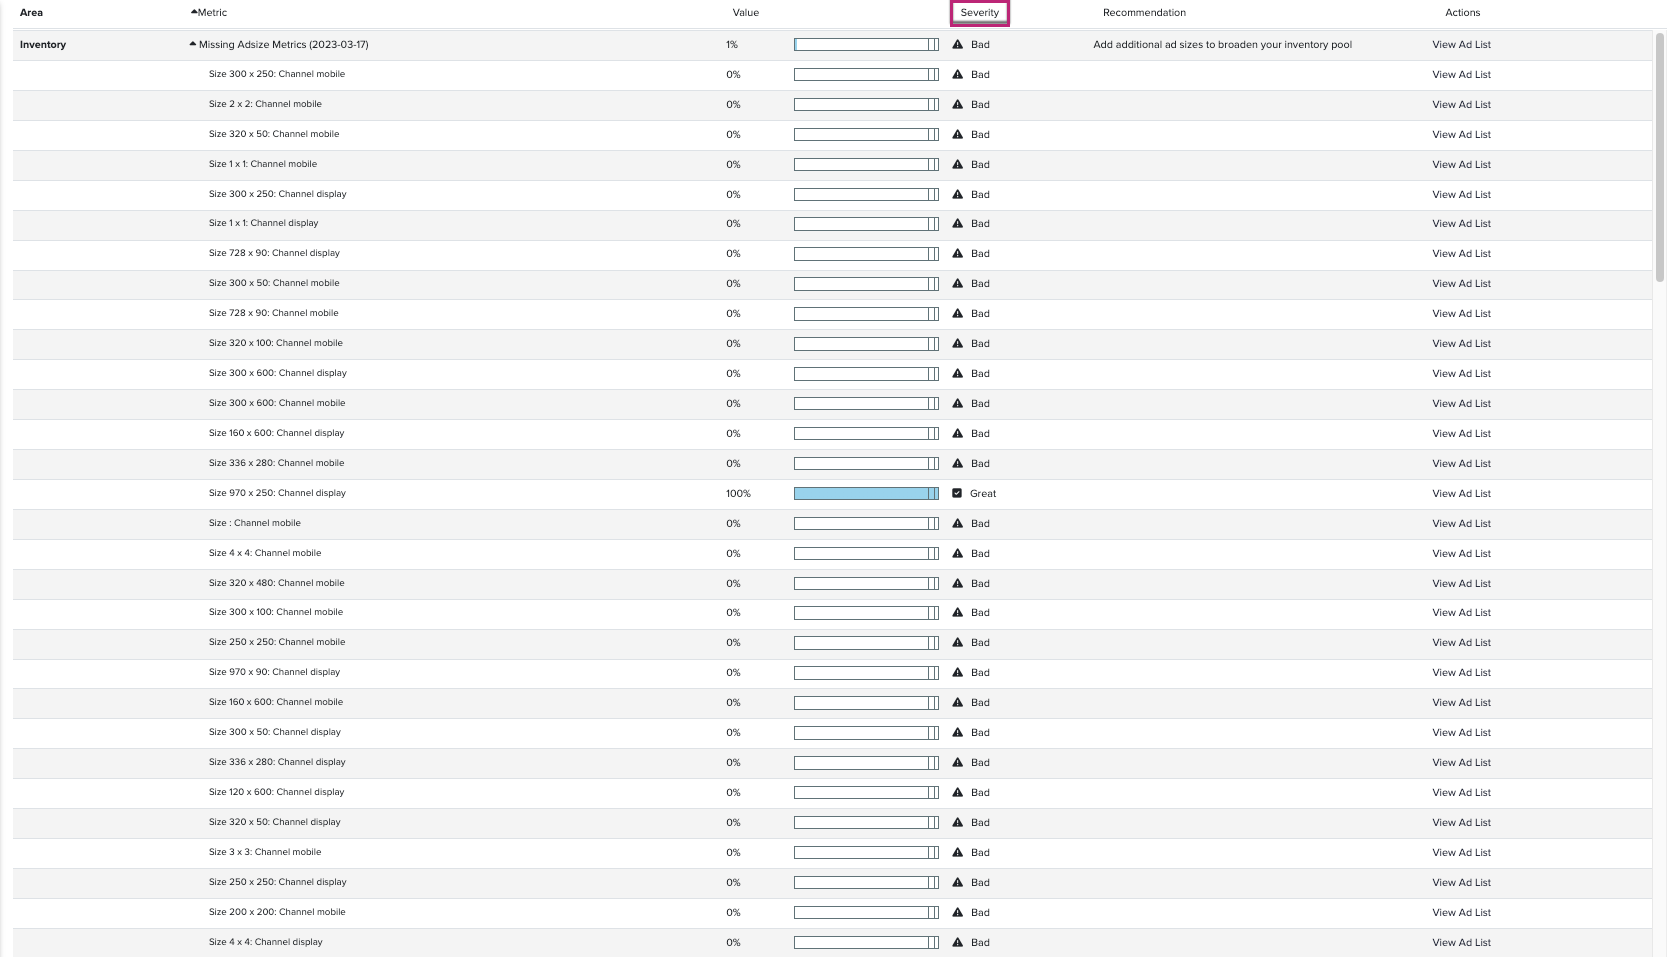
Severity
Click on an Area name to open additional details about that section within the report.
1. Start with scanning down the Severity column to find any cases showing the status, “The platform has identified the corresponding areas as problem cases”.
2. Check the Location of the problem. Many areas contain multiple items, only some of which may be problematic. Choose an item arrowhead to dig down into a problem by expanding the display.
3. Consult the Recommendation column to determine how to address the issue.
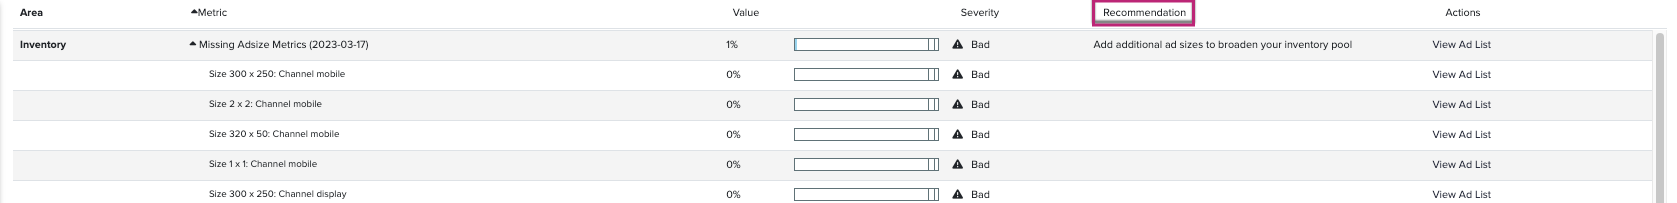
4. Choose the link in the Actions column to access the relevant controls in the DSP.
Once you have addressed all the red flags, revisit the Severity column to find any other flags and address all of them as well.
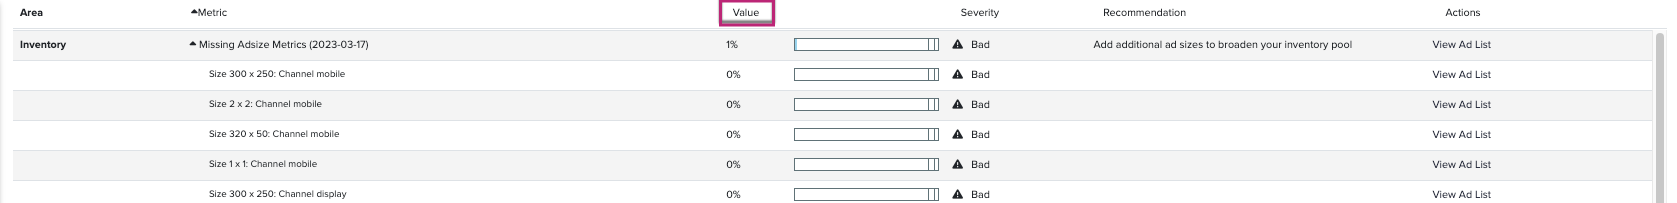
Value
The Value column displays a visual indicator of the extent of a problem area.
-
Each main area is denoted by a bar divided into three areas.
-
The sizes of these areas may differ from area to area to reflect different levels of severity.
-
The number to the left of the Value bar provides a numerical rating of the problem severity.
-
Some areas optimize to high numbers, e.g. Data Freshness, while others optimize very low numbers, e.g. Ad Rejection Block Rate.
If you are in doubt, check the Severity column.
Date
The Date after the Area name indicates the last time the platform updated the metric. Generally, there is a 48-hour lag.