

The Model Attributes report opens the hood of the models used on your campaign. It shows each feature and attribute used to make decisions by Zeta's AI, and how these attributes are scoring for your campaign. This report can be filtered to show the data gathered by the individual models used in your campaign. The Highlights section provides bullets of summary text about what the model has learned, and which features are providing the most impact.
A data grid view and export are also available.
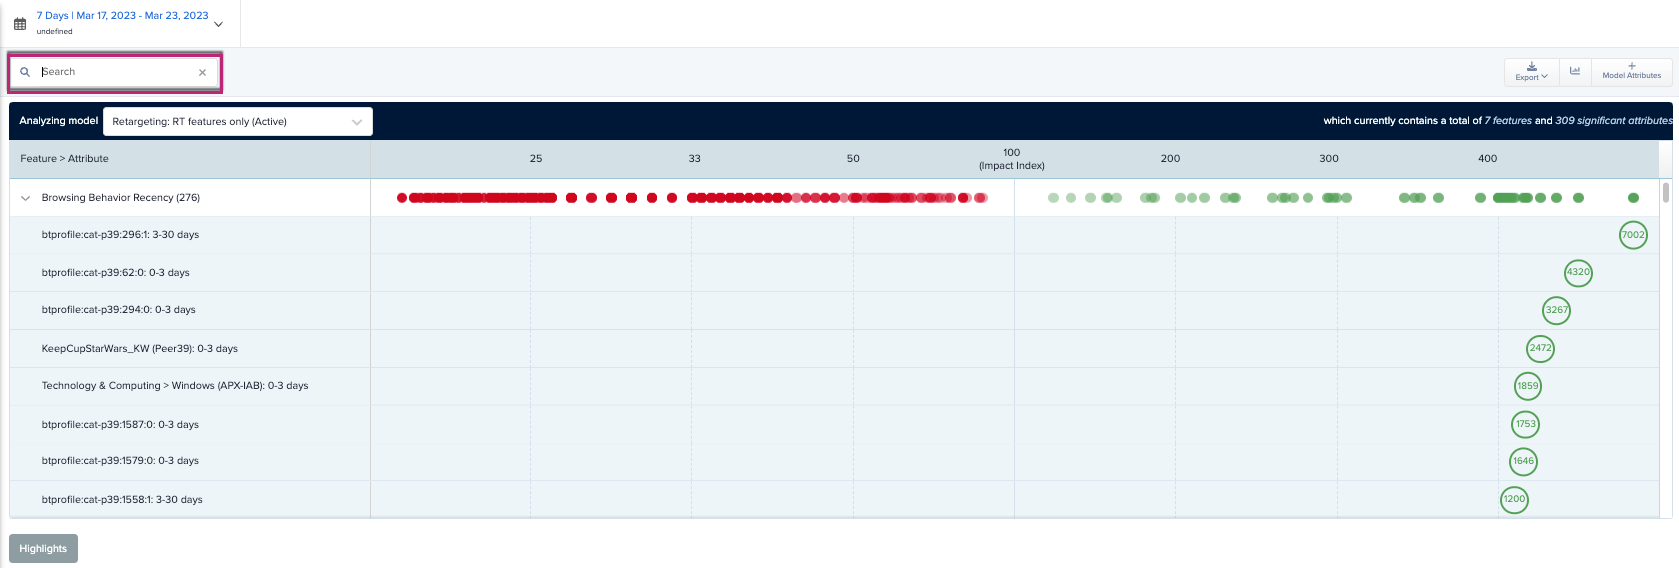
This report is mapped out along an Impact Index Metric. This measures how likely the presence of an attribute is to have on a campaign's desired outcome. The baseline of this index is 100. An index of 200 means an attribute is twice as likely to lead to a click or conversion, but an index of 50 means it is half as likely.
Each individual attribute is mapped out as a dot along the Impact Index. Green are more likely, red is less likely. By default, Features are collapsed. Hover over a feature row to see how the attributes in that feature are performing. Expand a feature to view individual attributes and their specific scores. Rollover any attribute's score to see an expanded tooltip with ranking and index score.
Video Completion Rate and Viewability Models are not supported.
Navigation
1. Click on the DSP logo in the upper left corner. Within the menu that appears for Advertisers and Admin, select your desired account and advertiser.
2. As the DSP displays all of the advertiser's campaigns, click on the Campaign you would like to view from the list.
3. With the campaign open, click the caret next to Manage Campaign (atop the page) > Campaign Analytics. The Report Builder appears. From this report, you can access all other Insights reports.
4. Click the caret next to Report Builder and select Models > Model Attributes from the dropdown.
The Model Attributes Report
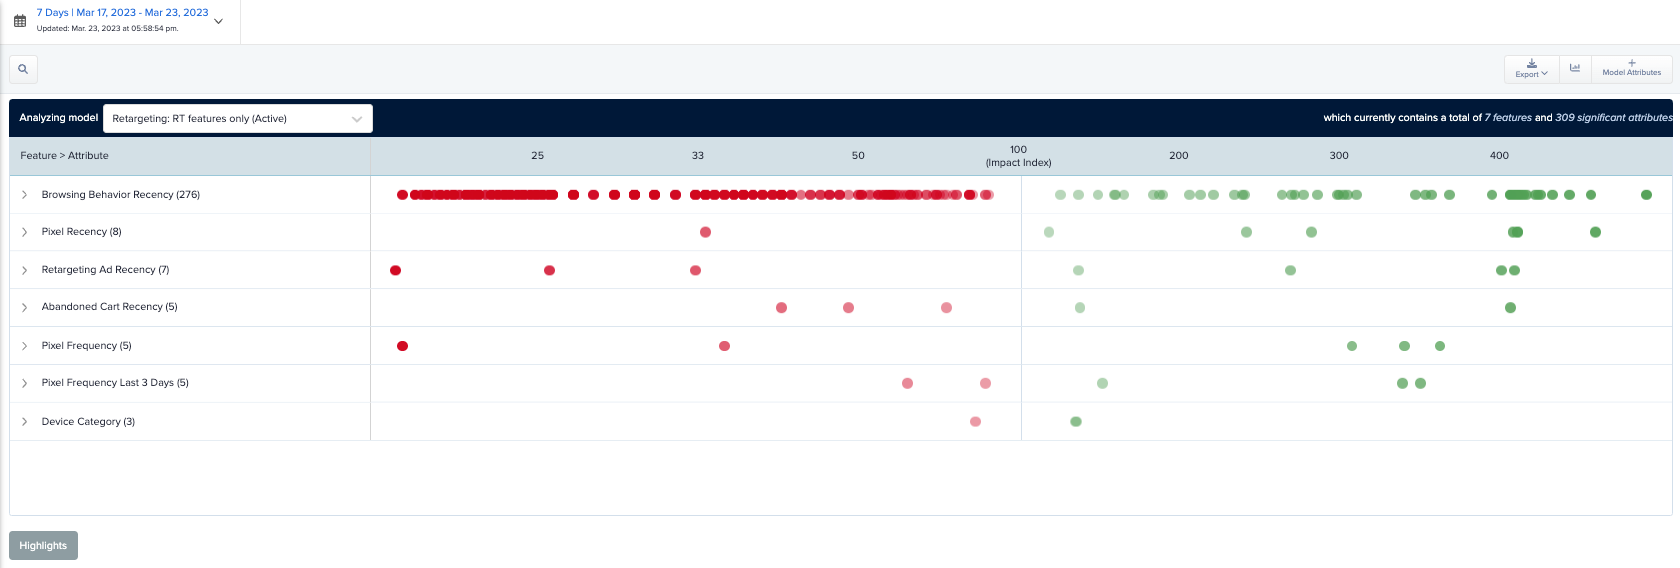
The Model Attributes Report shows each feature category in a row, along with the number of attributes.
1. The main display shows a dot for each attribute. It is mapped along the impact index.
-
Attributes with a positive effect have a green dot.
-
Attributes with a negative effect have a red dot.
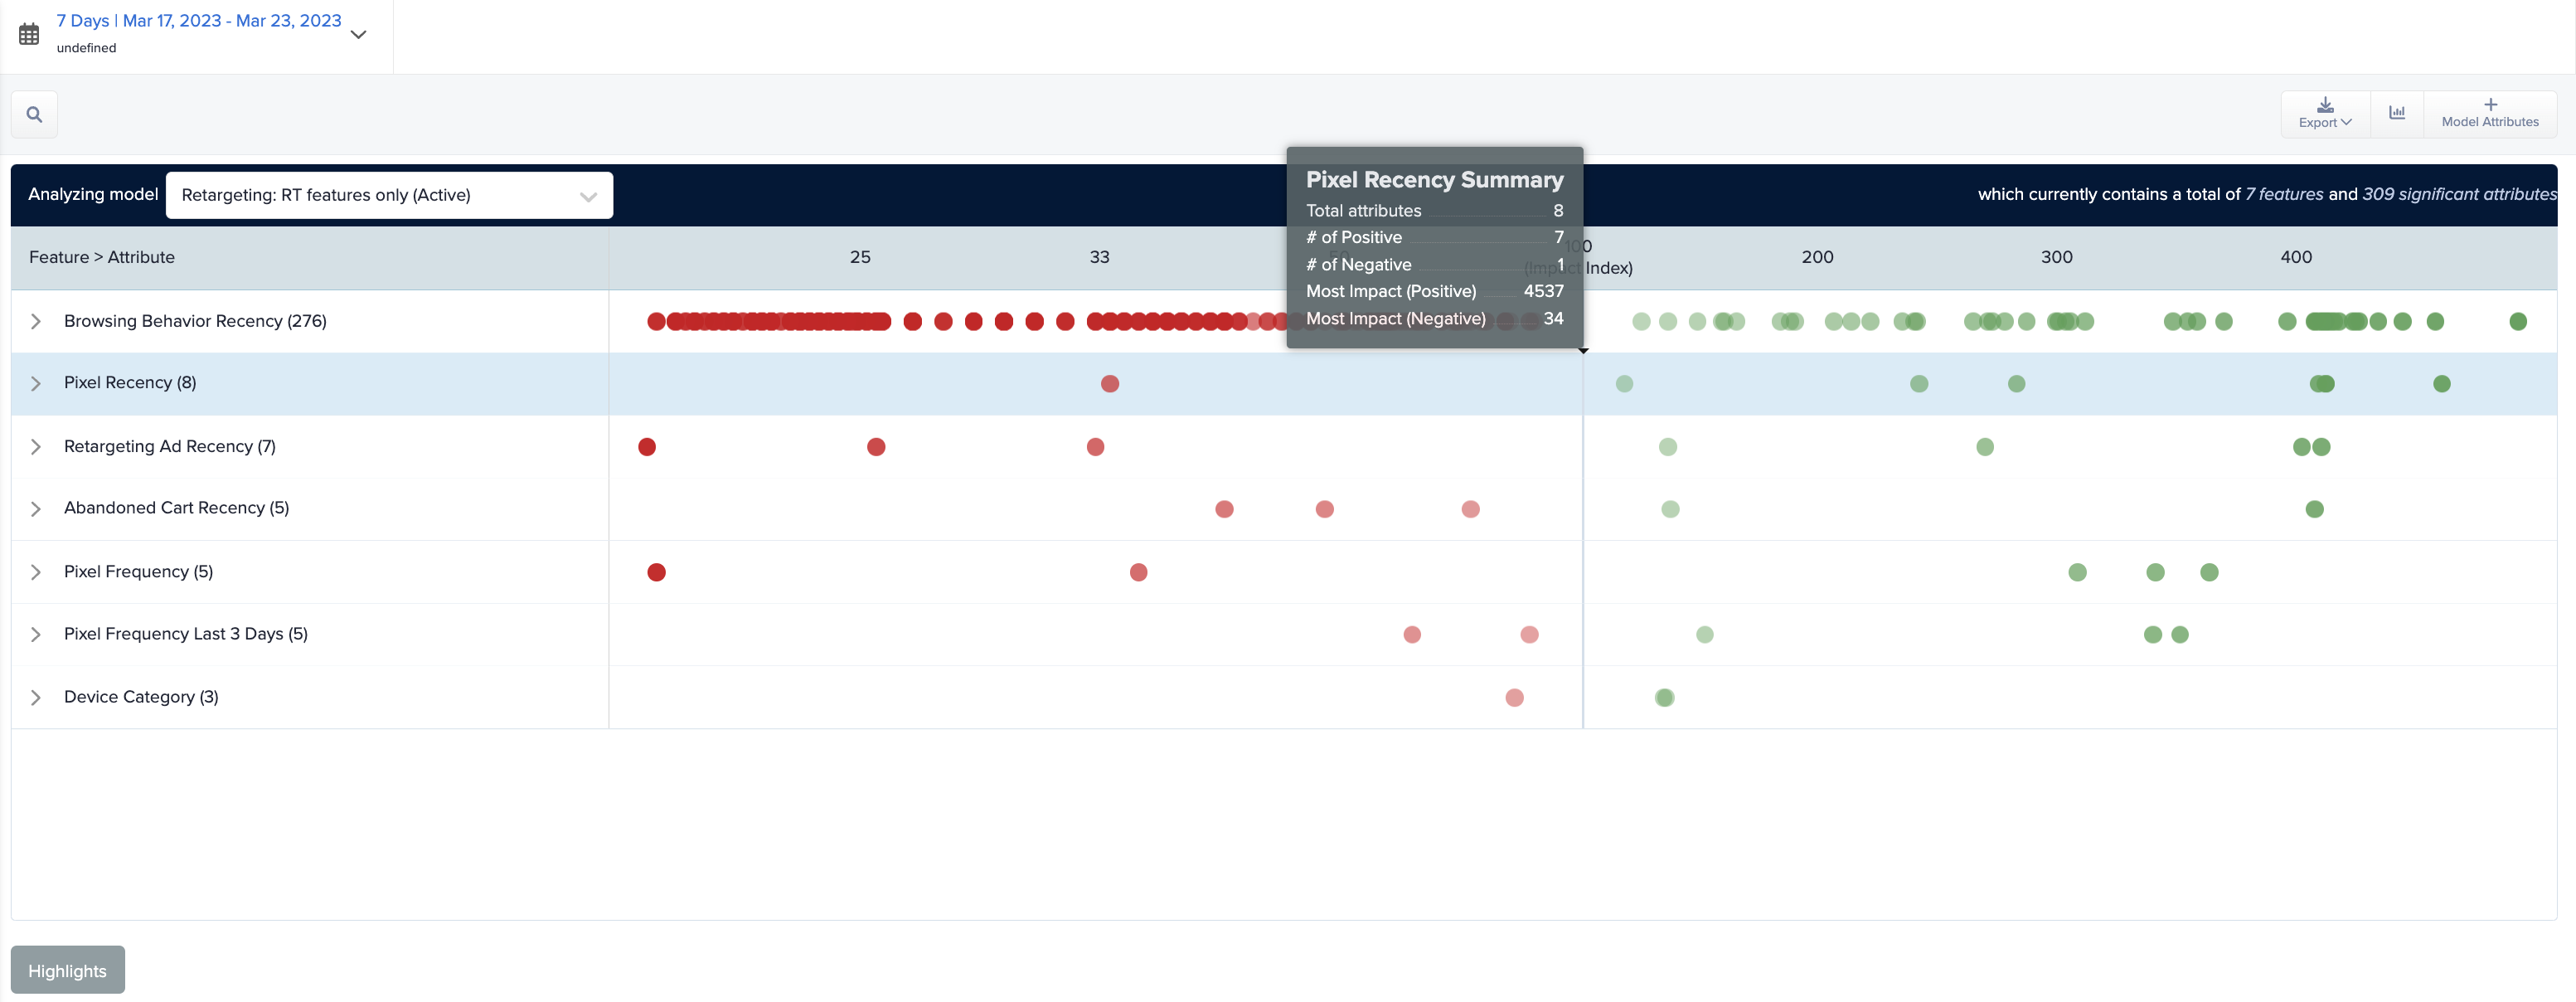
2. Hover over a feature to view the Summary tooltip. This tooltip shows the feature's total number of attributes, the total number of positive attributes, and the total number of negative attributes, along with the index of the most and least impactful attributes.
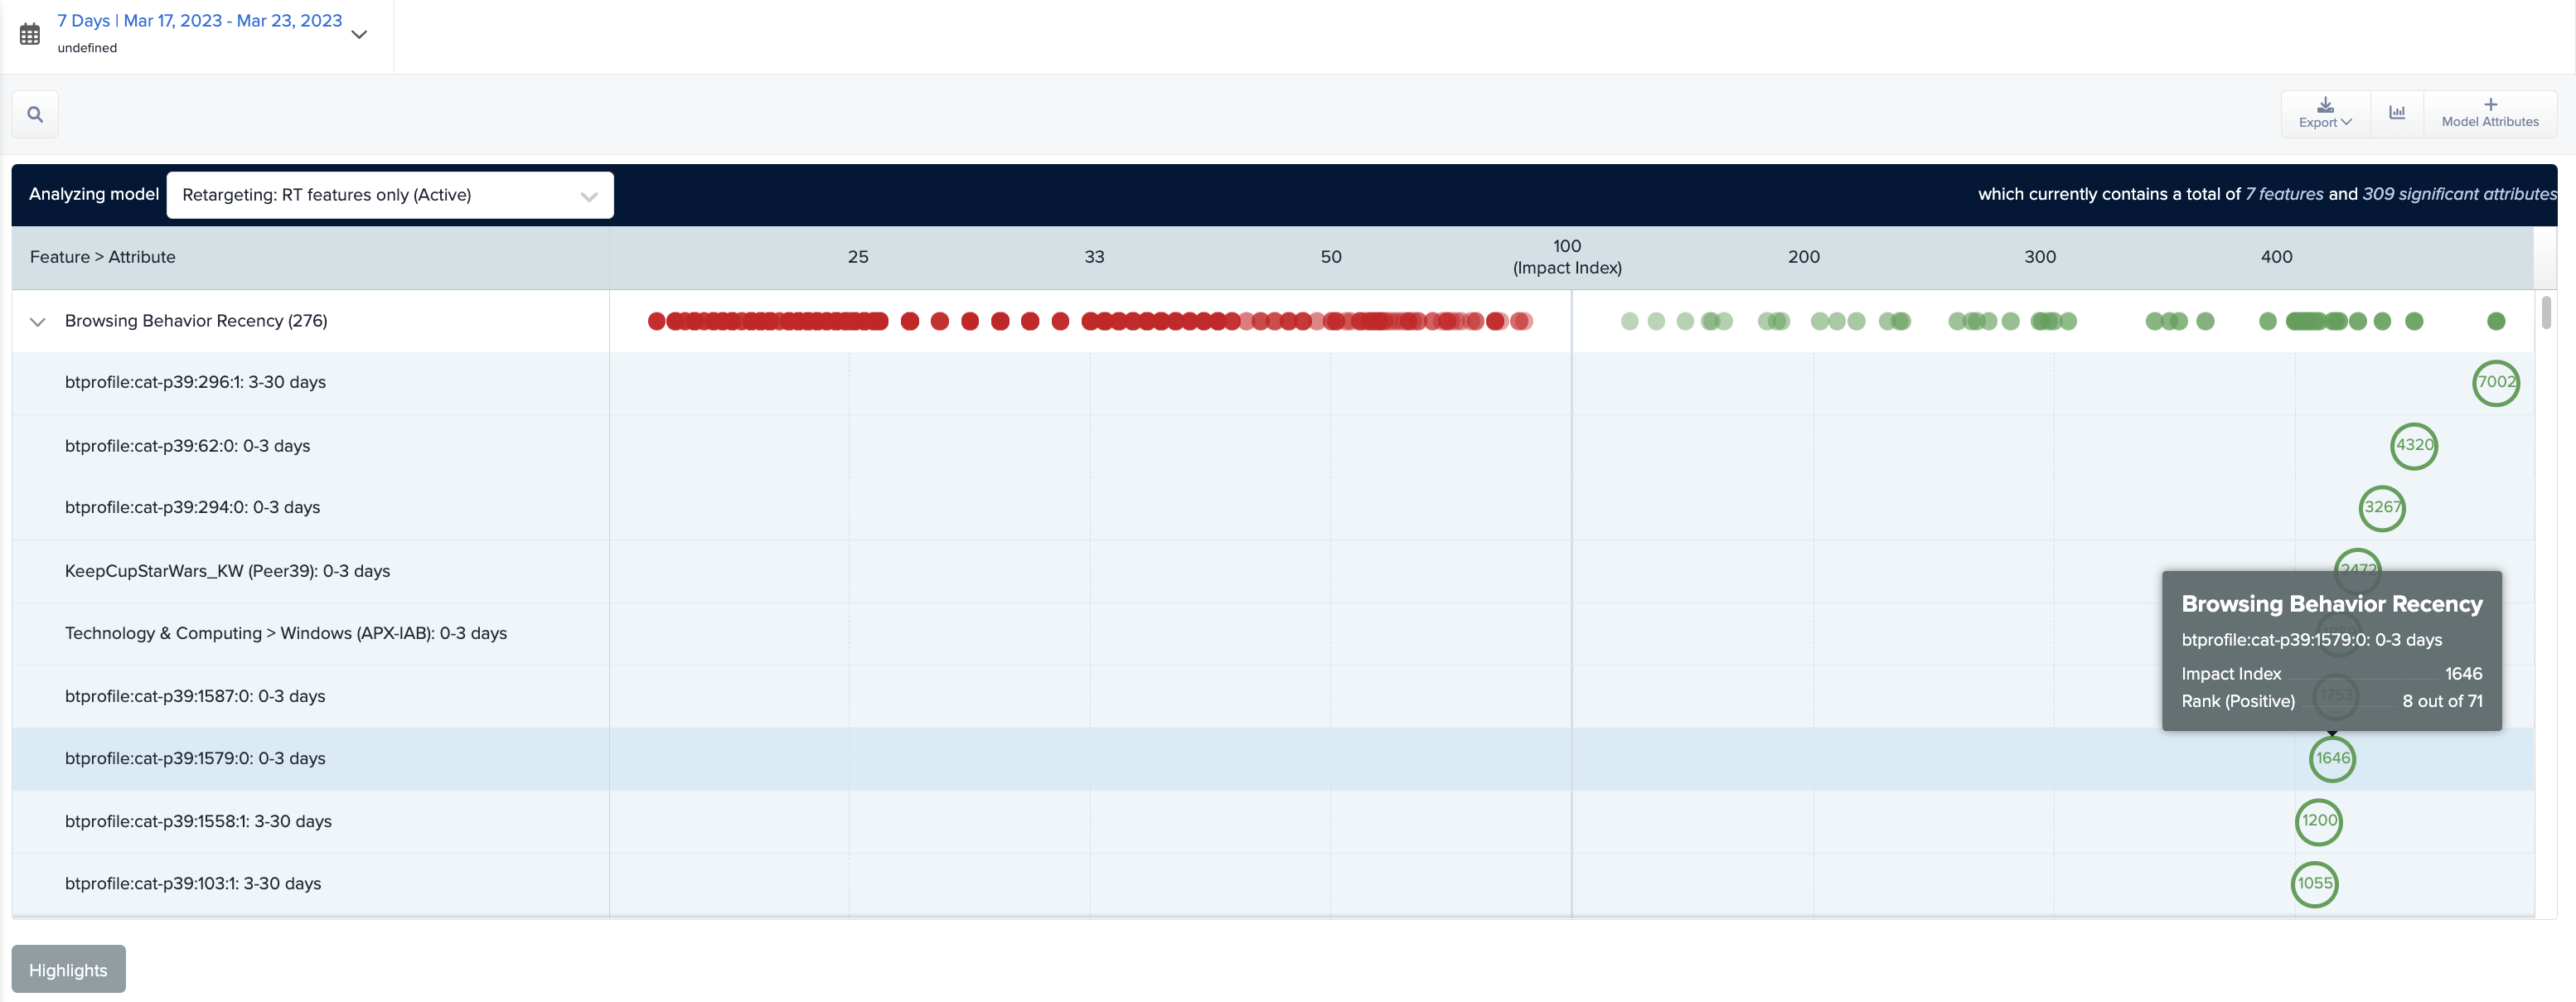
3. Click the caret (>) next to a feature to expand the feature and display a row for each attribute. The impact index is shown for each attribute. Hover over any attribute's index score to view details on the attribute's effect on your campaign.
Impact Index
The impact index is a score applied to an individual attribute's model coefficient value. It indicates how predictive the presence or absence of a given attribute is relative to the model's goal (click or conversion). An index of 200 means, other things being equal, showing an ad to a user with that attribute is twice more likely to result in the outcome the model is optimizing towards than not showing the ad. An index of 50 means, other things being equal, showing an ad to a user with that attribute is half as likely to result in the outcome the model is optimizing towards.
Summary Highlights
Click on Highlights in the lower-left corner to view the most impactful attributes in a bulleted list. This helps you get a concise (and easily copied) view of the most important attributes of your campaign. By default, five positive and negative attributes appear.
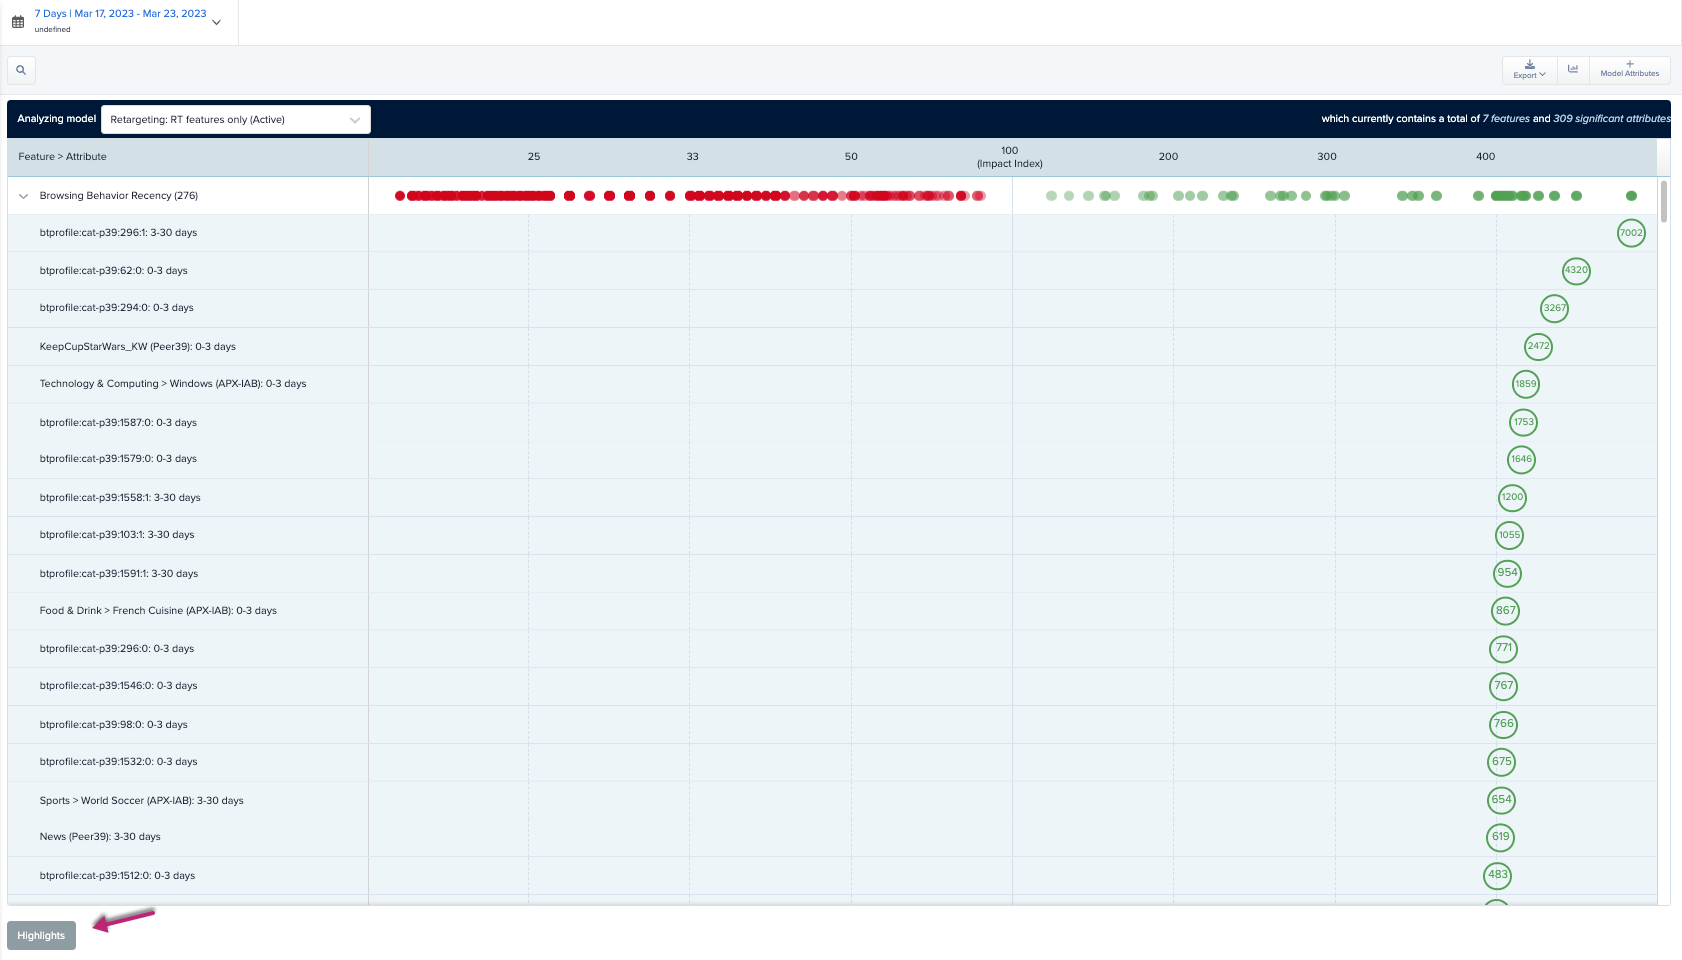
Click on Show More under either bulleted list to view ten.

Selecting a Model
Click on the Analyzing model list, and then select which model to show in the report. The report automatically updates to see how each attribute is scored by the model.
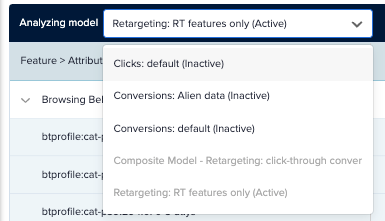
Searching for a Model
Click on the Search icon, and then enter a search term. The report shows only the rows that match your search term. You can search for an attribute or feature name.
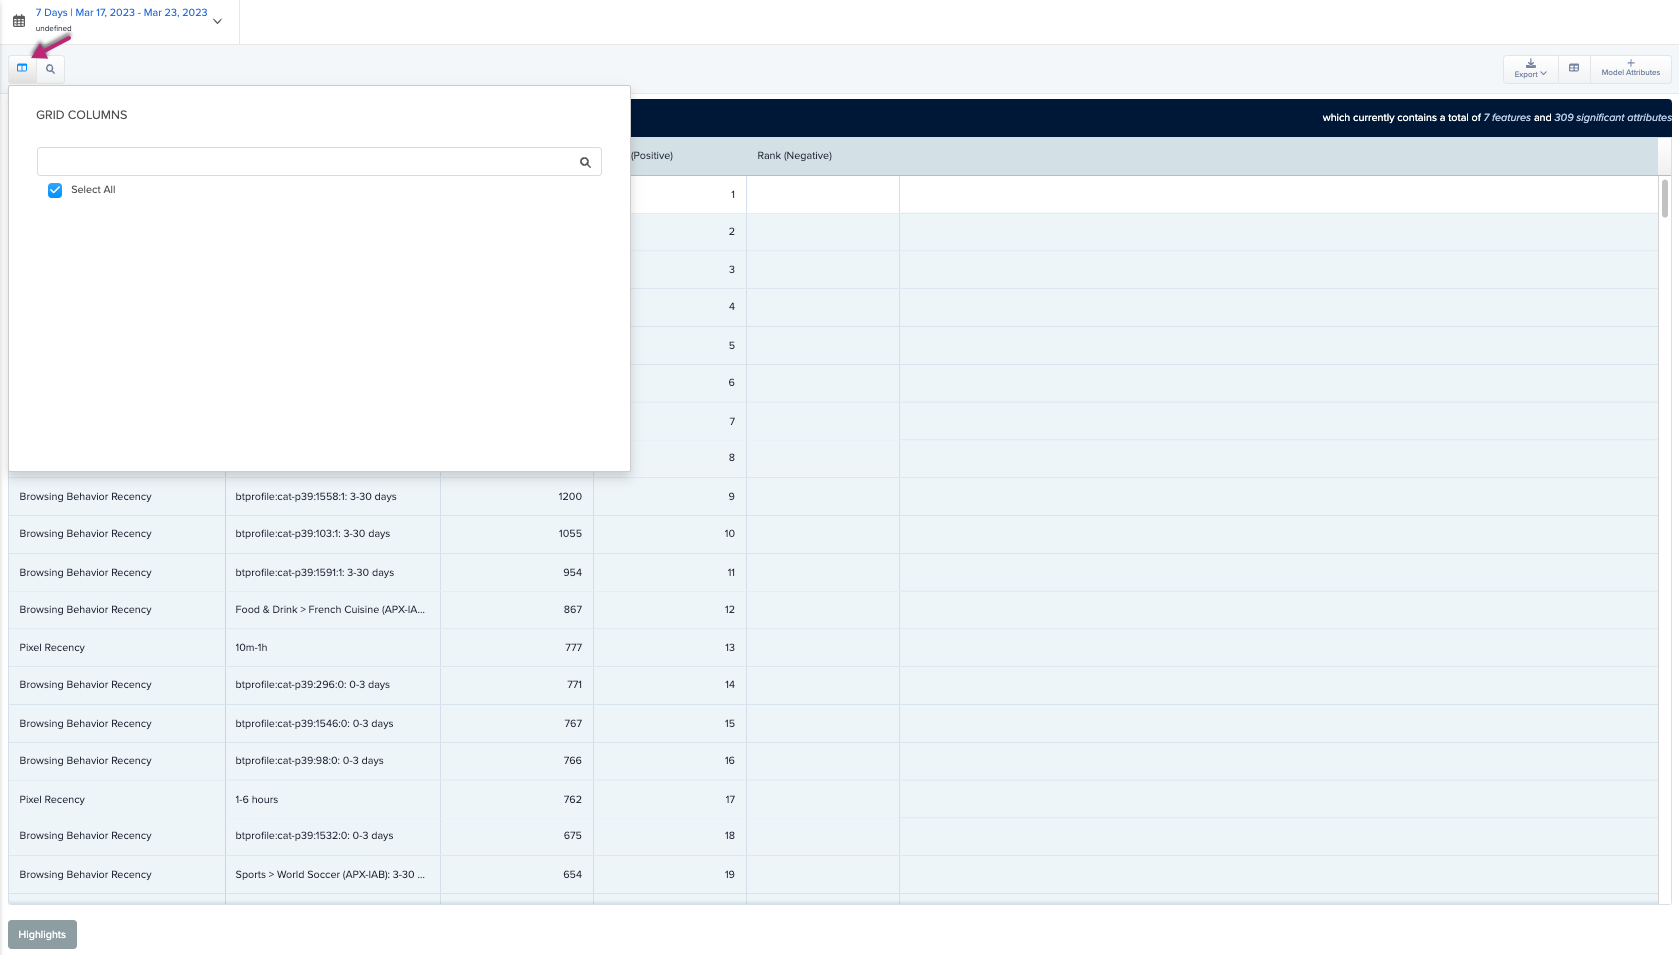
Viewing the Data in a Grid
Click on the graph icon at the upper right corner, and then select Summary Data.
.gif?cb=99590108aeeaebb2e359a3537eadcb12)
-
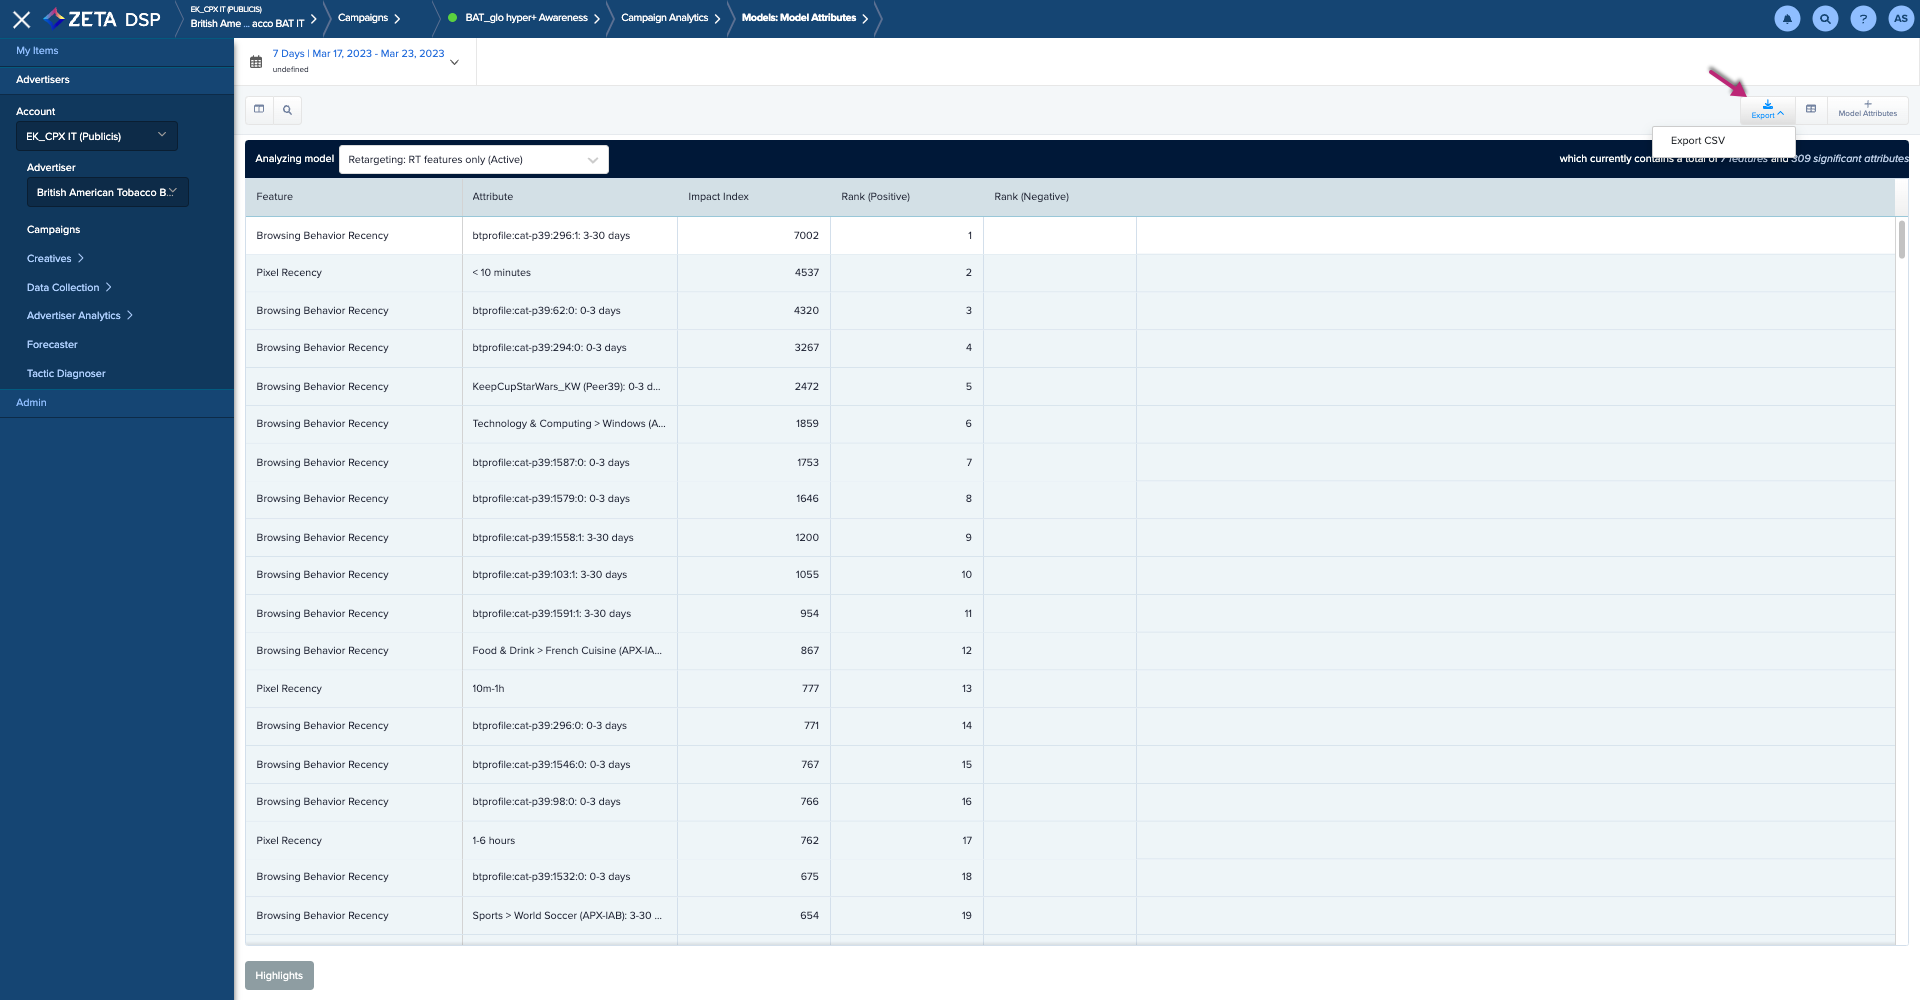
The platform shows the same data from the Graph view but laid out in a table.
Change the Grid
Click on the Grid icon at the top-left to select the Table Columns you’d want to appear on the grid.
Exporting the Report
Click the Export icon at the top-right and select Export CSV to create a CSV file of your report.
Video Completion Rate and Viewability Models are not supported.