

The Marketing that Learns chart is a real-time visualization of Zeta's Moment Scoring technology. As more and more Ads are served and scored, our models learn about the user attributes that best drive performance to your campaign's goal. This report contains three charts:
-
Marketing that Learns Chart
-
Model Management Chart: This shows how your campaign's models are affecting various attributes over time
-
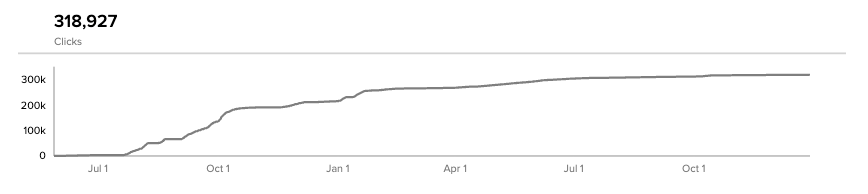
Clicks Chart: This shows the number of clicks (or conversions, or other goals) of your models over time.
Currently, Viewability and Video Completion Models are not compatible with this report. This feature will be added in a future release.
How it Works
Zeta's Moment Scoring gains insight every time an impression is served – that's over 100 billion bid requests, or moments, per day, from which our models learn. Our technology scores each of those moments and uses that information to improve its model for predicting the moments that will drive impact against the campaign's objective. In turn, the model seeks more such moments – moments to engage your customers, and drive conversions. This ability to learn, adapt, and evolve is called Marketing that Learns. The result is better campaign performance that drives better results, such as a lower CPA.
Predictive models combine "data mining" and statistical modeling techniques to predict whether the display of an ad will have the desired result. They are more sophisticated than "bidding rules", which typically include just a few considerations (e.g. bid $3 CPM on women ages 35-55 in the Northeast US). Our models consider millions of possible attributes, including, for example:
-
Page visits (previous and current)
-
Actions taken
-
Device and browser details
-
Location
But at the start of a campaign, the amount a model knows is limited. A model begins to learn, initially, when users visit the advertiser's site, picking up information from the site's Pixels. This is why the thorough and early installation of Pixels is so important. As a rule of thumb, Zeta recommends placing Pixels at least two weeks prior to the start of your campaign.
Employing Pixel data, a model begins to form hypotheses about who is likely to convert. Once conversions begin a model typically begins a steep learning curve that accompanies a significant lowering of CPA and an ever-increasing number of conversions. This feature is not limited to CPA campaigns but works for other types of campaigns as well.
Zeta has created models in various categories such as Conversion, Click, and Viewability. There are multiple types in each category. For example, model types in the Conversion category include those intended for new campaigns, difficult conversion situations, click-through campaigns, etc.
Navigation
1. Click on the DSP logo in the upper left corner. Within the menu that appears for Advertisers and Admin, select your desired account and advertiser.
.gif?cb=2ecdcaf7e9b6e36d8ddeabab6d417ba5)
2. As the DSP displays all of the advertiser's campaigns, click on the Campaign you would like to view from the list.
3. With the campaign open, click the caret next to Manage Campaign (atop the page) > Campaign Analytics. The Report Builder appears. From this report, you can access all other Insights reports.
4. Click the caret next to Report Builder and select Models > Marketing That Learns from the dropdown.
Analyzing Model
If the campaign is using multiple models, select which model to analyze the campaign against. This gives you the story of significant attributes over time by the different model IDs. Each model uses a different color scheme in the charts.
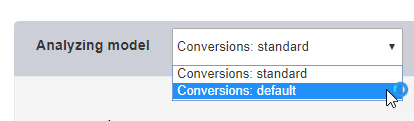
A model is listed as Inactive if it has not served any impressions in the last seven days. This can happen if the campaign is paused or if the budget of the campaign was spent over seven days ago.
Date Range
Click on the Date Range to view the date selector pop-up. Select two dates in the pop-up, which form the starting and end dates for the charts.
.gif?cb=30903adaa1b1436b019af161acaf43ee)
Click on the Date Selector to Use all Campaign Dates.
.gif?cb=1b8941e57f5c66782890383176026321)
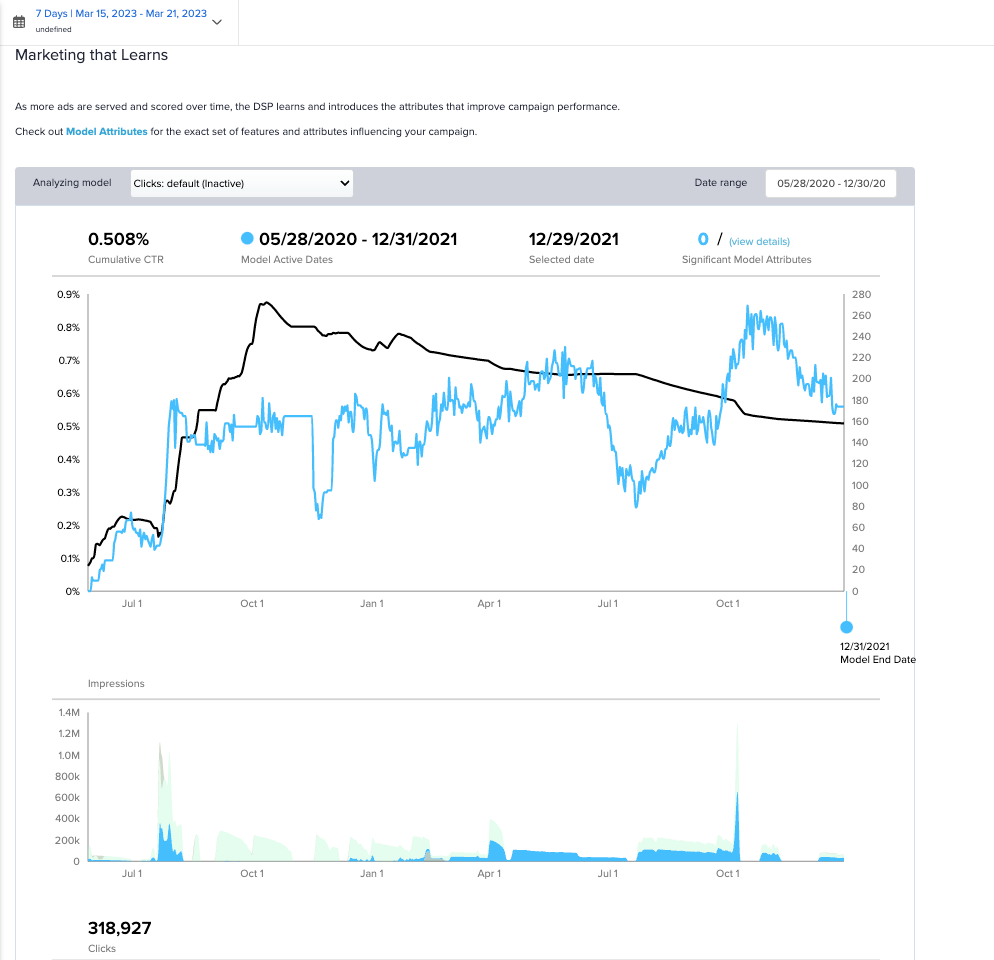
Marketing That Learns Chart
This chart displays the relationship between what the campaign's model(s) have learned and how this has affected CPA.
-
The blackline, with the axis at left, measures the campaign's overall CPA.
-
The colored line, with the axis at right, measures the number of significant attributes the campaign's model used on each date. The color of this line corresponds to the model you have selected.
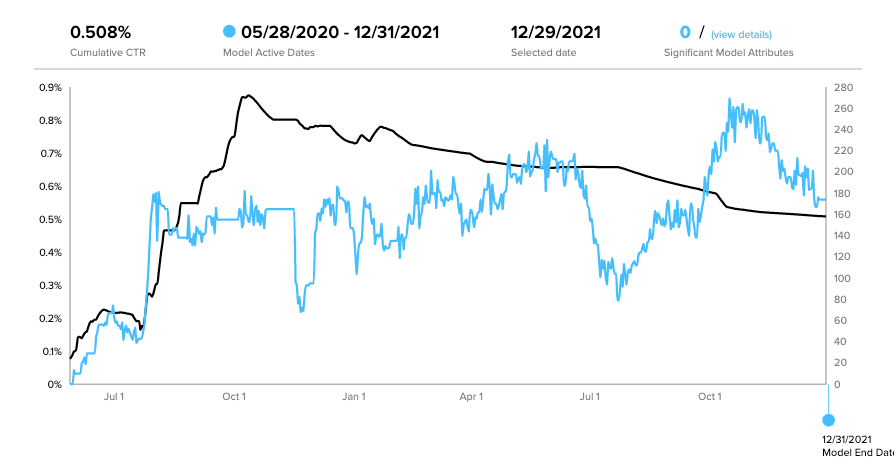
Over time, as the model learns more, CPA drops considerably.
Model Management Chart
When you have multiple models running behind your campaign, you can see how each model affects your campaign. This also helps us decide which is the best model to run on a campaign. The color of the lines on the Marketing that Learns chart corresponds to the color used on the models in this chart.
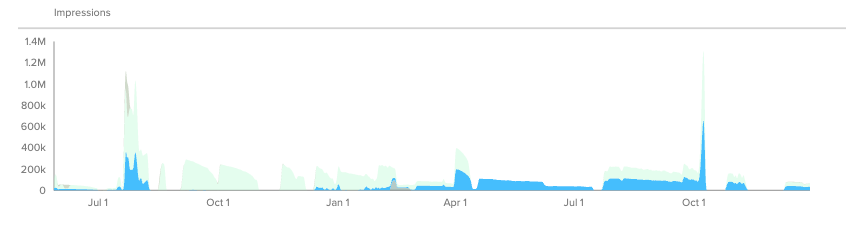
Clicks Chart
The Clicks Chart appears below the main chart. This shows your goals over the same time period as the first graph.
Hover over any graph to display detailed information from the date you are hovering over.
Metrics that Appear
The performance metrics displayed in the DSP depend on the campaign objective declared.
|
Campaign Objective |
Performance Metric |
Results Graph Metric |
|
CPA |
Cumulative CPA |
Conversions |
|
Conversions |
Cumulative CPA |
Conversions |
|
CPC |
Cumulative CPC |
Clicks |
|
CPM |
Cumulative CPC |
Clicks |
|
Clicks |
Cumulative CPC |
Clicks |
|
CTR |
Cumulative CPC |
Clicks |
|
Impression Day ROAS |
Cumulative ROAS |
Client Revenue |