

Let’s have a look at each of the column headers of the campaign grid and the functions they directly let you perform:
Status
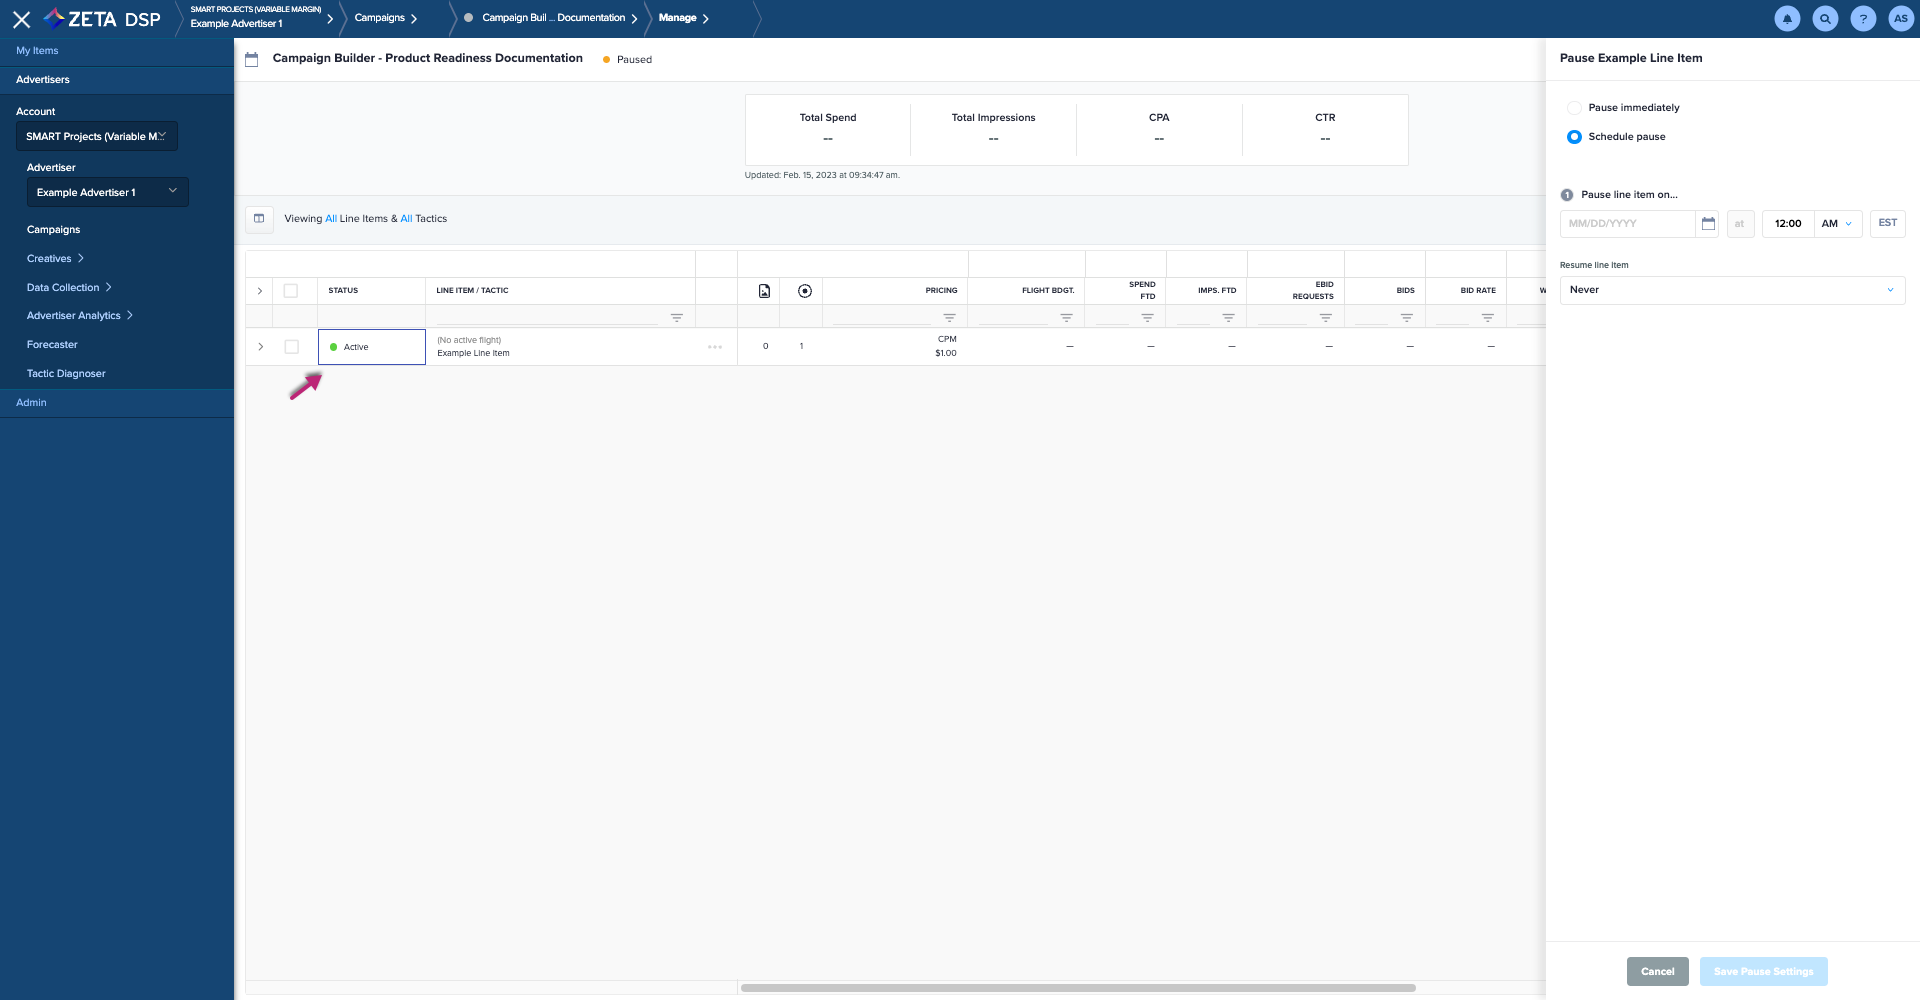
Pause or start a line item or tactic by hovering over its Status icon and clicking on the toggle.
-
A grey dot means the line-item/tactic has not yet begun delivery.
-
A green dot means the line-item/tactic has begun delivery.
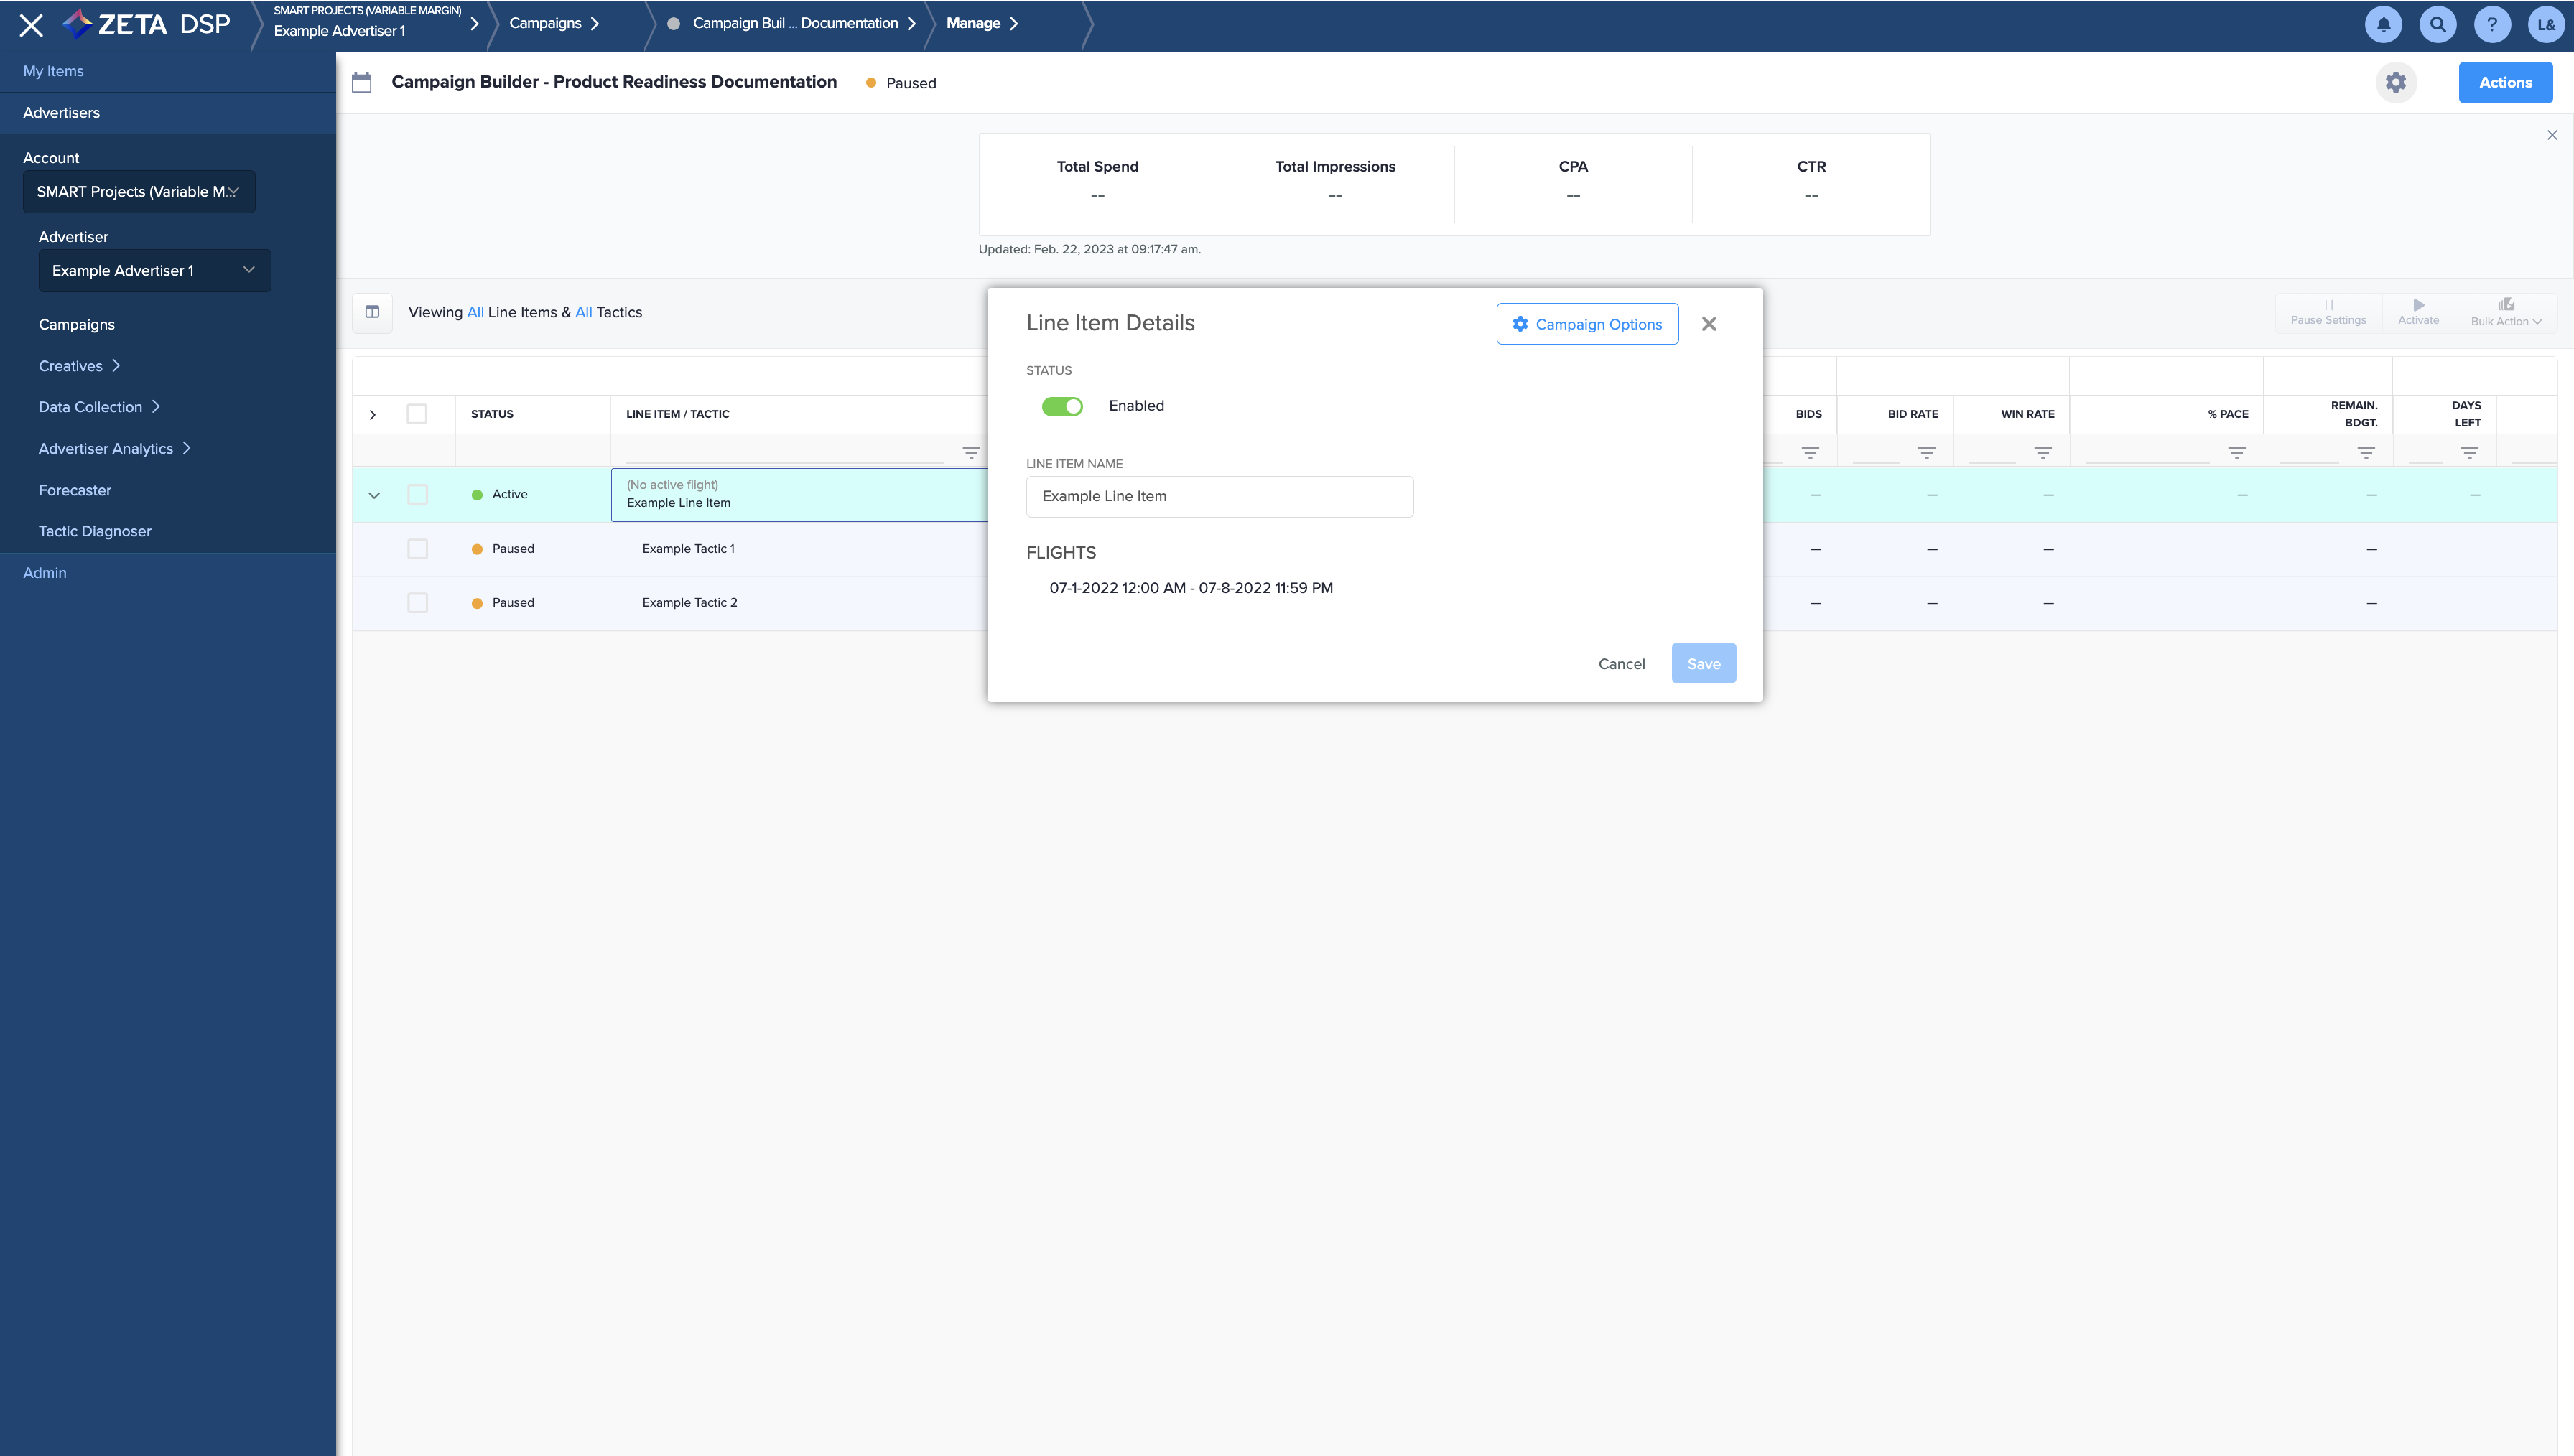
Line-Item/Tactic
Holds the name of each line item and tactic.
-
Click on a line-item or tactic name to view details.
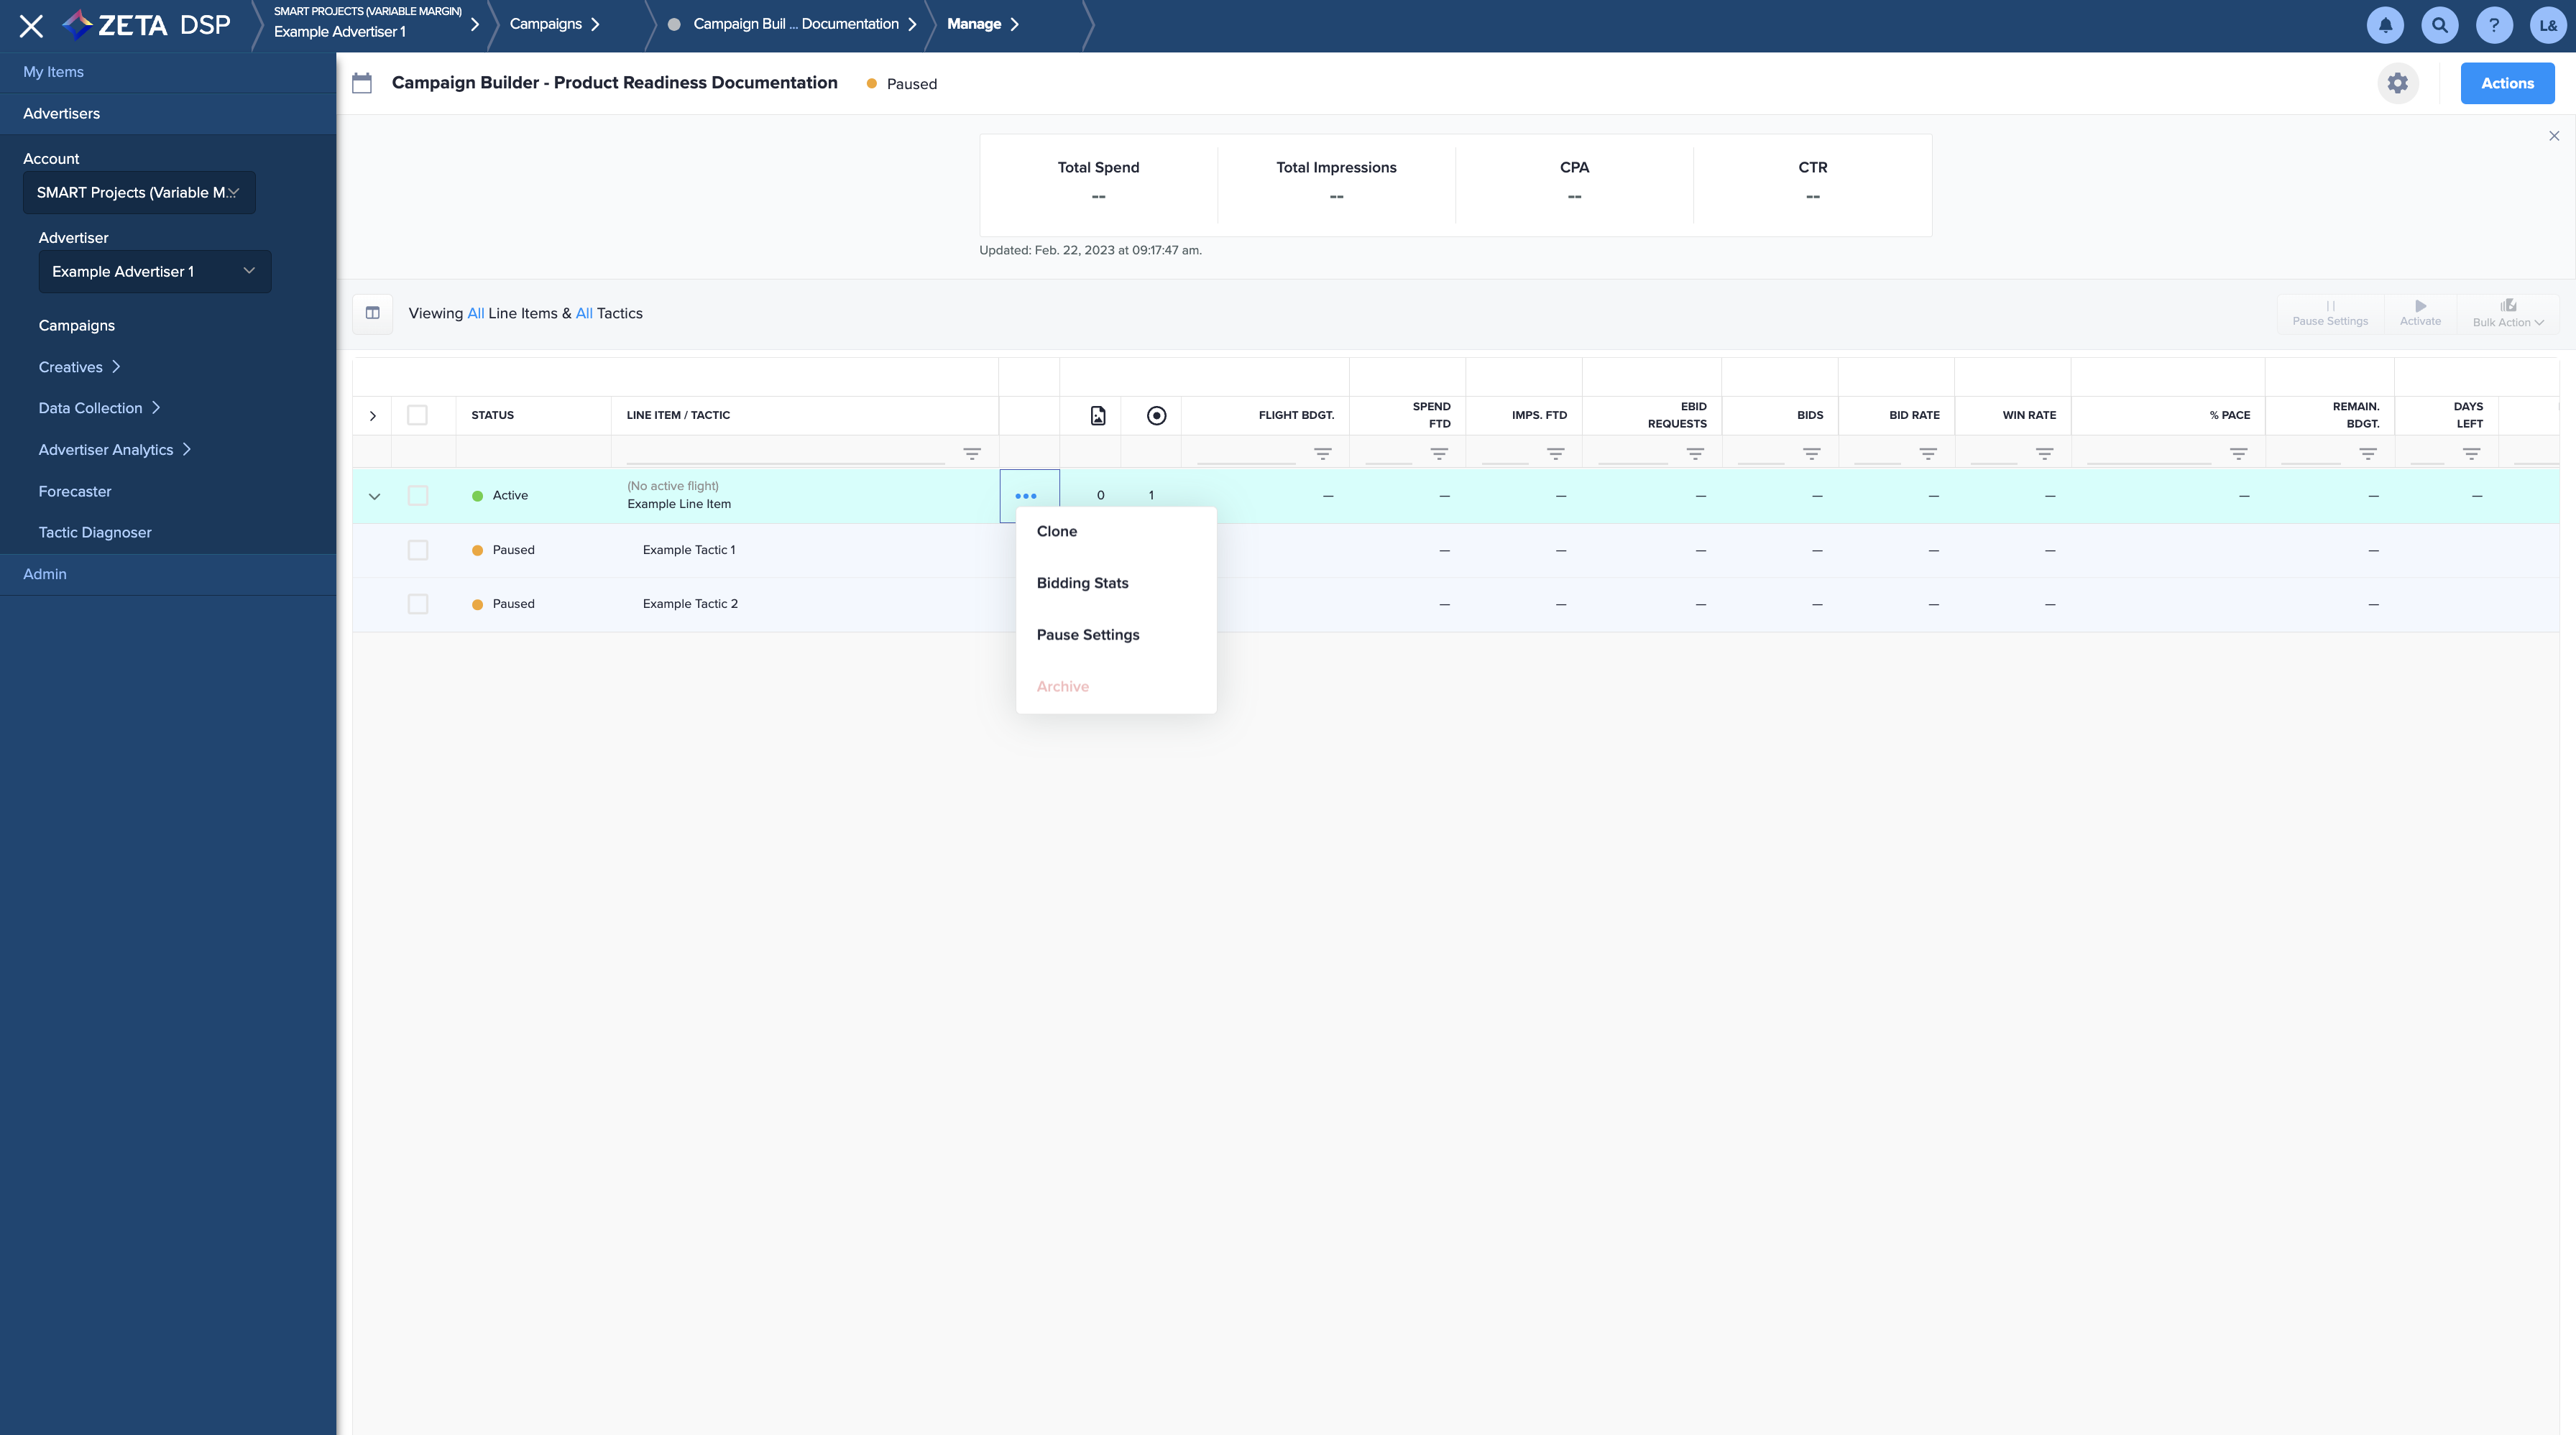
Action
The Action column allows you to perform the following:
-
Clone line items or tactics
-
Check Bidding Stats
-
Pause/Activate settings
-
Archive line items or tactics
Ads
The Ads column shows the number of ads assigned to each line item and tactic.

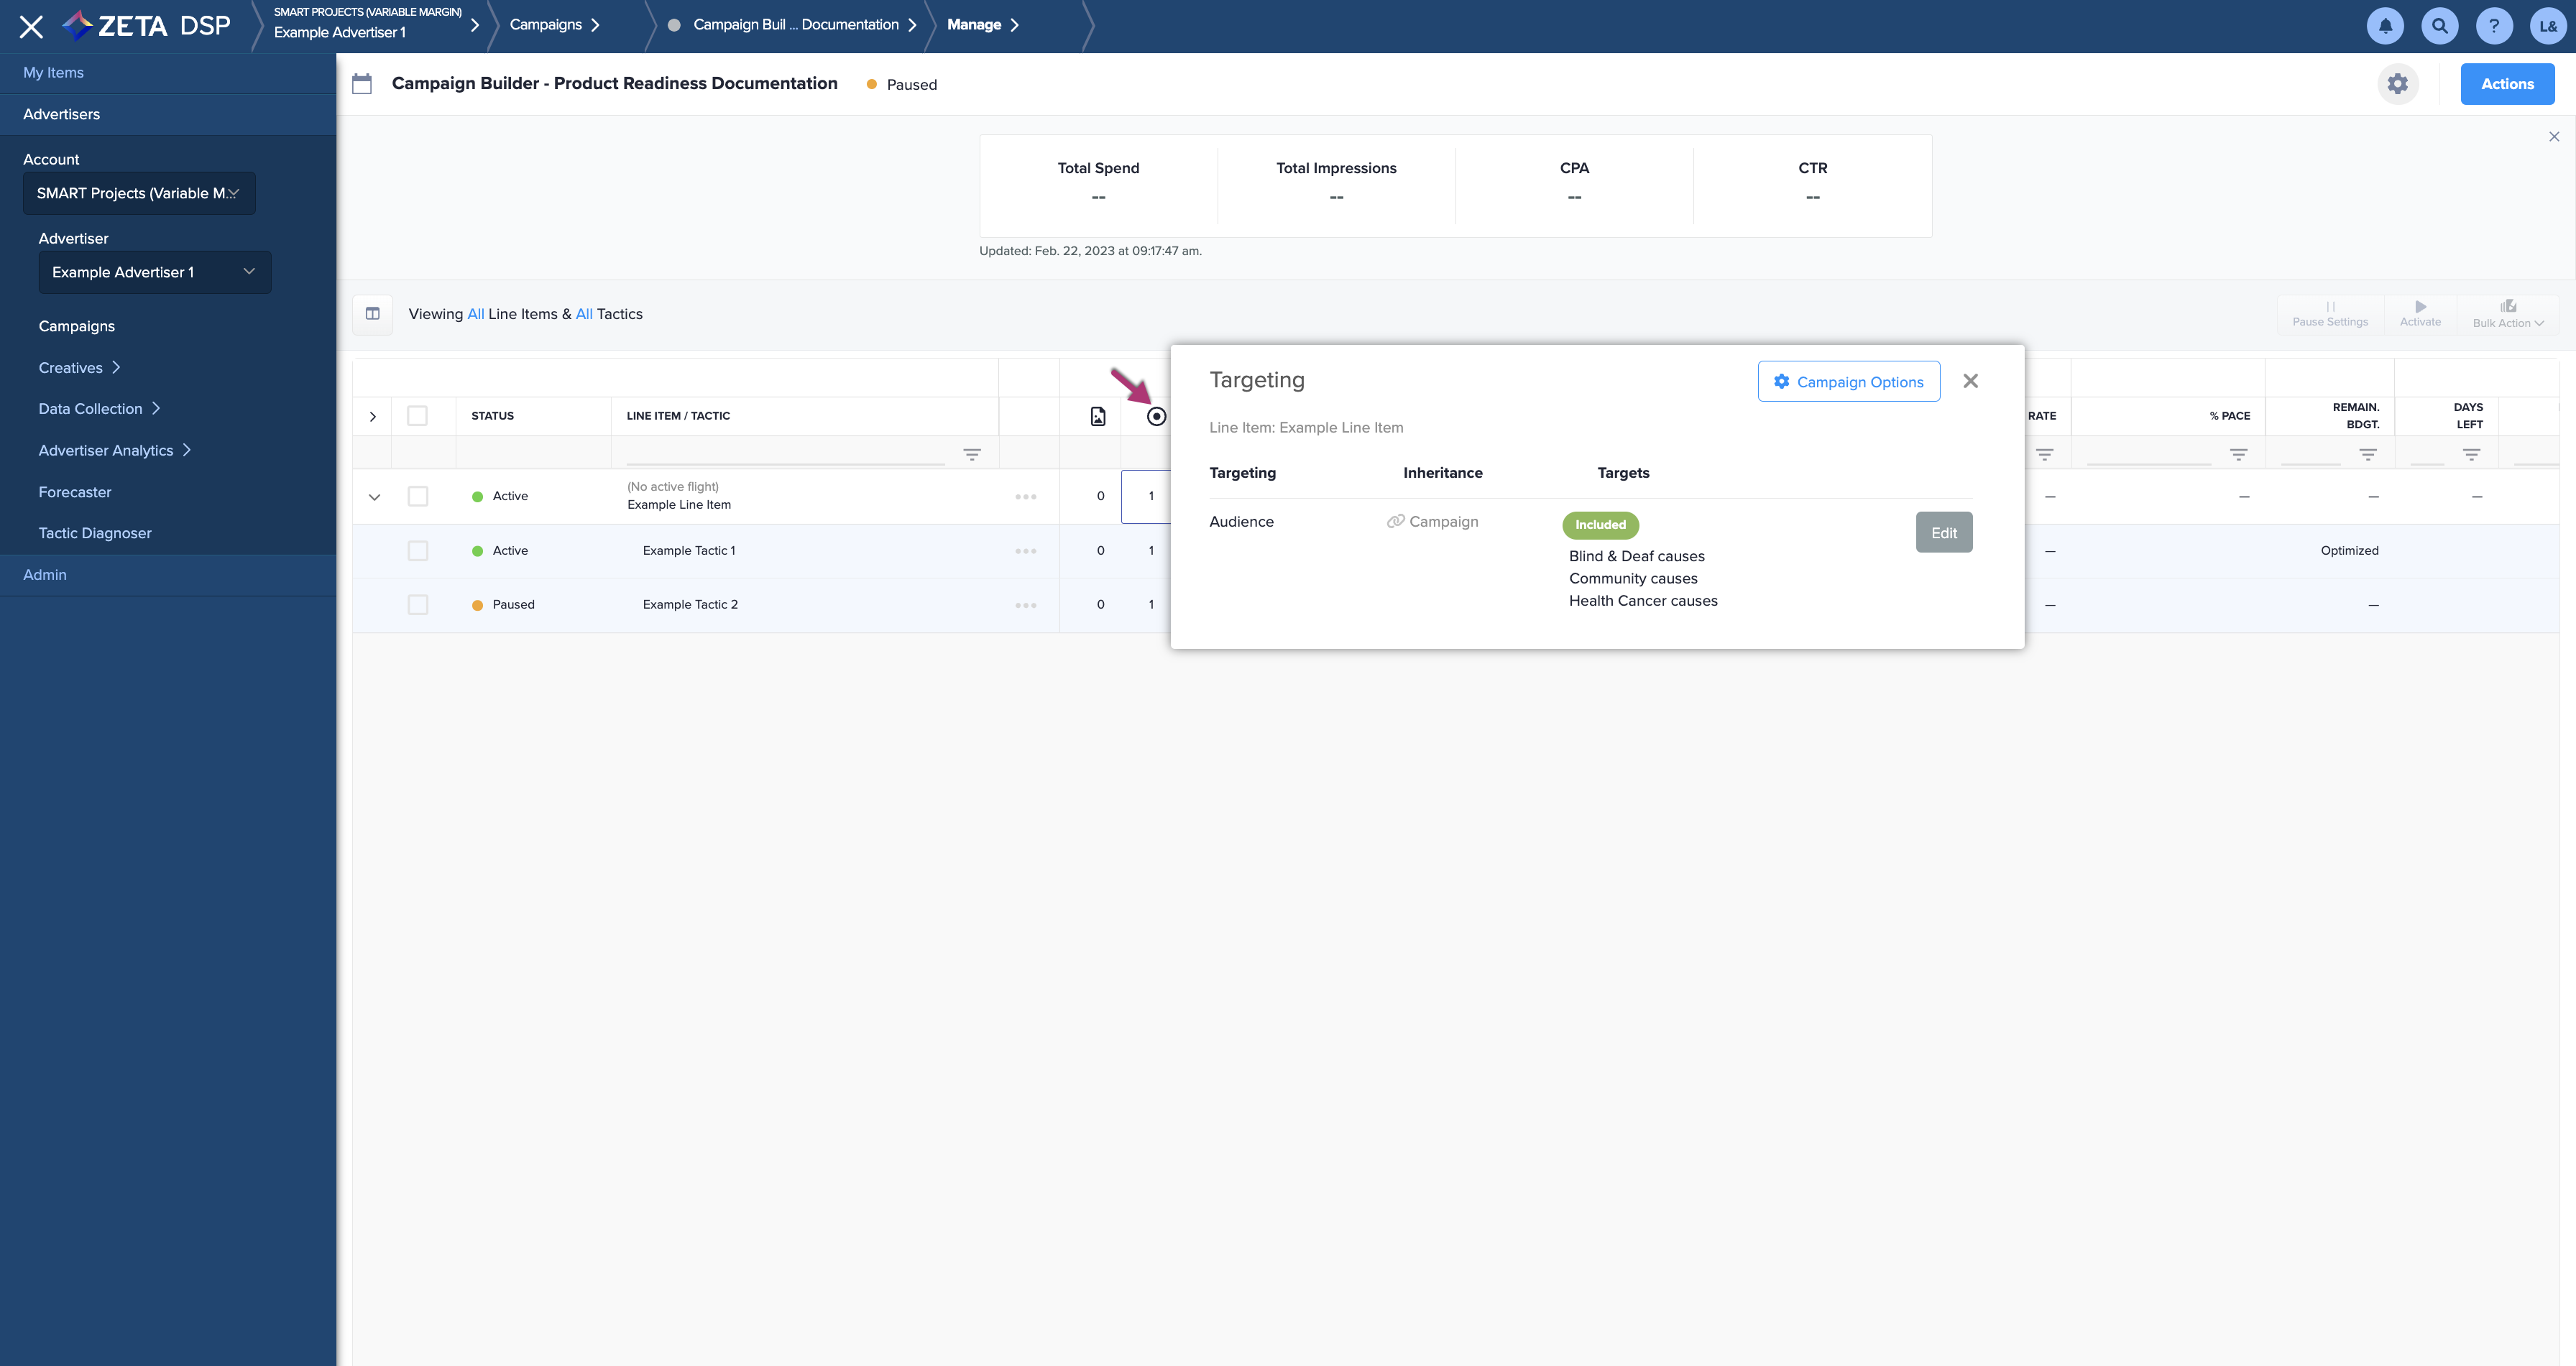
Targeting
The Targeting column shows the number of targeting restriction types applied to each line item and tactic, along with the inheritance history for that rule.
-
You can directly make edits to the targeting for the line item or tactic that is currently being viewed by clicking on Edit.
Pricing
Click on the Pricing column to view the line item pricing type and value.

-
If there is no delivery against a line item, you can edit these values via the Pricing window.
-
You can also adjust the dCPM min/max price at the Tactic Level.
Tactics can either inherit the dCPM min/max level or you can update the dCPM min/max level independently of the other tactics.
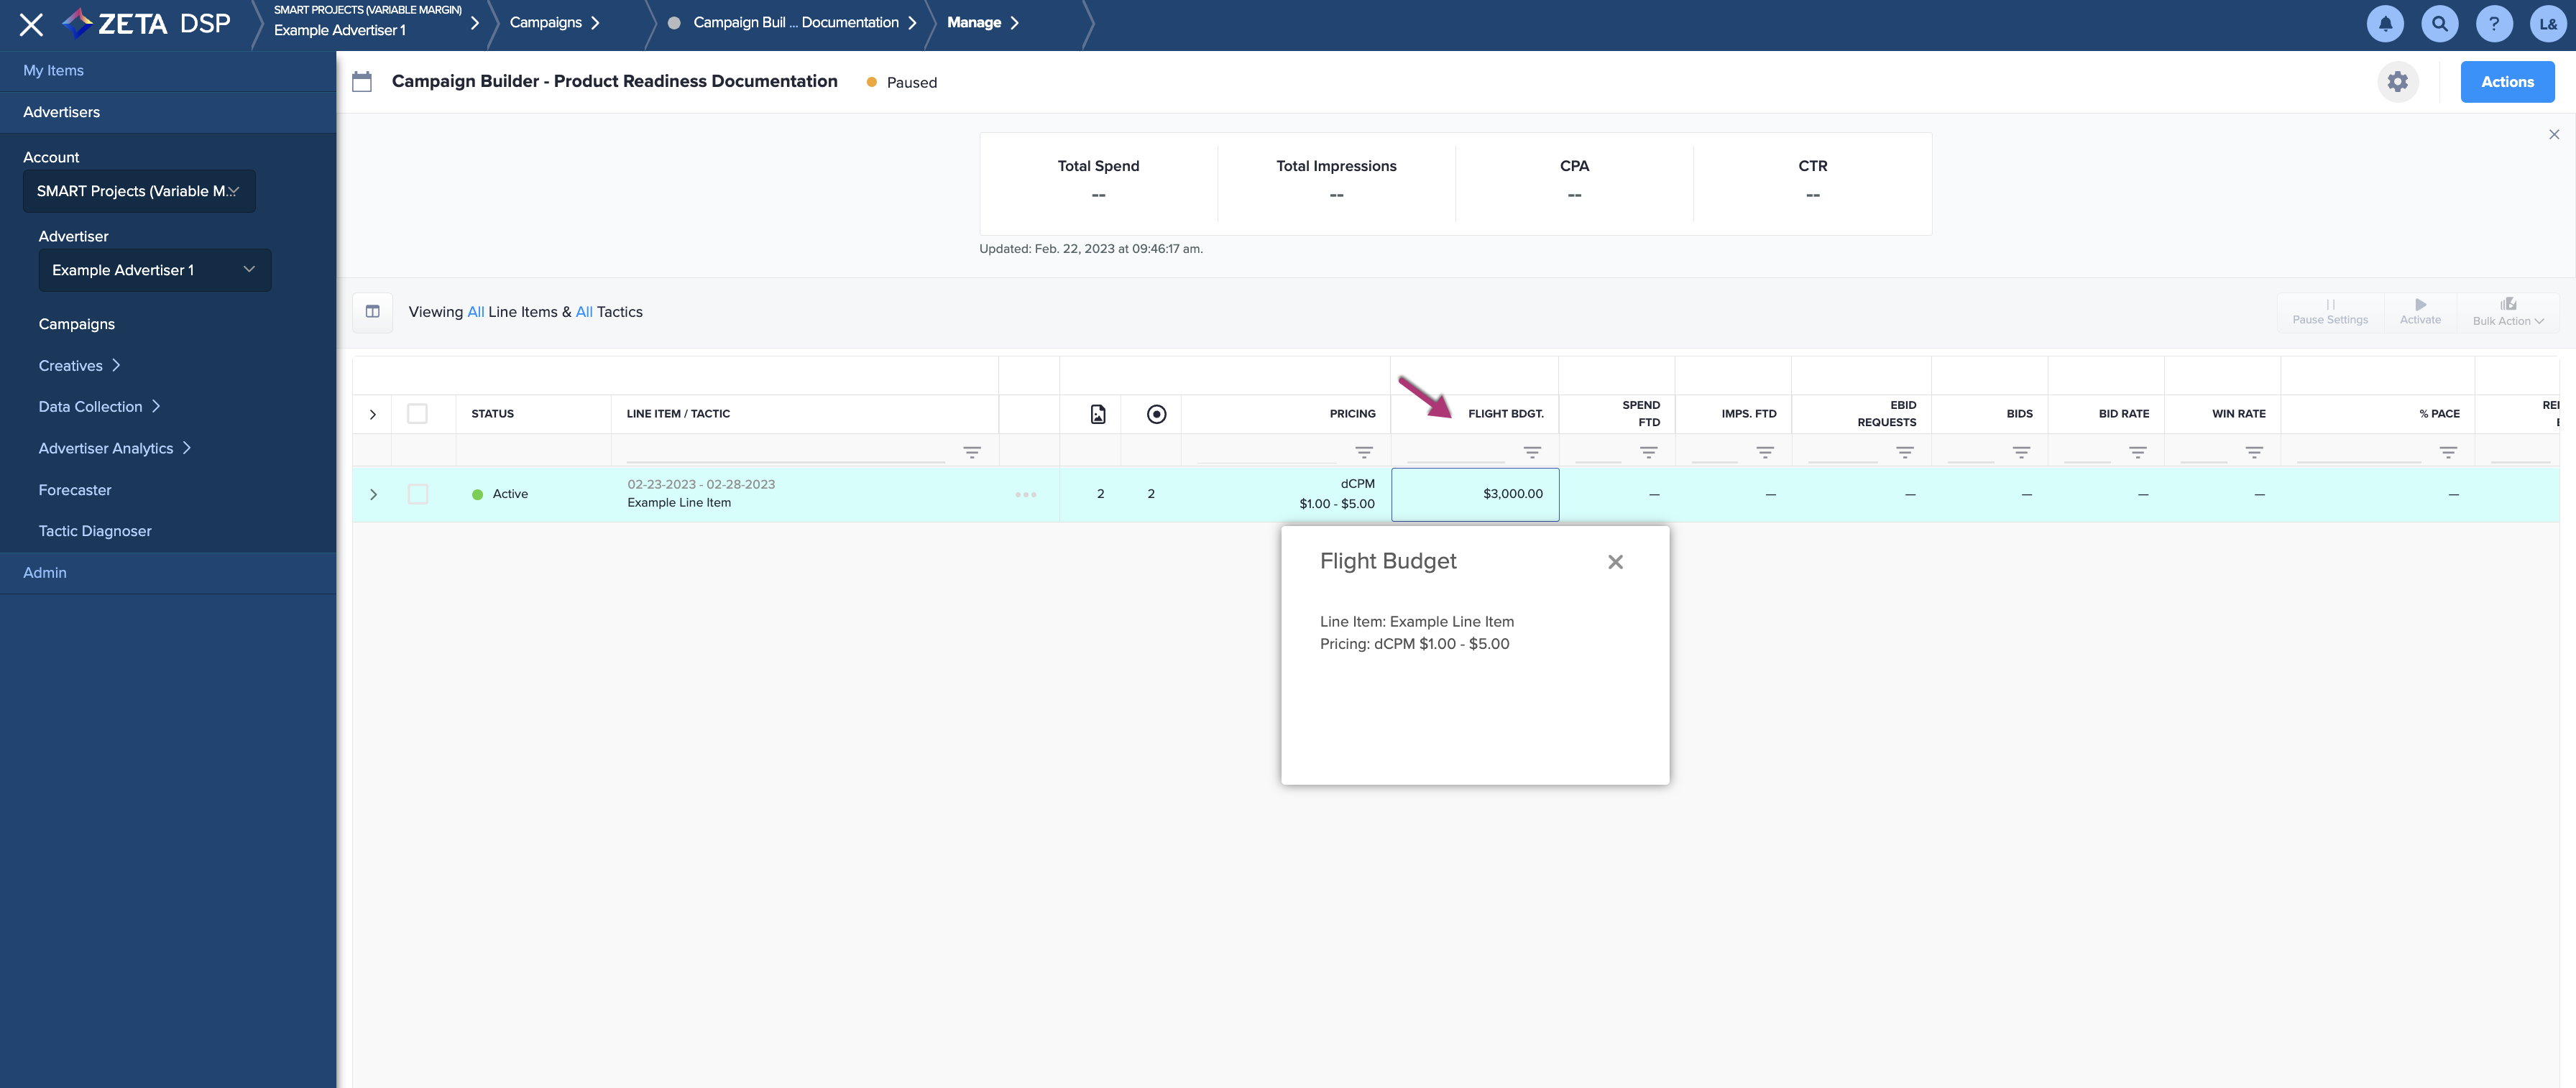
Flight Budget
Click into the Flight Budget column to manually adjust the current flight period's budget.
The other adjacent columns pertaining to the Flight digit are:
|
Column |
Description |
|---|---|
|
Spend FTD |
This column shows the total amount spent so far in the current flight. |
|
Imps FTD |
This column shows the number of impressions served by this campaign so far in the current flight. |
|
Ebid Reqs |
Eligible Bid Requests. The number of bid requests that have been evaluated by the DSP AI after bids that have failed budget allocation pacing checks and targeting mismatches. |
|
Bids |
The number of times an ad from the tactic has been selected for an outgoing bid response to the SSP. |
|
Bid Rate |
The number of bids divided by eligible requests. |
|
Win Rate |
Is the percentage that measures the total number of impressions won divided by the total number of impressions bid on. The number of bid won is not equivalent to the number of impressions served.
|
|
% Pace |
The % Pace column shows how the campaign is pacing in terms of total delivery vs. budgeted delivery. This shows the variance from even pacing for the line-items active flight budget as a whole (Total Spend to Date/Expected Spend to Date). The Pacing chart is color-coded based on how the campaign is pacing. The following bullets explain the color scheme:
To view a day-by-day chart of Pacing, see Toggle Chart for more information. |
|
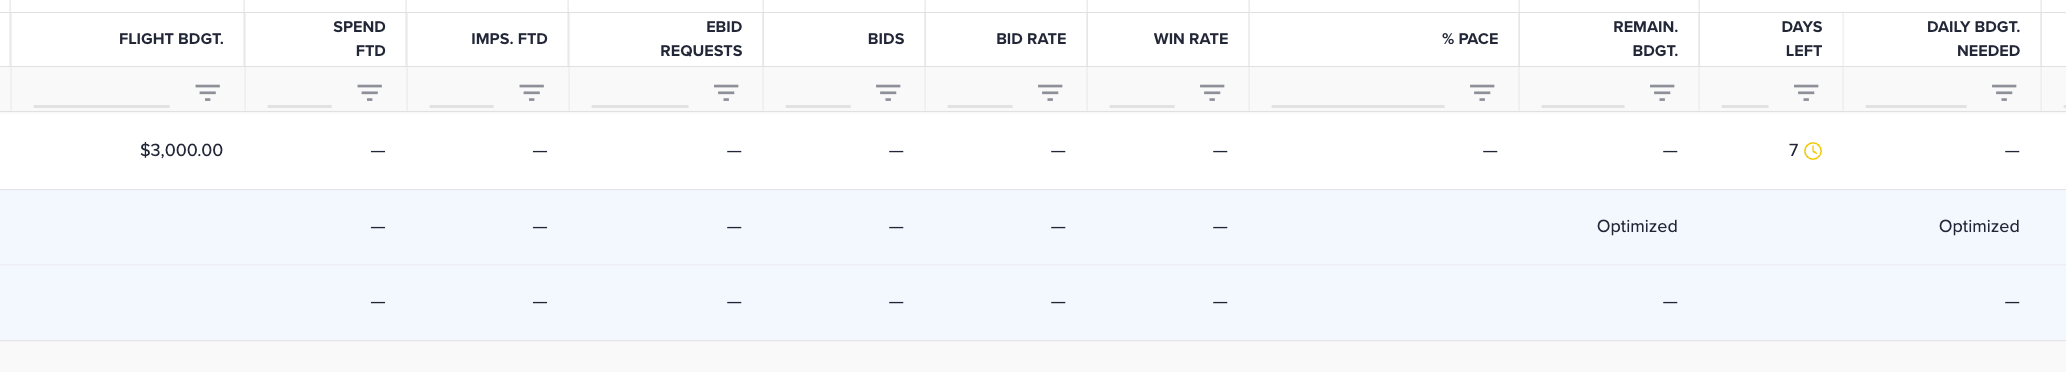
Remaining Budget |
The amount of budgeted dollars (or selected currency) that has not yet been spent. |
|
Days Left |
The number of days left in all scheduled flights. |
|
Daily Budget Needed |
This shows the value of the Remaining Budget / Days Left. This provides an estimate as to how your campaign should pace. |
Daily Budget
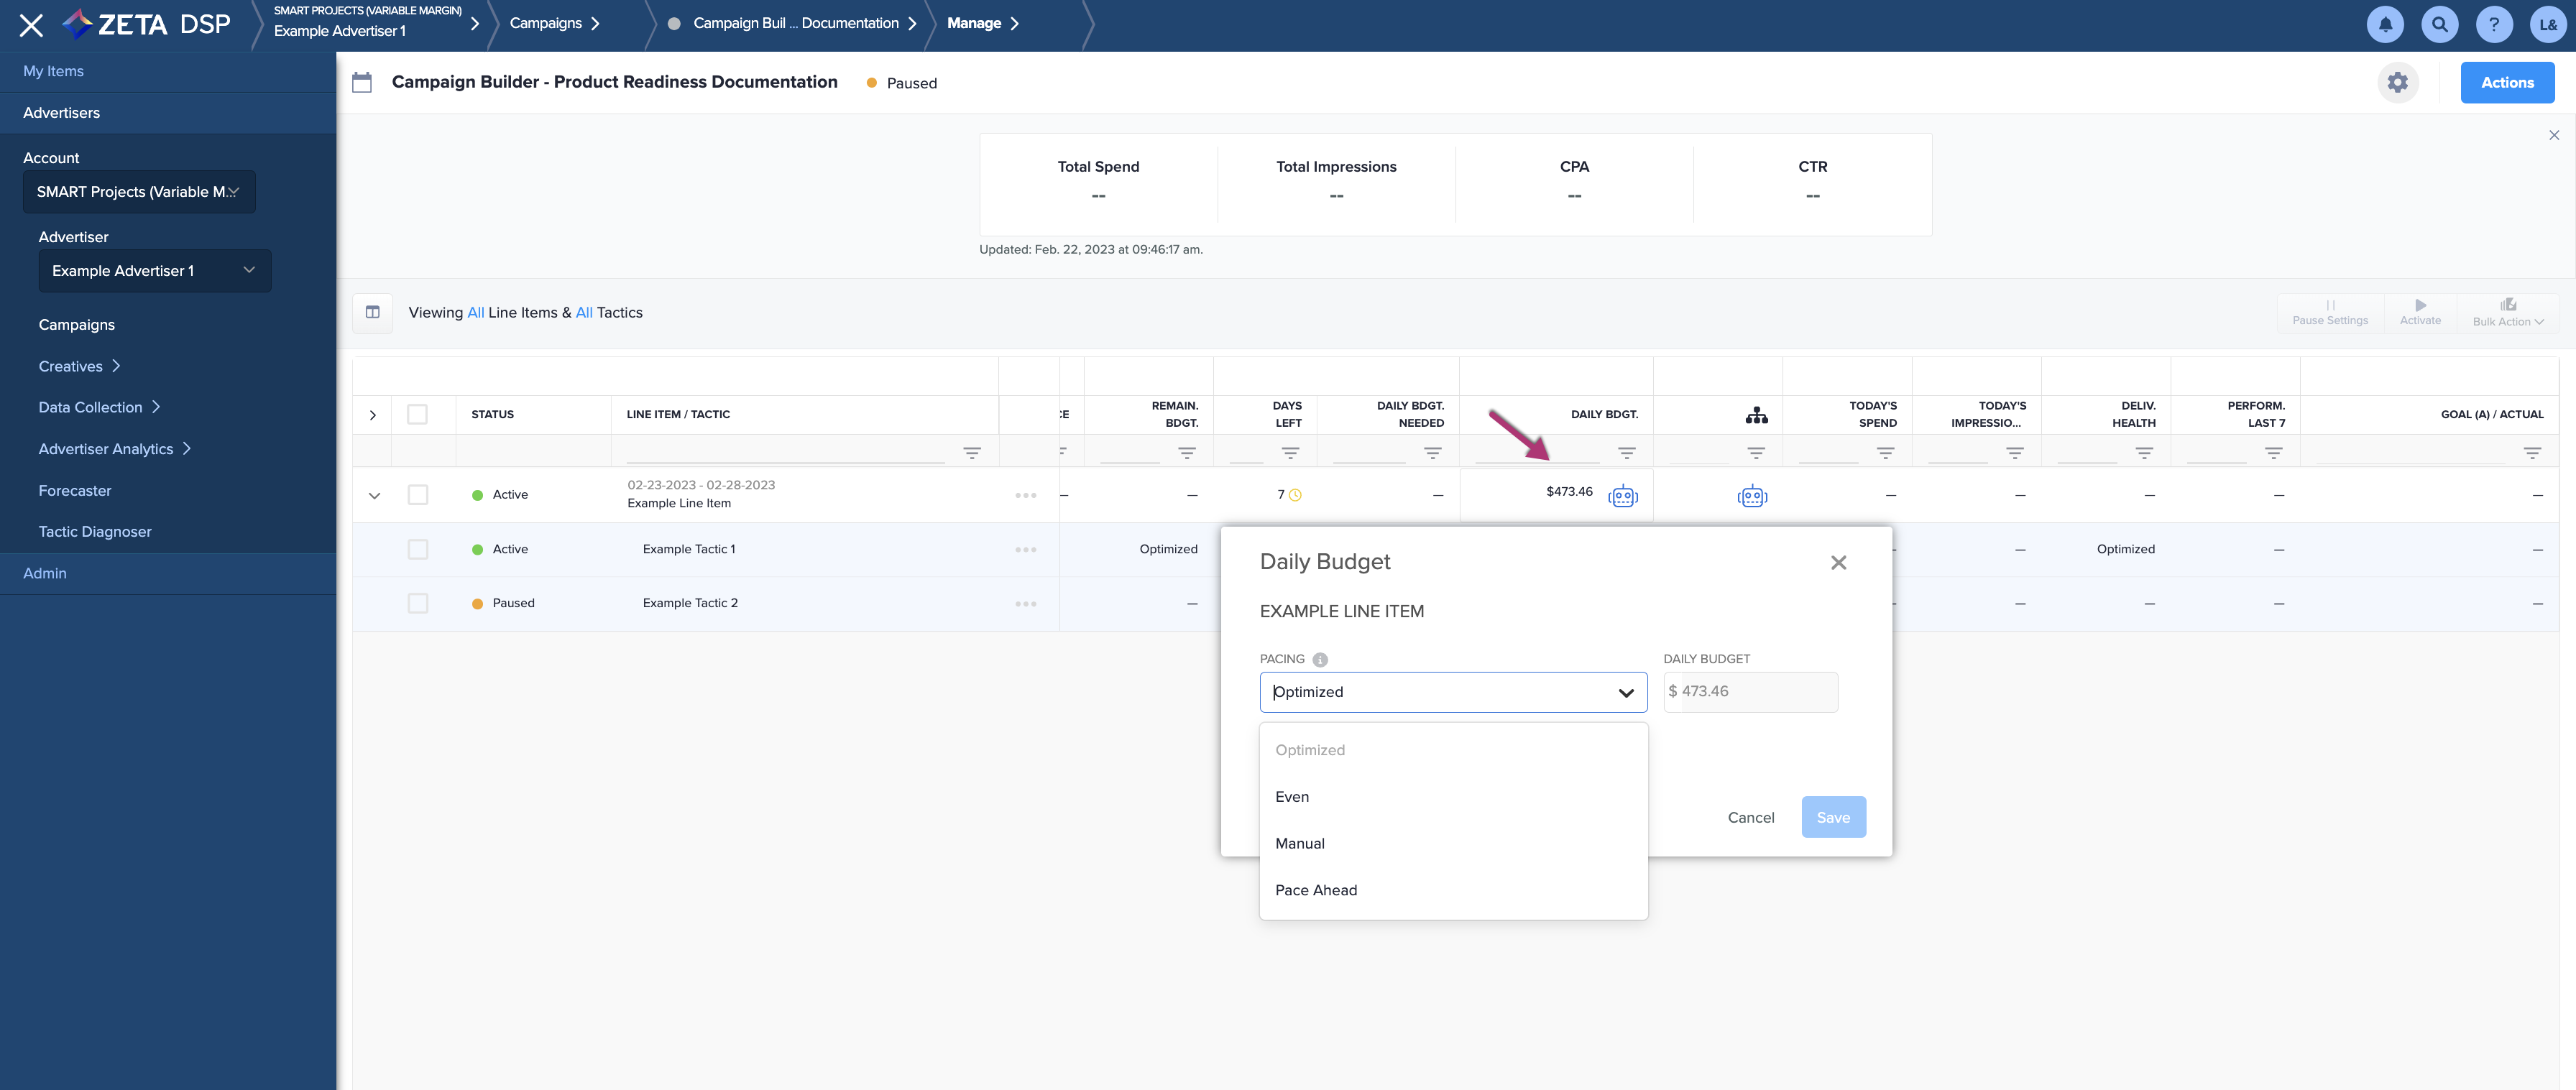
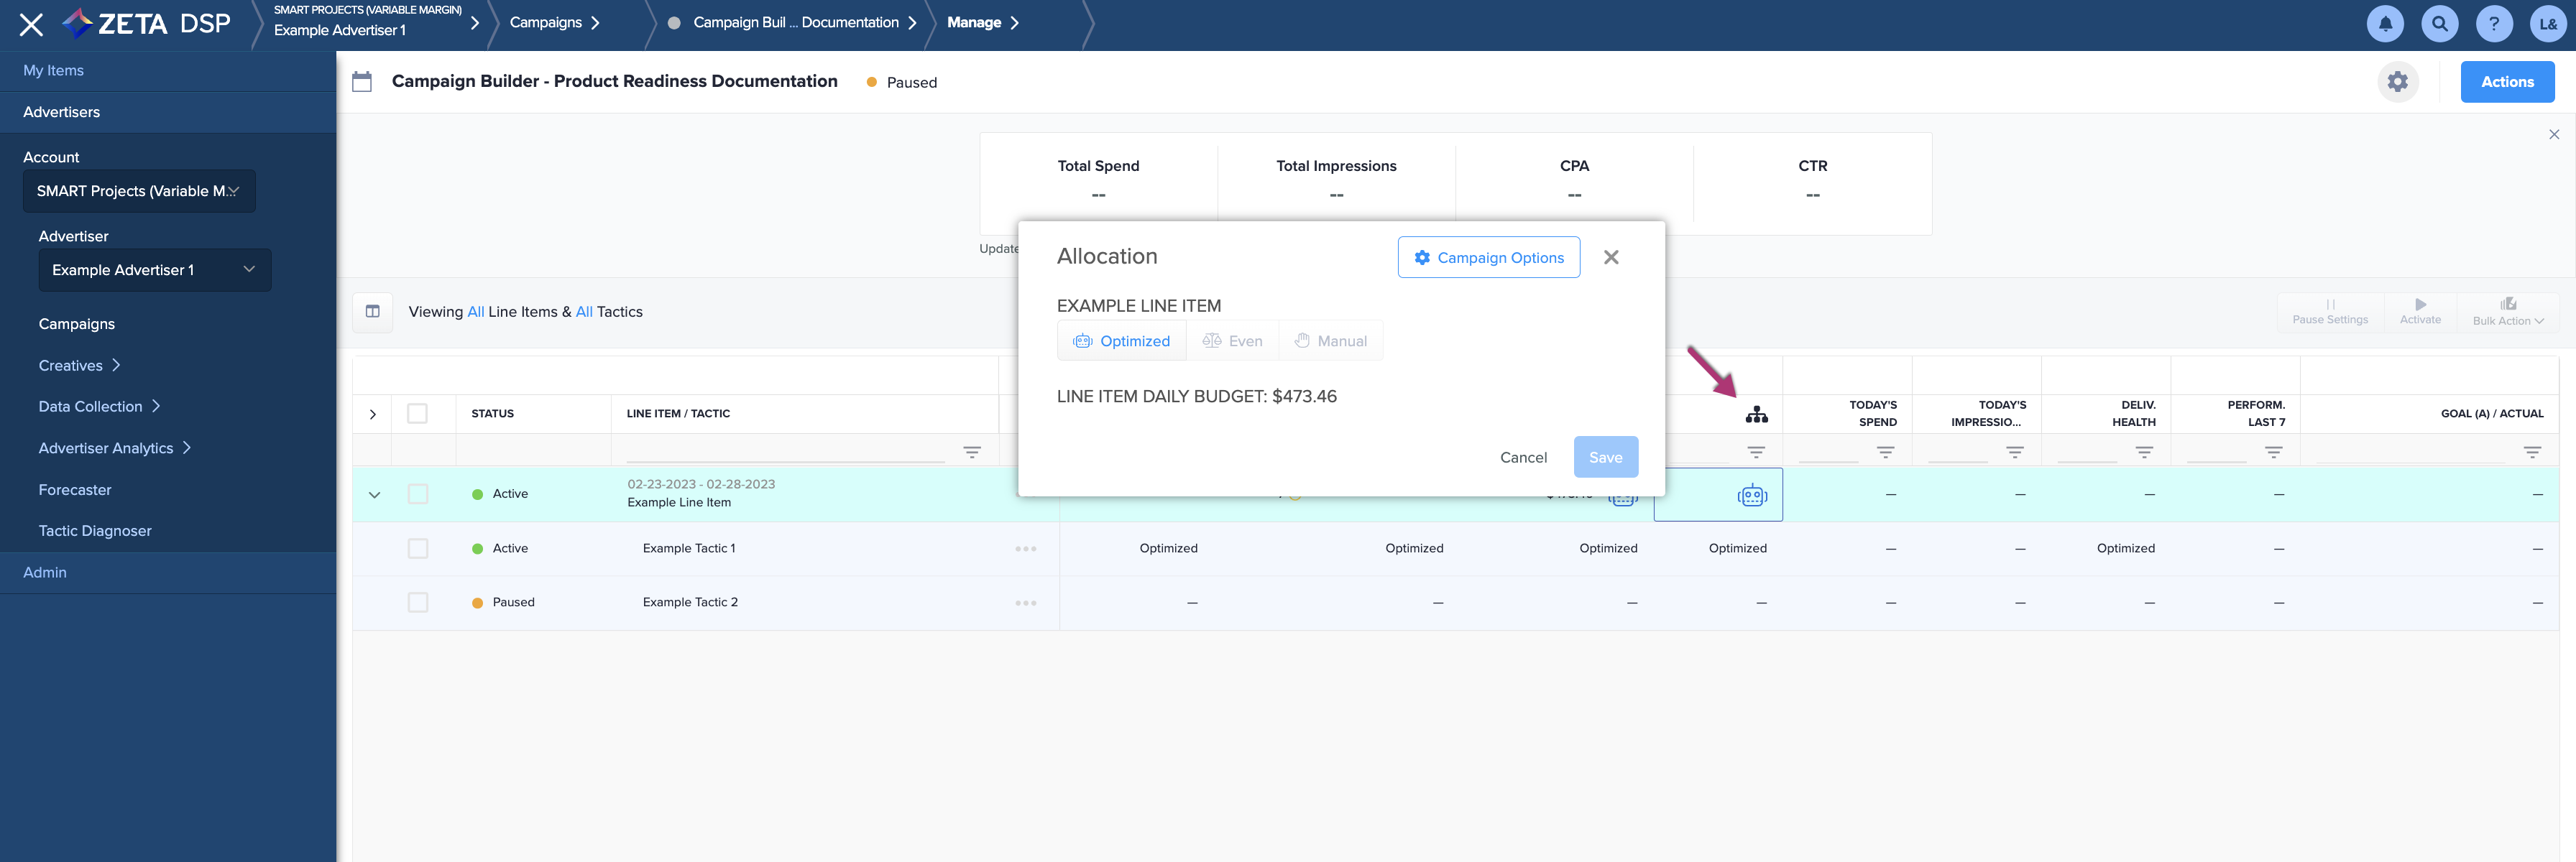
Allocation
The Allocation column shows a flowchart icon in the header. While tactics are allocated among line items, this column shows the icon corresponding to the tactic allocation method for the line item.
-
Click on this icon to adjust the tactic allocation method.
Allocation Methods
|
Allocation Method |
Icon |
Description |
|---|---|---|
|
Even |

|
Each active tactic receives an equal proportion of the budget. Paused tactics do not contribute. When you pause or resume a tactic, the DSP updates the bidding technology immediately. |
|
Manual |

|
When enabled, each tactic is displayed with a corresponding percentage box. Manually enter the percentage of budget that should be allocated to each tactic. |
|
Optimized |

|
Set the Allocation as Optimized to automatically balance spend between the line's tactics. This method lets the DSP AI allocate delivery amongst your tactics to maximize performance. This option leaves it up to the DSP AI technology, which tries to maximize overall performance. The option is similar to the legacy Grouping option. The AI considers all of them when deciding when and how much to bid. |
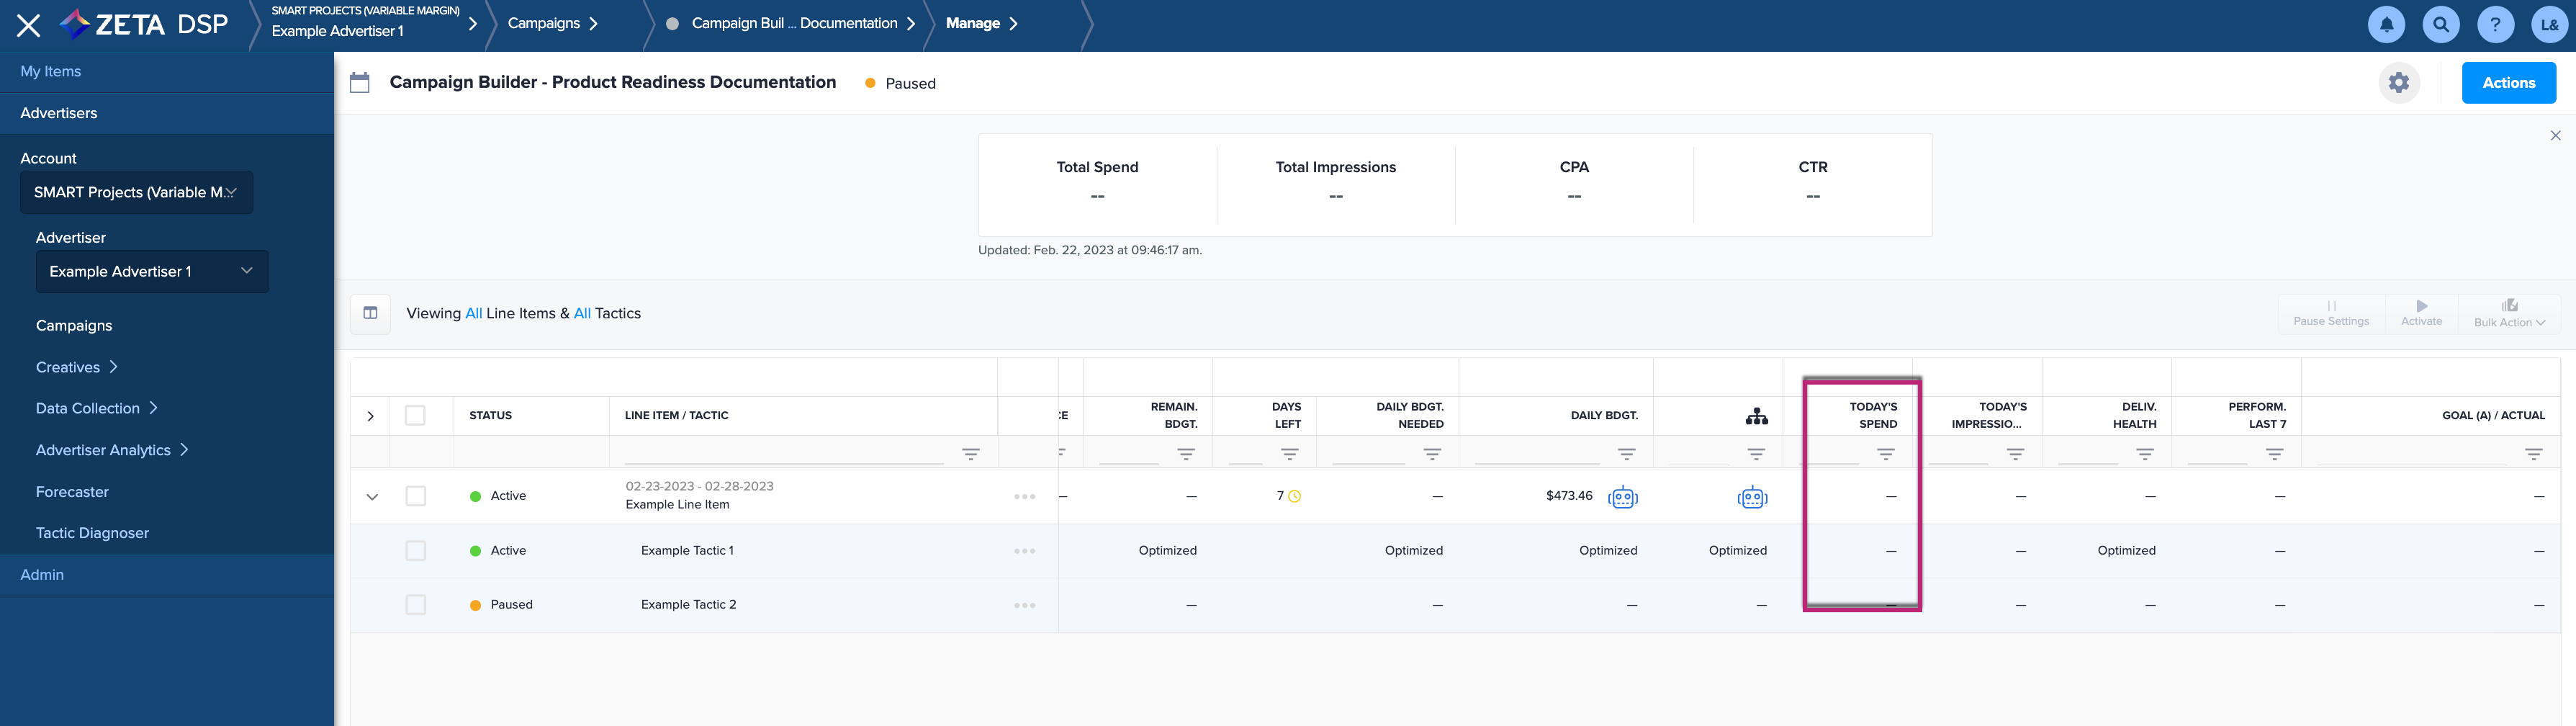
Today's Spend
The amount spent in the last 24 hours.
Delivery Health
This shows how the campaign is delivering. It shows the variance of the spending from the budget over the last three days.

-
Click into the Delivery Health column to show daily delivery details:
Overall Performance
This column shows the overall performance for a line item or tactic over the last 7 days (not including the current day).
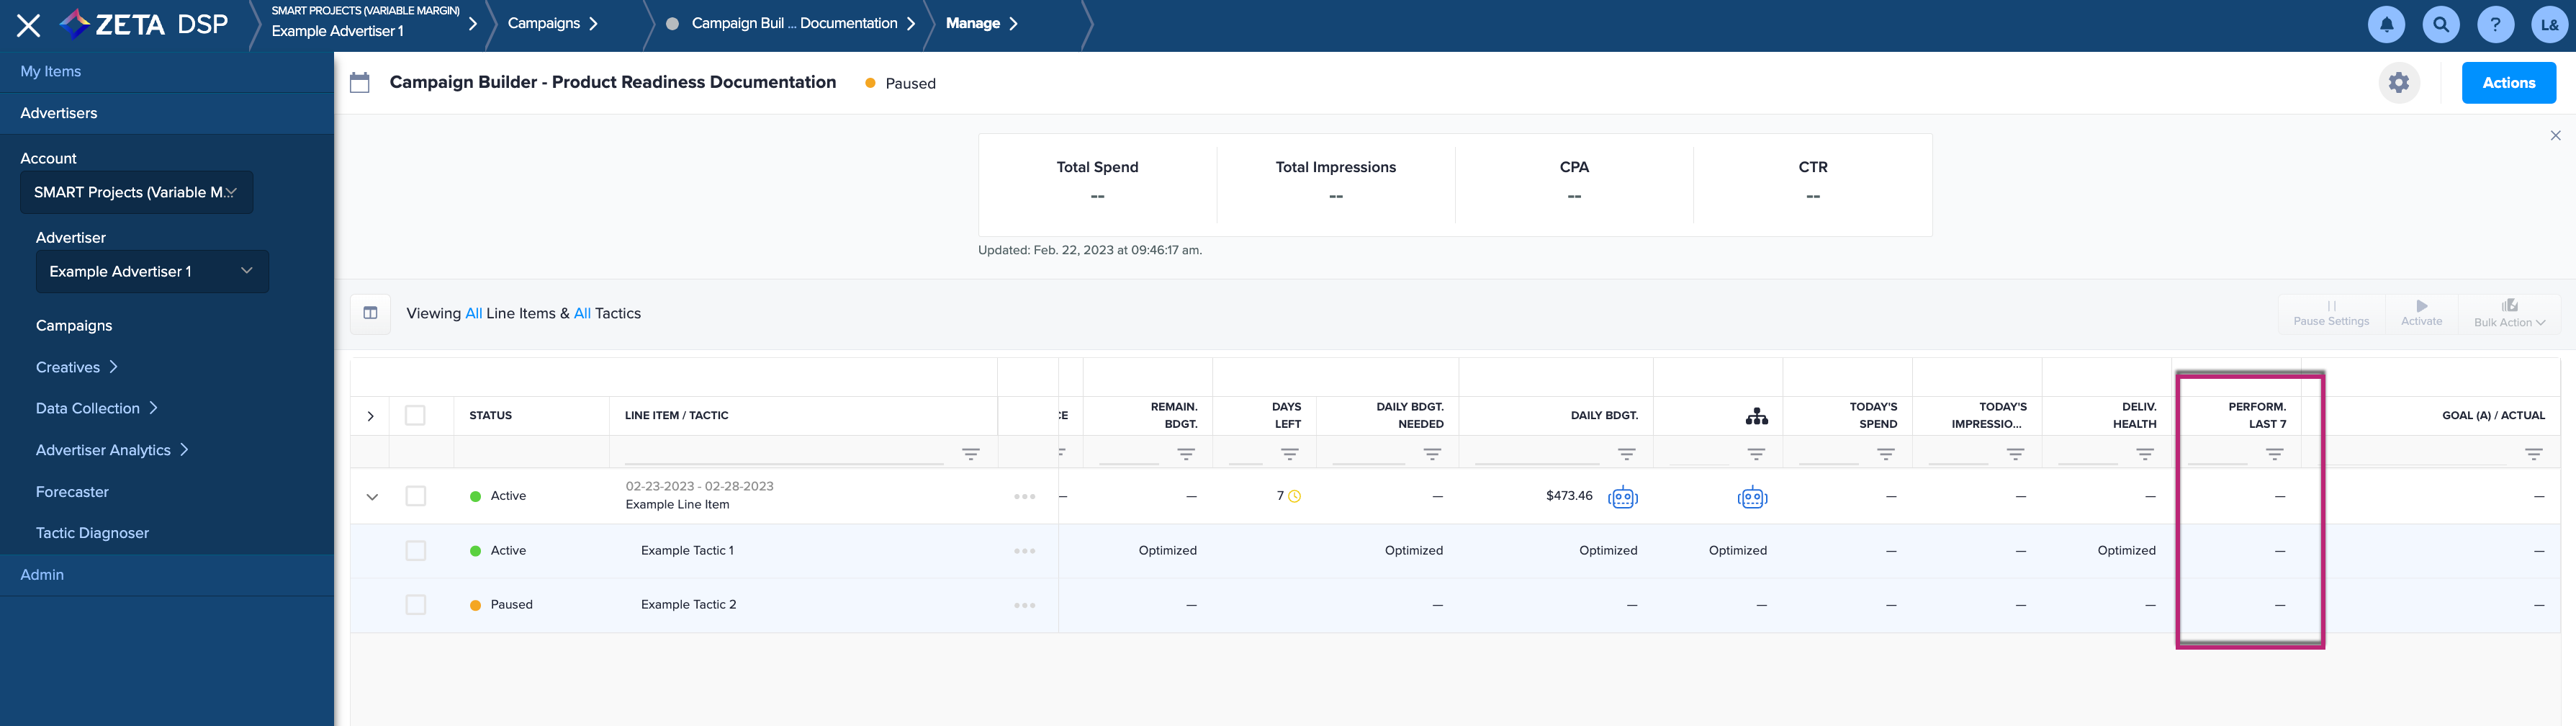
-
The performance is displayed as a percentage in relation to the goals.
-
If one goal is in place on a line item or tactic, the percentage shown is the actual performance compared to the goal. (e.g., the campaign has a single CPA goal of $1, but the CPA over the last 7 days is $5, the column shows 500%)
-
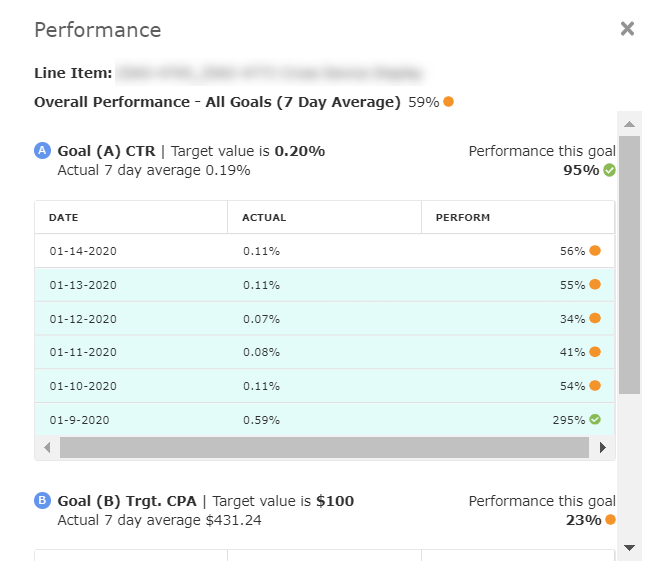
Click into the Overall Performance column to show daily performance details:
Goal A / Actual
The Campaign Grid has a column for each goal assigned to the campaign (or line items and tactics within the campaign). This column shows the goals for each.
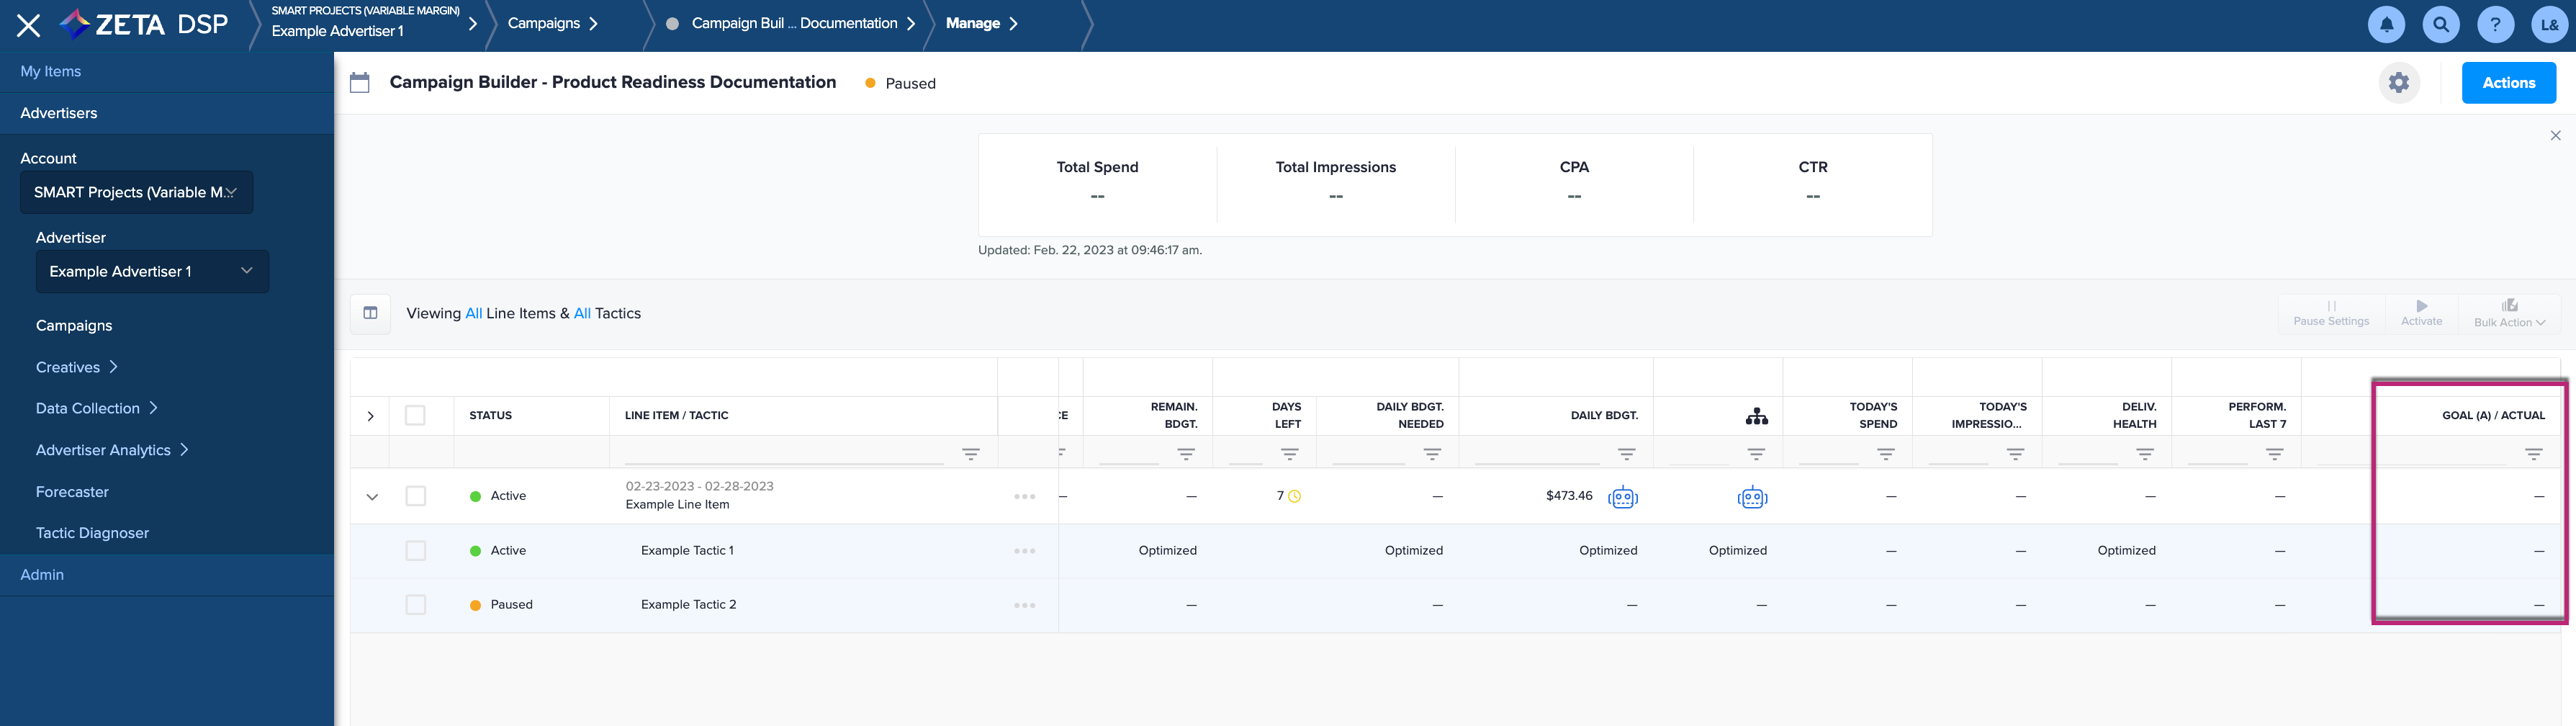
This column shows two values:
-
The Goal (with a link icon when the goal is inherited from a parent level).
-
The Actual Value over the Last 7 Days (not including the current day) as a percentage of that goal.
The color of the icon in this column represents performance:
-
Green: > 90% of Goal
-
Yellow: 90% > 80% of Goal
-
Orange: < 80% of Goal
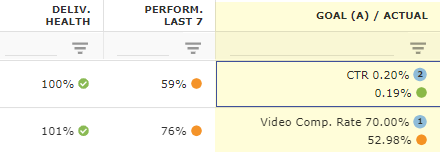
-
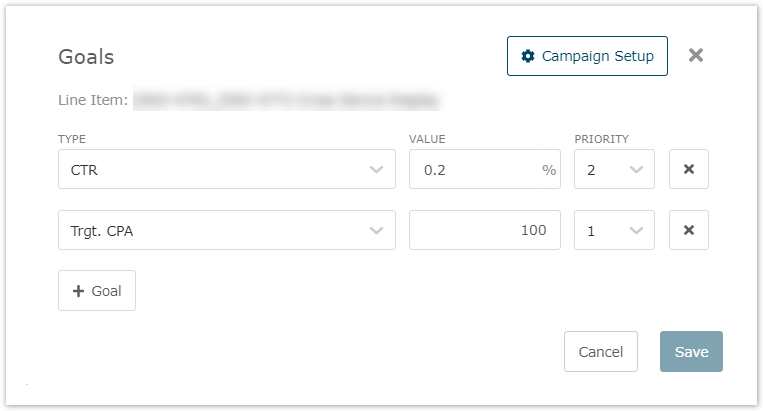
Click on the Goals column to view details. In the Goals pop-up, you can adjust the goal, priority, and value for all line items/tactics that have not yet begun delivering.
|
Multiple Goals Zeta offers the ability to apply multiple goals to your campaigns, line-items, or tactics. This feature allows you to optimize against two or more goals. While achieving all of your goals is an ideal state, this feature allows you to ensure your most important goals are secured first. When multiple goals are in place for a line-item/tactic, the performance % is calculated for each goal and then averaged. For example:
The Zeta DSP averages the bolded percentages above to calculate a 275% performance value. When multiple goals are in place, use the Goal A/Actual column to get a view of how the campaign is performing towards each goal. |