The Toggle Chart feature allows you to quickly view campaign data within the Campaign Grid.
Opening the Chart
By default, the chart is not displayed. To view the chart, select Toggle Chart from the toolbar.
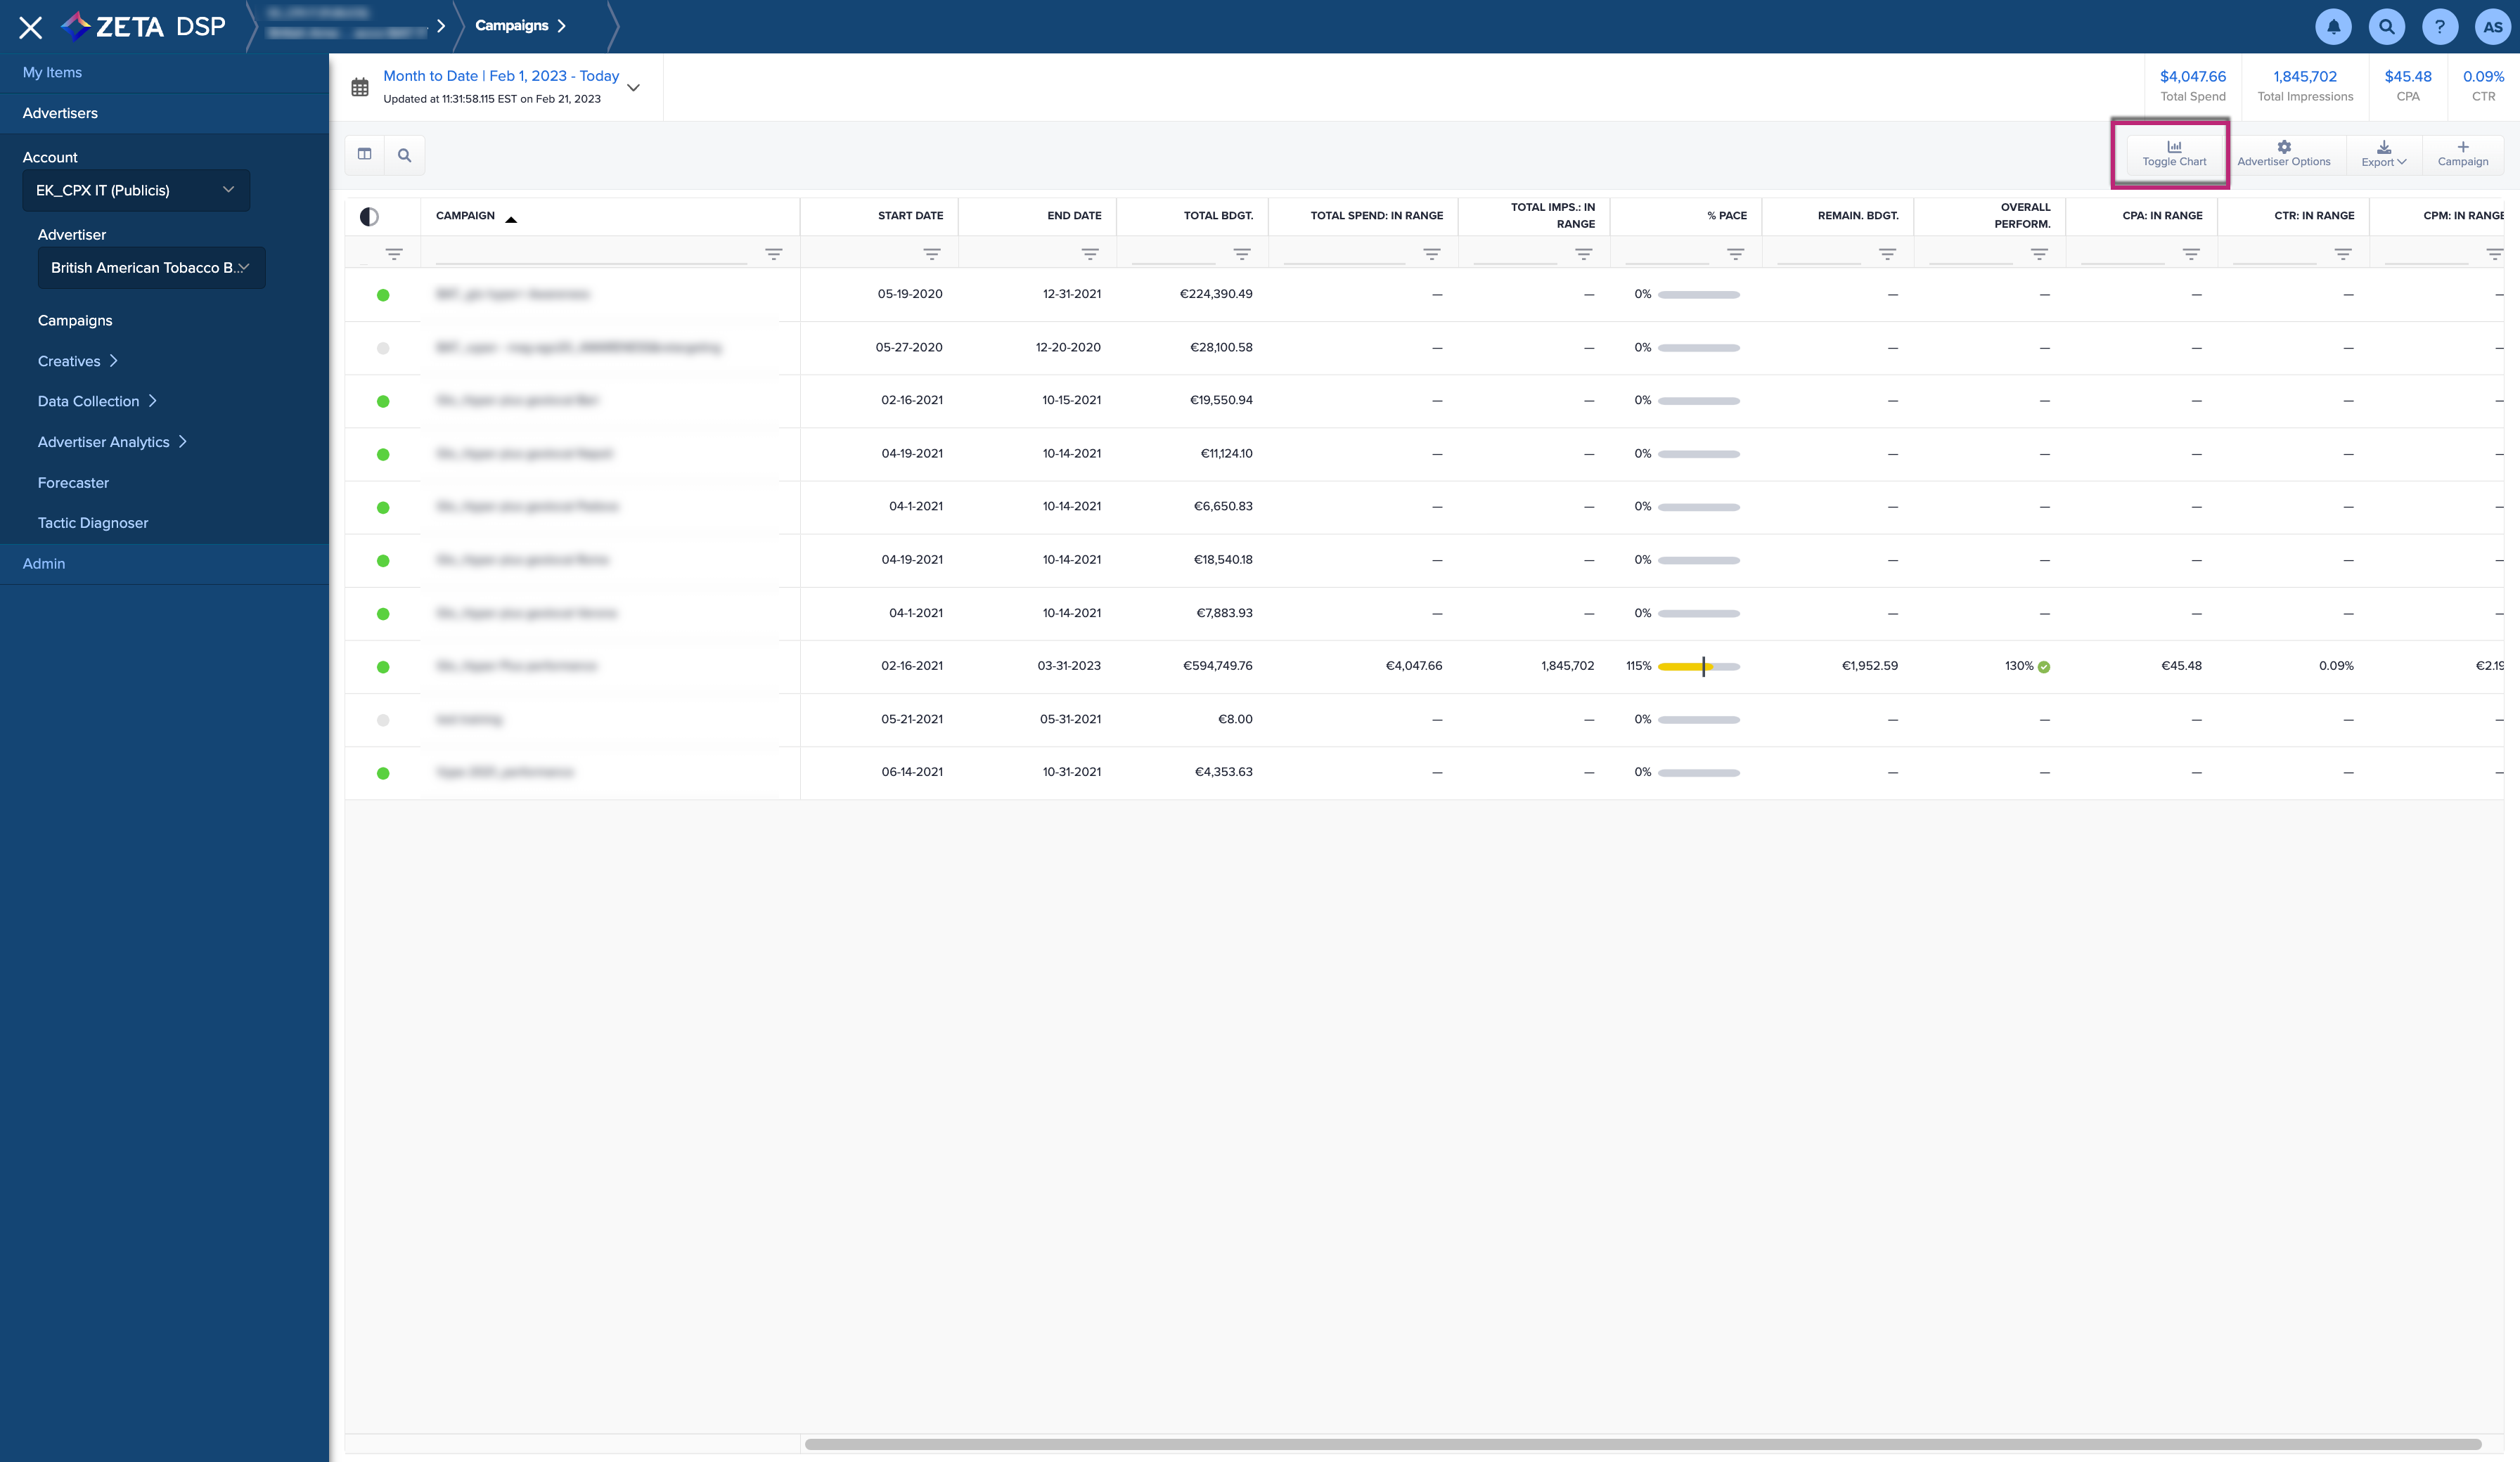
Once the screen loads, adjust your Chart Settings and input a desired date range.
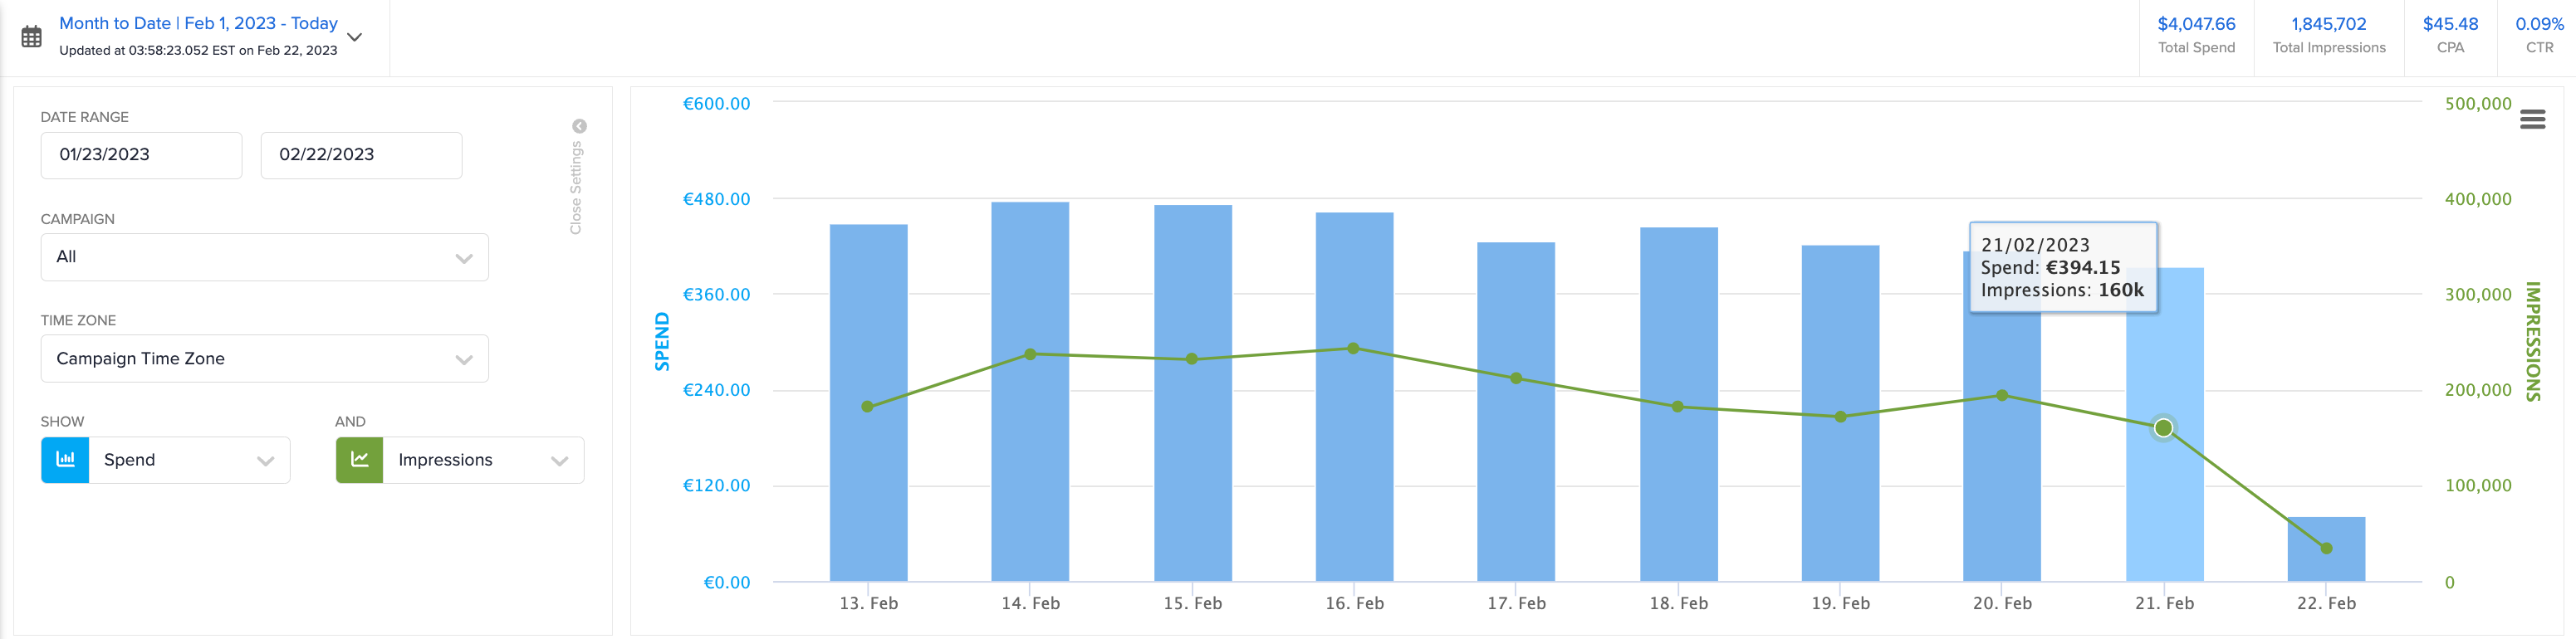
The blue bars indicate spend and the green lines indicate impressions.
Viewing the Chart
Chart Settings
To open the Chart Settings pane, click on Open Settings. To close the Chart Settings pane, click on Close Settings.
-20230215-090335.gif?cb=2388446d9bd04c1a3135ab4886dc1156)
Filter
Filter the chart to display different metrics of all flights and all line items.
-
Filter the date range of the chart by clicking on the date range box to adjust the range the chart displays. The default date range is the campaign start and end dates.
-
Filter the flights contained in the chart by clicking on the flights' menu on the left.
-
Filter the line items shown in the chart by clicking on the line-item menu on the left.
-
Filter the display of metrics in the chart by clicking the dropdown for the SHOW and AND menus.
Zoom
To zoom in on a particular data set, simply click and drag your cursor across an area at which you'd like to take a closer look. To reset after zooming in, click on Reset Zoom.
.gif?cb=418db25b0406623e21705eece0c0179b)
Hover
To view more information on a single data point, hover over the green dot.

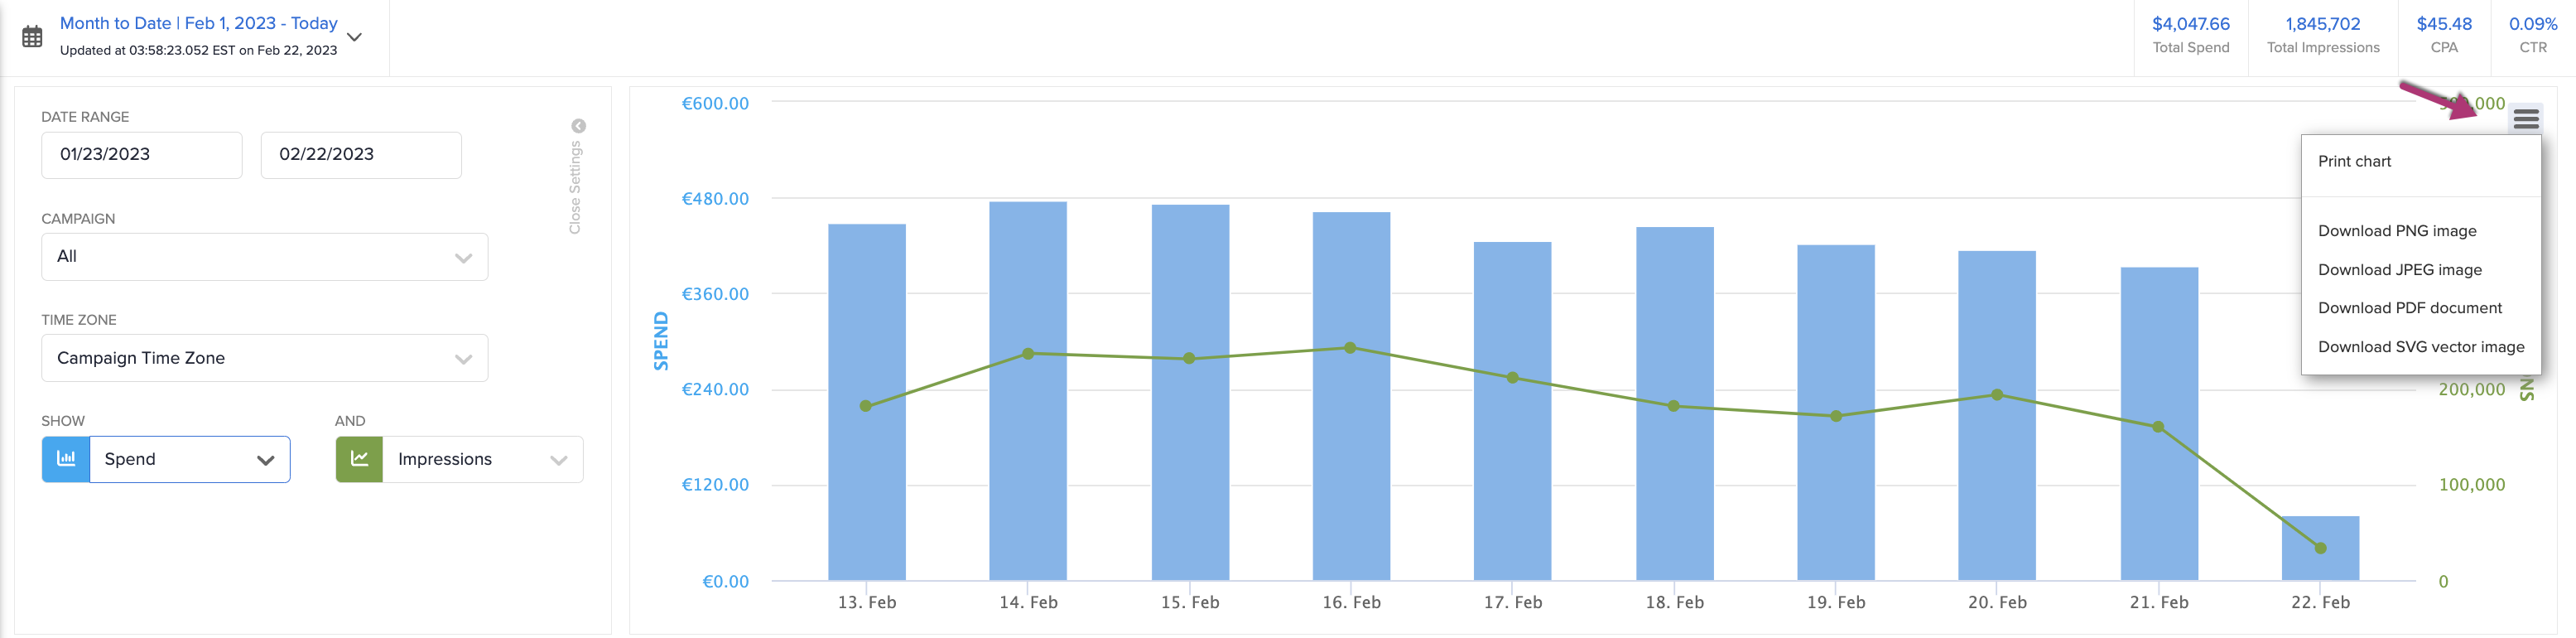
Download
To download the chart, click on the burger menu icon at the upper-right corner and select the appropriate file type from the drop-down.