Cross Device Insights

Cross-Device Insights allows you to view cross device data about your customers; the devices they use and the ways that they use them.
Navigation
1. Click on the DSP logo in the upper left corner. Within the menu that appears for Advertisers and Admin, select the Account that contains your advertiser, and then select your Advertiser.
2. As the Advertiser’s campaigns are displayed, select the campaign you would like to view from the list.
3. With the campaign open, click on the breadcrumb menu atop the page and select Manage > Campaign Analytics > Cross-Device.
.gif?inst-v=4e373ee2-4eb7-488f-a13a-7462831449ae)
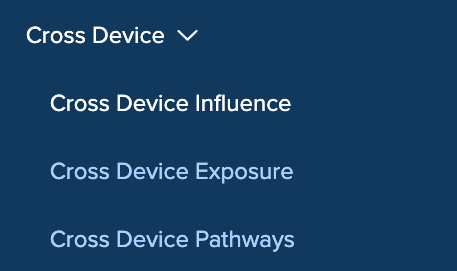
The Cross-Device drop-down allows you to view the following reports:

Cross-Device Influence: How often the campaign is reaching ad viewers on multiple devices, and at what costs.
Cross-Device Exposure: Reports on the campaign's admix in terms of devices, including cross-device exposure.
Cross-Device Pathways: View the paths customers took to conversion and the relative frequency of each pathway.
Cross-Device conversions can take between 24 and 48 hours to appear in your Insights reports.
Cross-Device Influence Report
Unified profiles correspond to the users that Zeta recognizes on more than one device. Use Cross-Device Influence to see how frequently the Zeta AI takes advantage of the cross-device information.
1. From the breadcrumb menu atop the screen, select Manage > Campaign Analytics > Cross Device > Cross-Device Influence to view the report.
2. Click on the Date Picker to select a date range. The platform updates the graphs to use only data from this time period. The report contains four graphs, each displayed below:

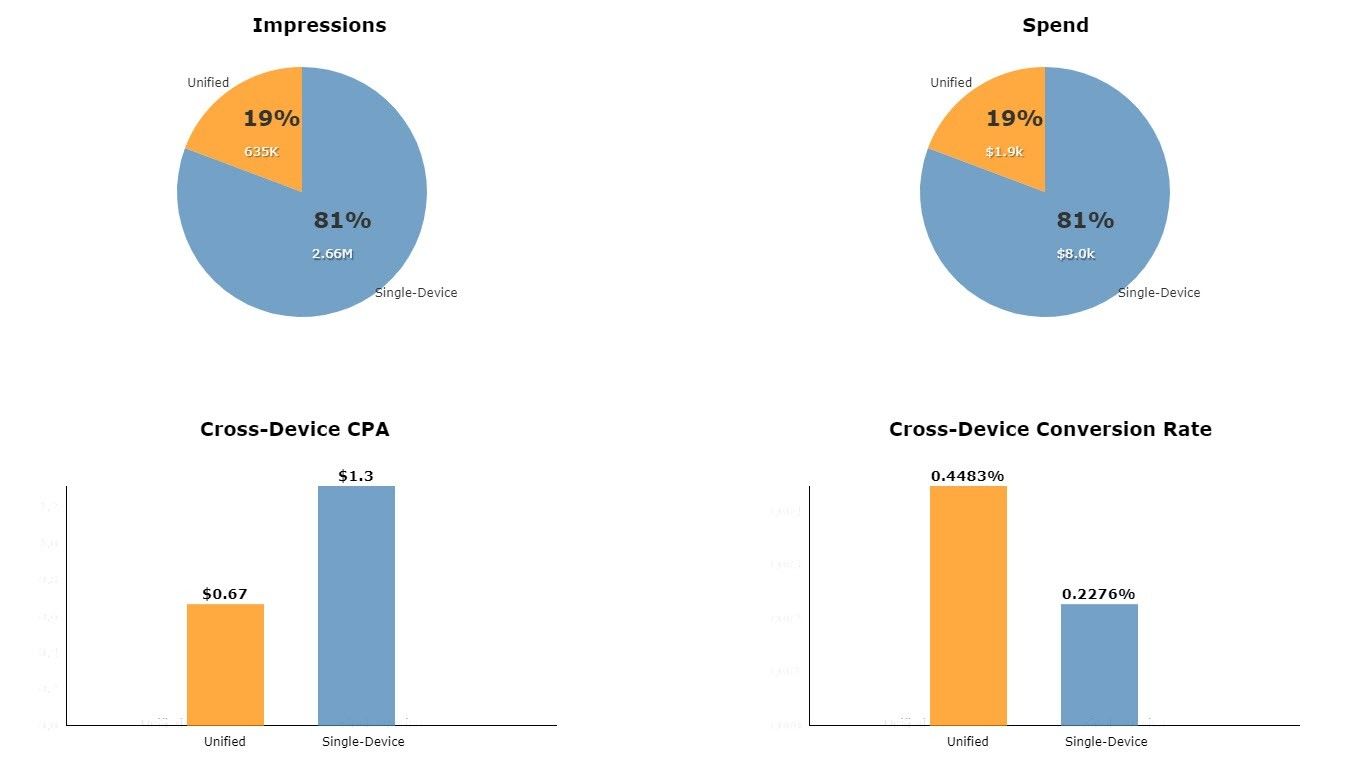
Impressions | This graph breaks down the impressions the campaign served to Unified Profiles vs. those served to Single-Device Profiles. |
Spend | This graph displays Campaign Spend to Unified Profiles vs. Single-Device Profiles. |
Cross-Device CPA | Displays Cost per Action for Unified Profiles vs. Single-Device Profiles. For example, the figure above reflects that Zeta delivered at a CPA of $0.67 to consumers having Unified (cross-device) Profiles, as compared to a CPA of $1.30 to consumers having only Single-Device Profiles. |
Cross-Device Conversion Rate | Displays Conversion Rate for Unified Profiles vs. Single-Device Profiles. As the AI leverages the cross-device profile data to drive the most efficient outcome, only 1-3% of these unified users actually see a particular campaign’s ads on more than one device. |
Cross-Device Exposure Report
The Cross-Device Exposure displays the ad delivery mix of devices for the current campaign as a Venn diagram. Areas of overlap indicate the number and percentage of users who have been identified and measured on the overlapping devices.
1. From the breadcrumb menu atop the screen, select Manage > Campaign Analytics > Cross Device > Cross-Device Exposure to view the report.
2. Click on the Date Picker to select a date range. The platform updates the graphs to use only data from this time period.
.gif?inst-v=4e373ee2-4eb7-488f-a13a-7462831449ae)
3. Additionally, select Metrics, Mobile iOS, and Currency.
Metrics |
|---|
The Metrics menu allows you to change the metrics in the diagram. Options include Impressions, Clicks, Spend, Conversions, CPA, Cross-Device Conversions and Cross-Device CPA.  |
Mobile iOS |
Choose the operating system data in the graph:
 |
Currency |
For campaigns using a currency other than the US dollar, click on the currency type to use in the diagram.  |
Cross-Device Pathways Report
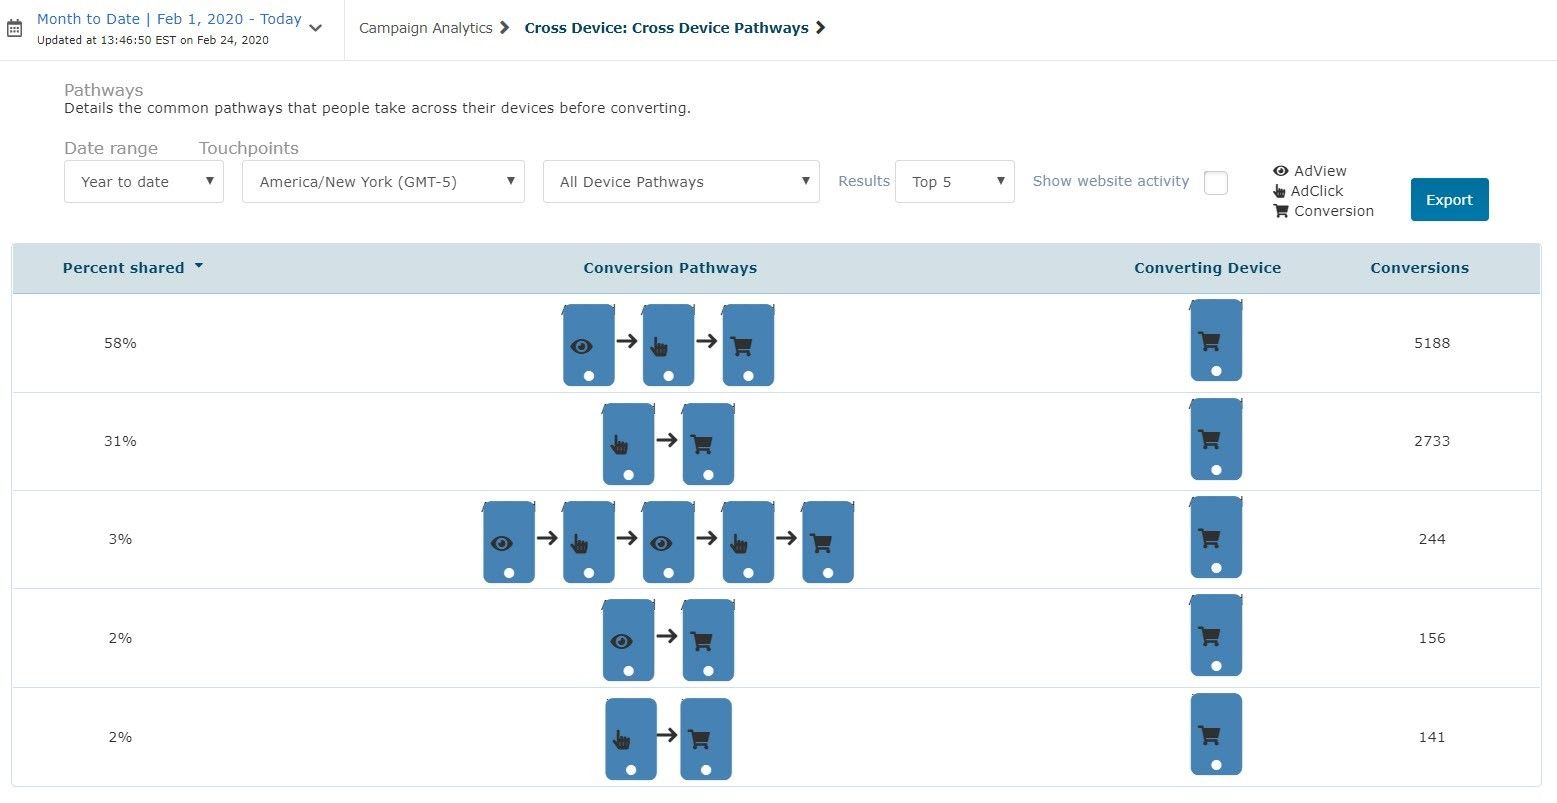
The Cross-Device Pathways display the paths customers took to conversion and the relative frequency of each pathway.
1. From the breadcrumb menu atop the screen, select Manage > Campaign Analytics > Cross Device > Cross-Device Pathways to view the report.
2. Click on the Date Picker to select a date range. The platform updates the graphs to use only data from this time period.
3. Navigate to the Device Pathways drop-down in the Touchpoints area, and select to use one of the following: All Device Pathways, Multiple Device Pathways Only, or Single Device Pathways Only.

Check the Show website activity box to include tracking events, i.e. when a tracking pixel detected the customer on the advertiser’s website. Clear the box to focus on just impressions, clicks, and conversions.
Column Descriptions | |
|---|---|
Percent shared | The values in this column indicate the percentage of all conversions that followed the corresponding pathway. You can use this column to sort the table. |
Conversion Pathways | This column displays the paths customers took to conversion. A path can include many different devices and different types of devices. The platform indicates device type via icon and label. As the figure above shows, types include Desktop, Android tablet, Android phone, iPad, and iPhone. The devices in this column also indicate the type of interaction, according to the following legend: 
When a customer has more than one interaction with the same type of device, these interactions do not necessarily represent the same physical device. |
Converting Device | This column displays the device of conversion. You can sort this column, which allows you to order your devices by conversions. |
Conversions | This column displays the actual number of conversions that followed the corresponding pathway. This uses the Advertiser XD Conversion metric. |
Export | Click on Export to save the current Pathways table to a CSV file appropriate for viewing with spreadsheet software. The file name is Pathways is followed by the Advertiser name. |
