PersonaPulse

PersonaPulse is a tool within the ZMP Opportunity Explorer that uses Zeta’s psychographic intelligence to help you find high-value prospects who will align with your brand's values.
Psychographics is Zeta’s method for identifying the real values consumers express through behavior, guiding both precise targeting and message development to improve campaign performance.
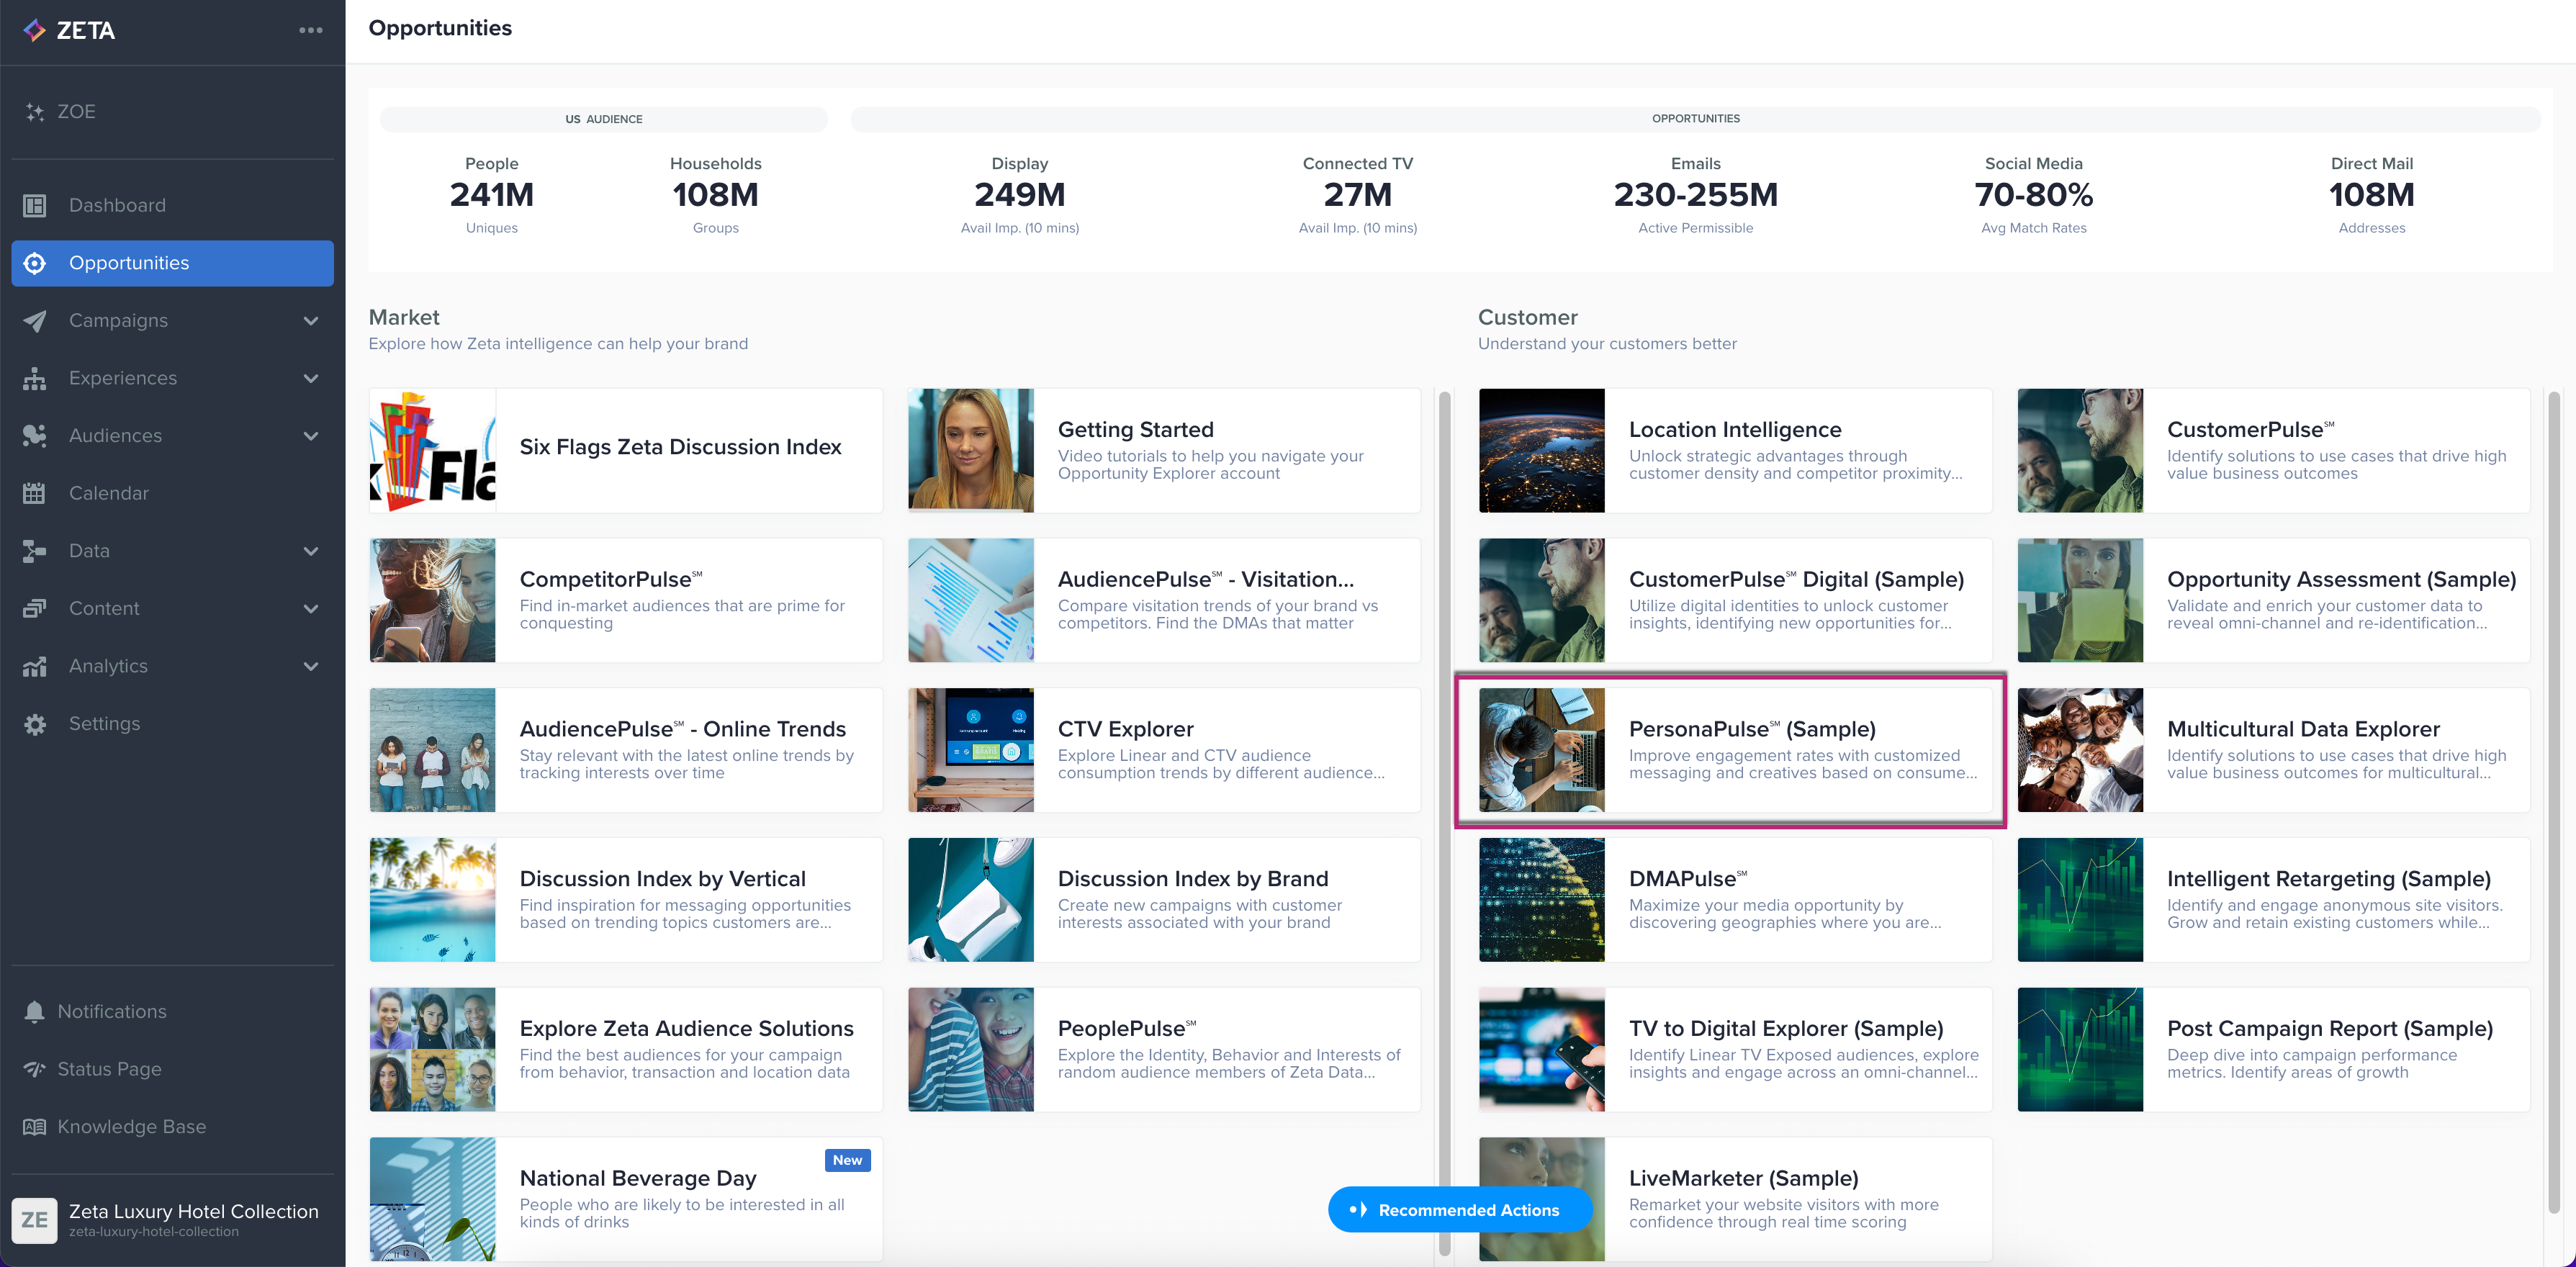
1. From the Opportunities page, navigate to the PersonaPulse tab under Customer Insights.
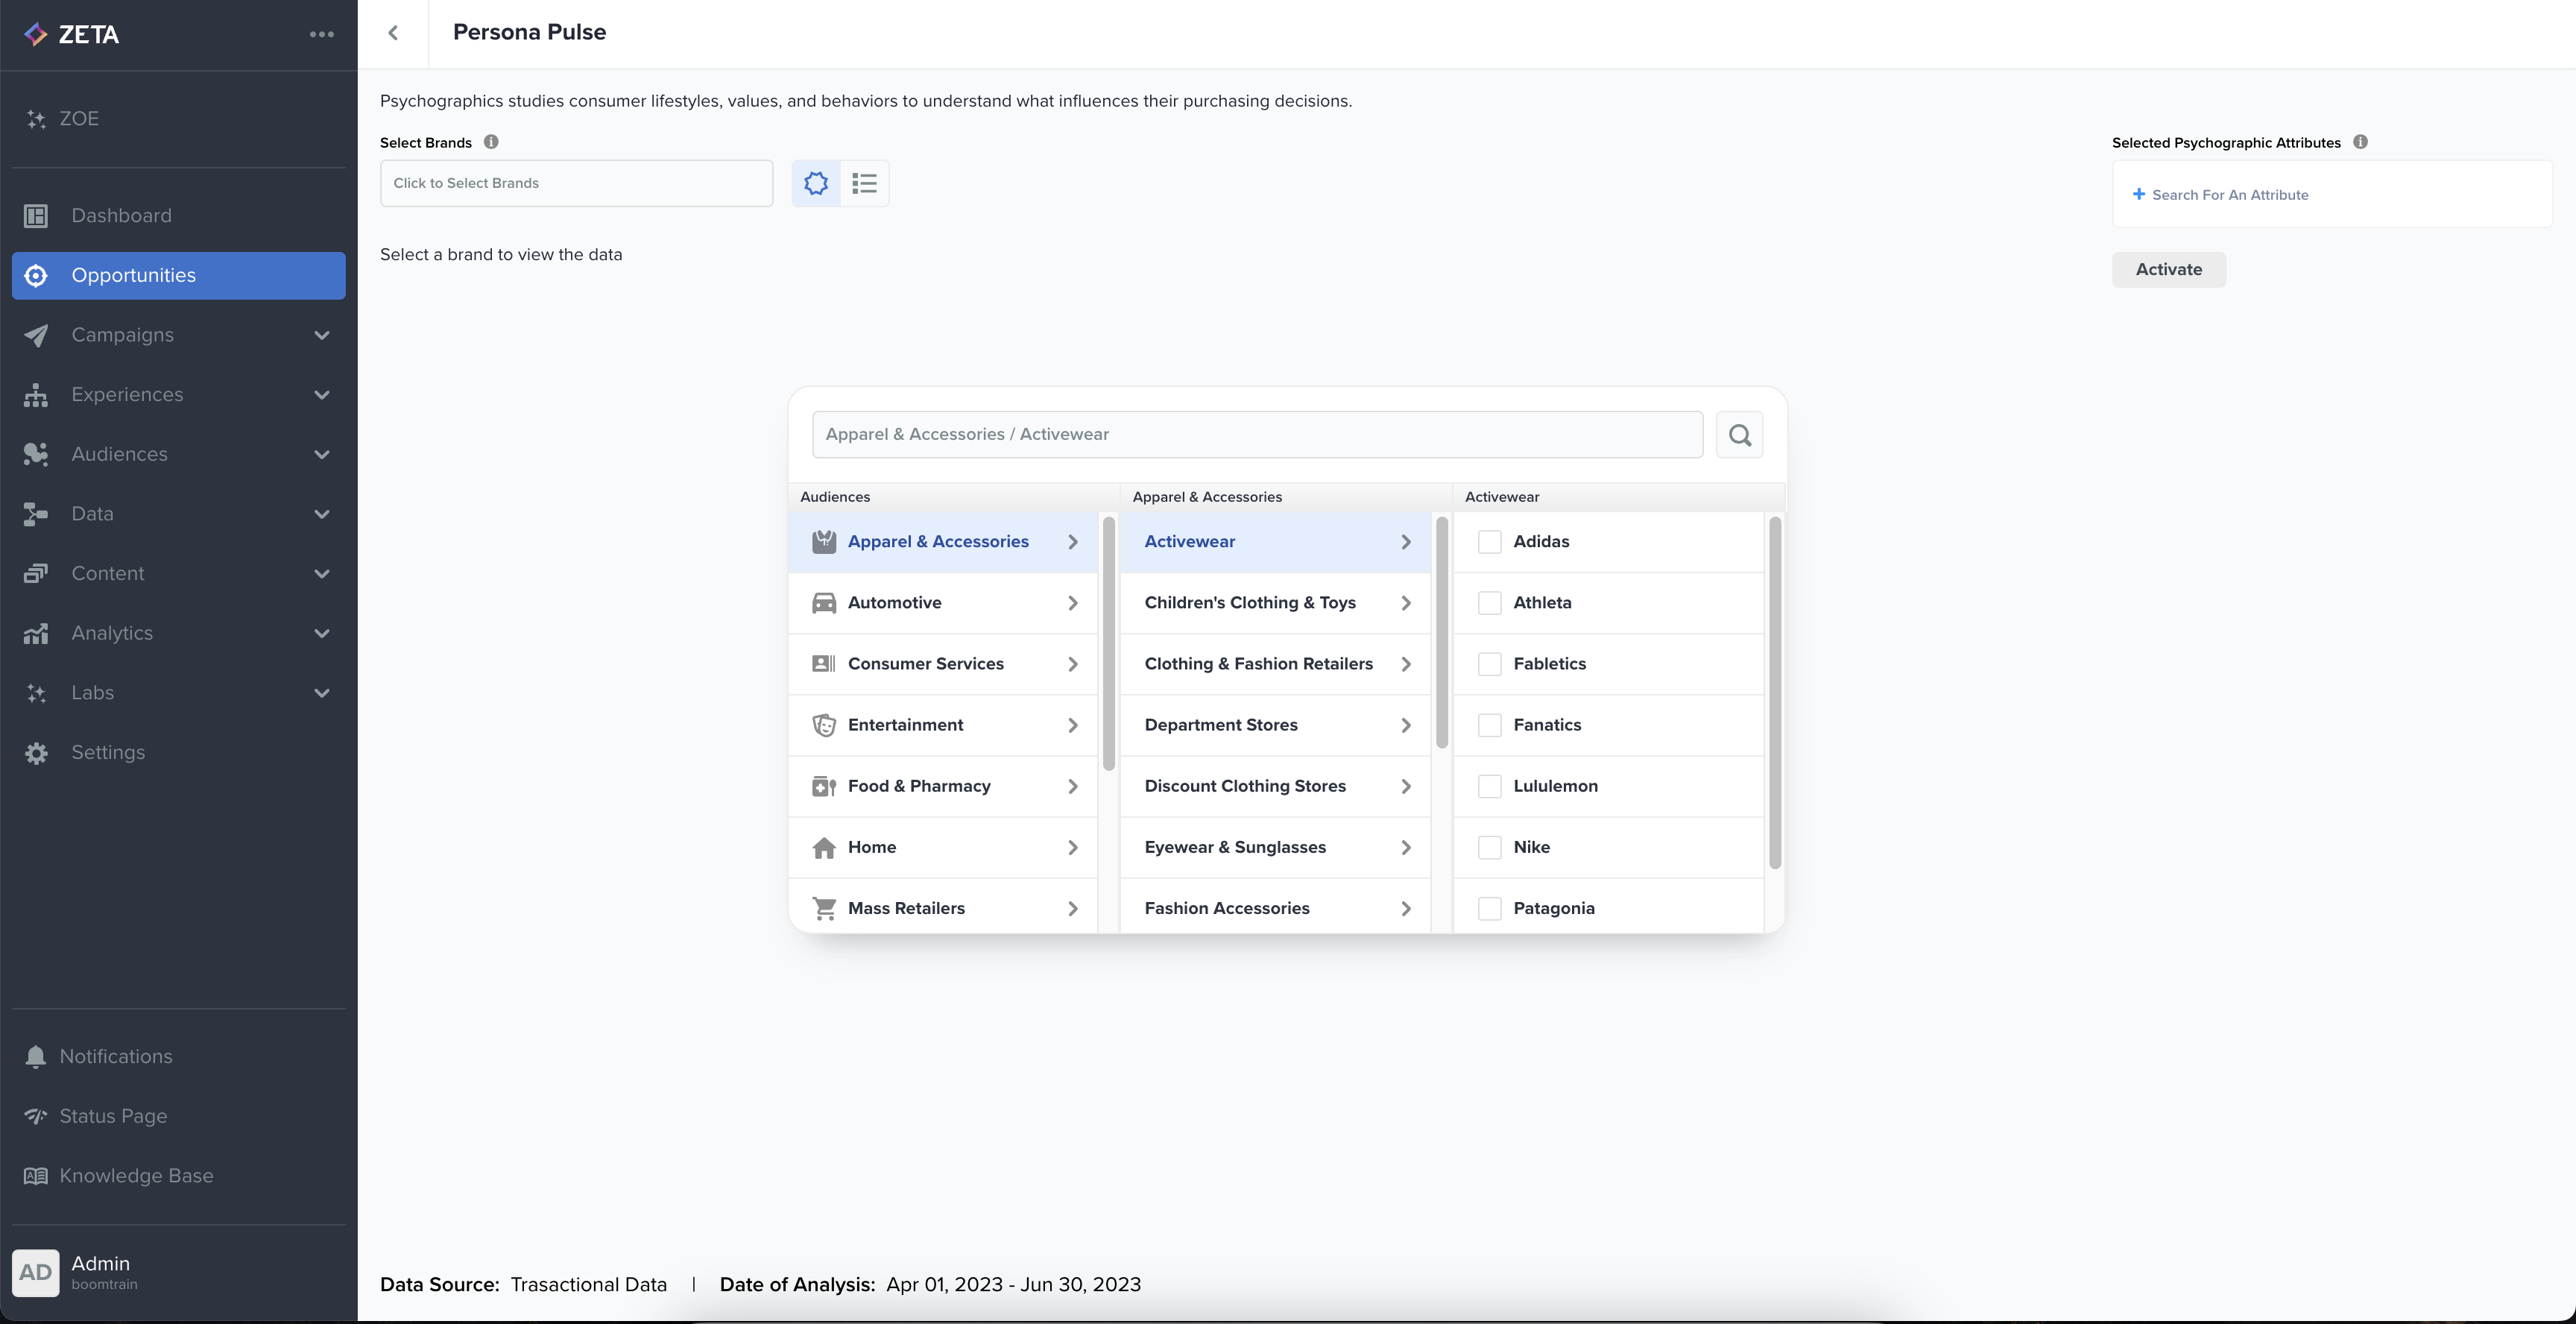
The PersonaPulse homepage will provide you with a prompt to choose one or multiple brands.
Radial Chart View
2. Once you select brands to showcase, the radial chart shows the index scores of all 41 Psychographic attributes for selected brands.
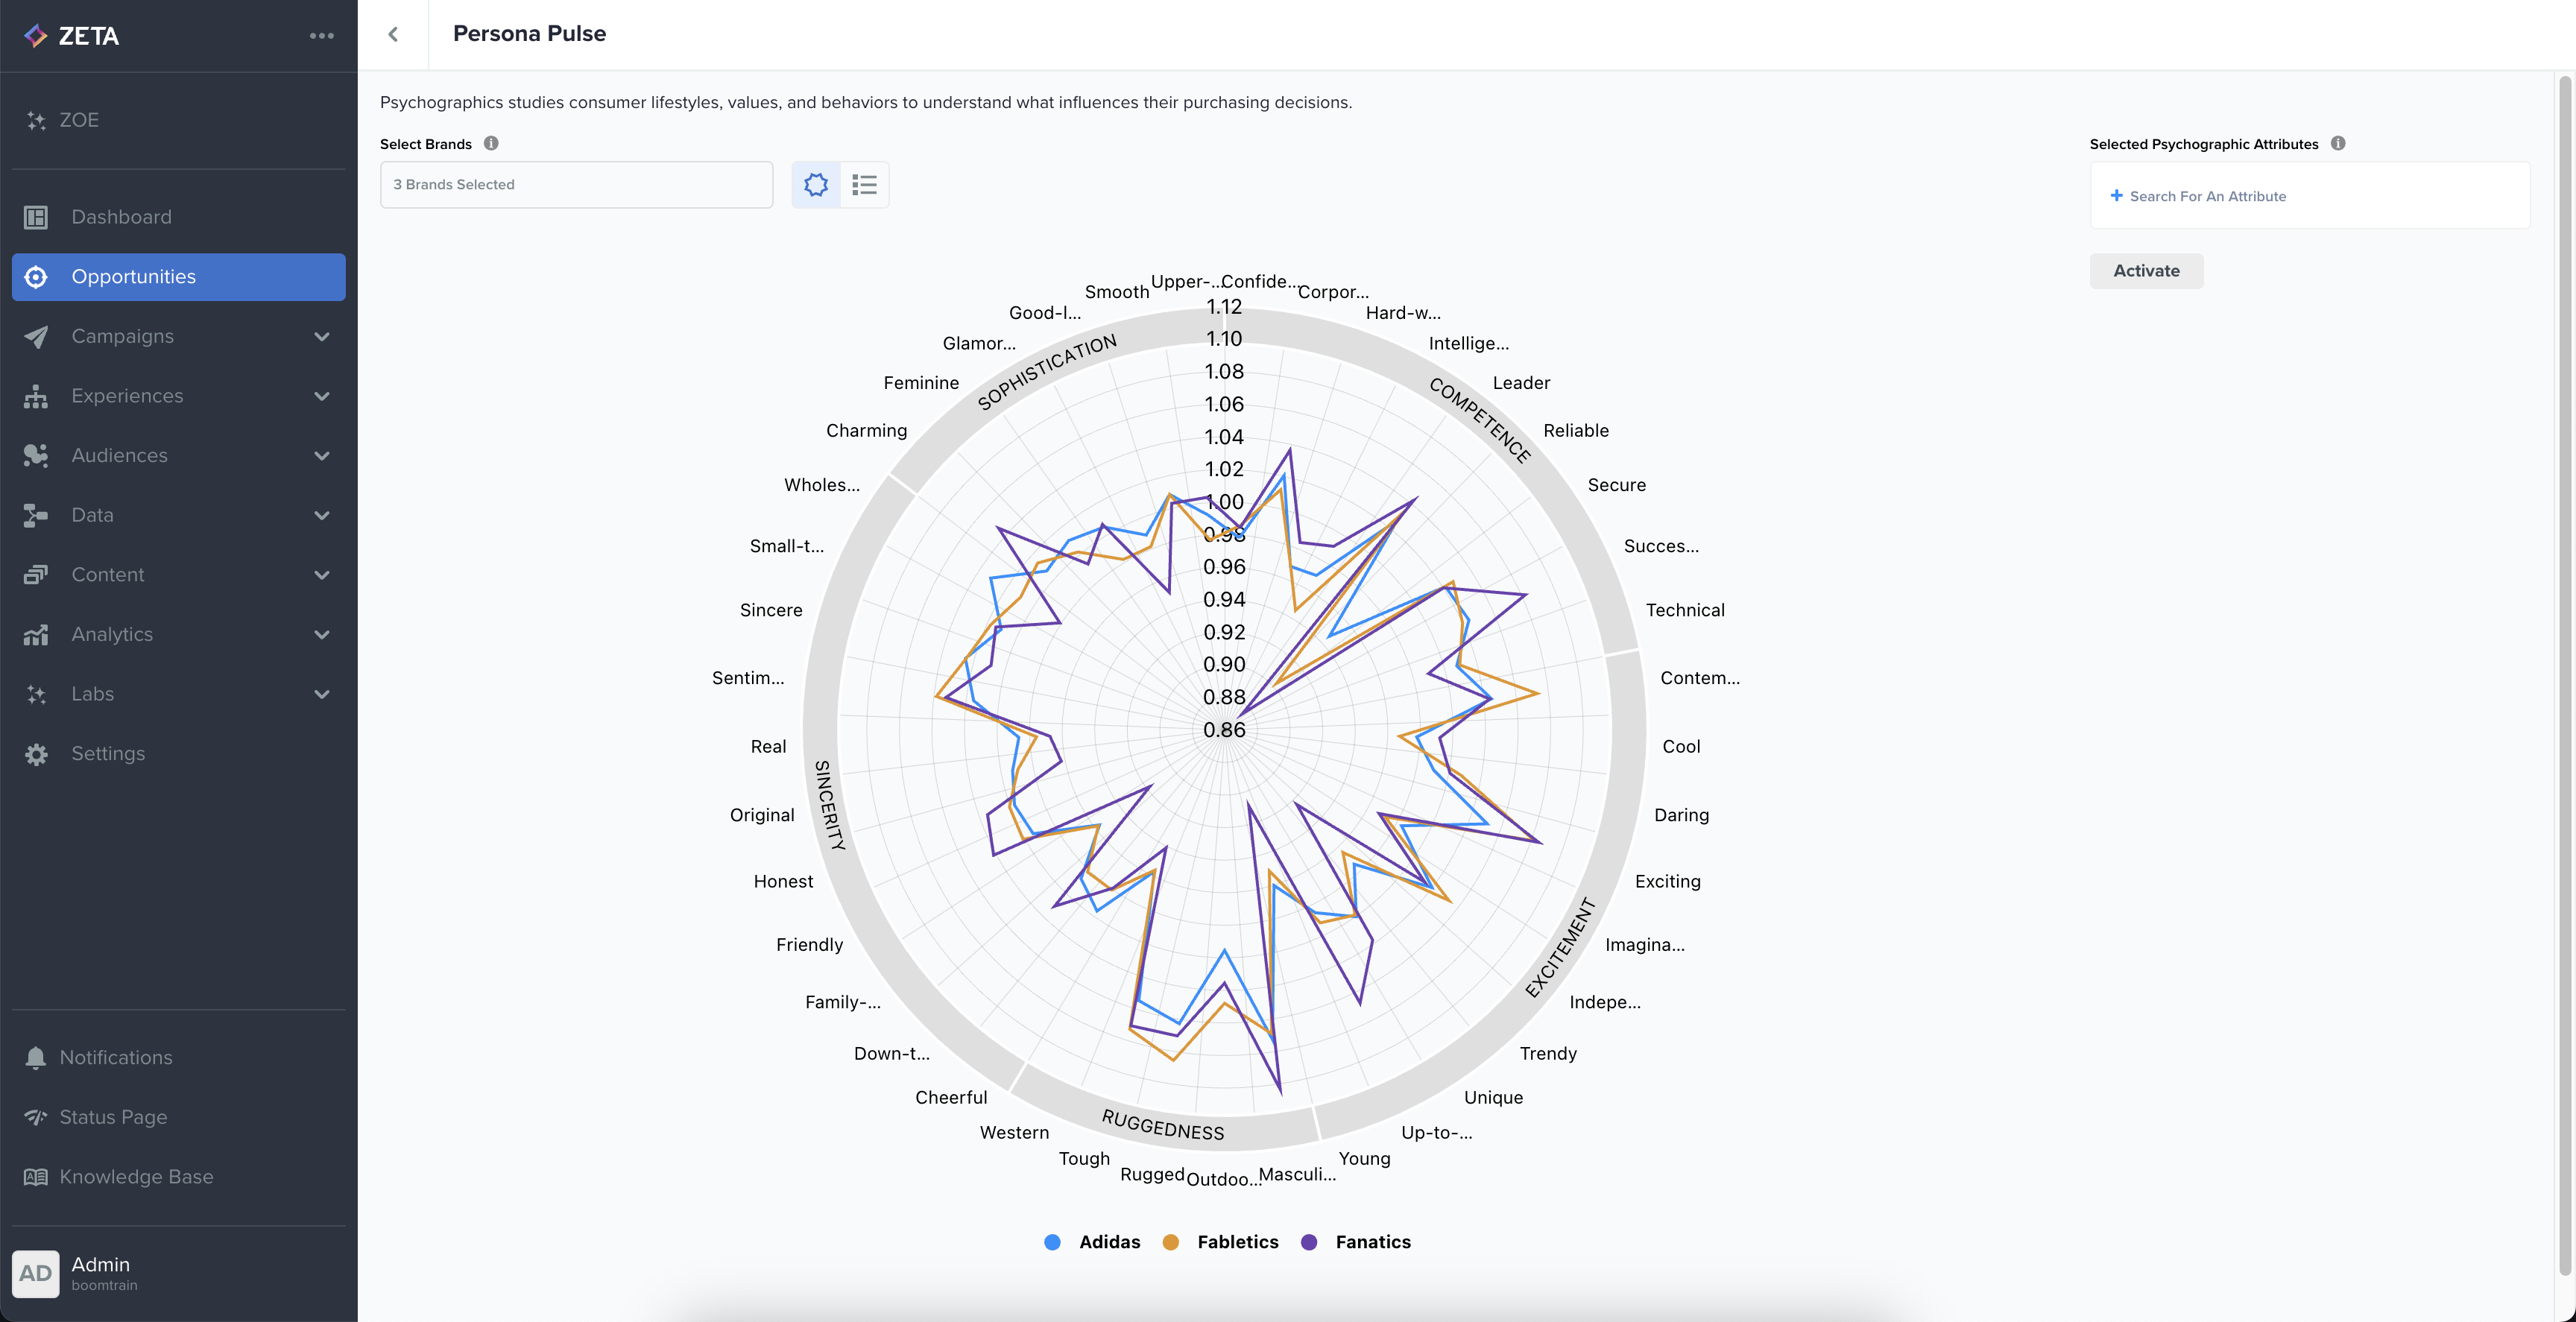
You can select up to 8 brands and see their psychographic profiles.
For more details about each psychographic trait, please reference: |
3. When you hover over any Psychographic attribute in the chart, it shows a tooltip with its definition and index scores for all brands.
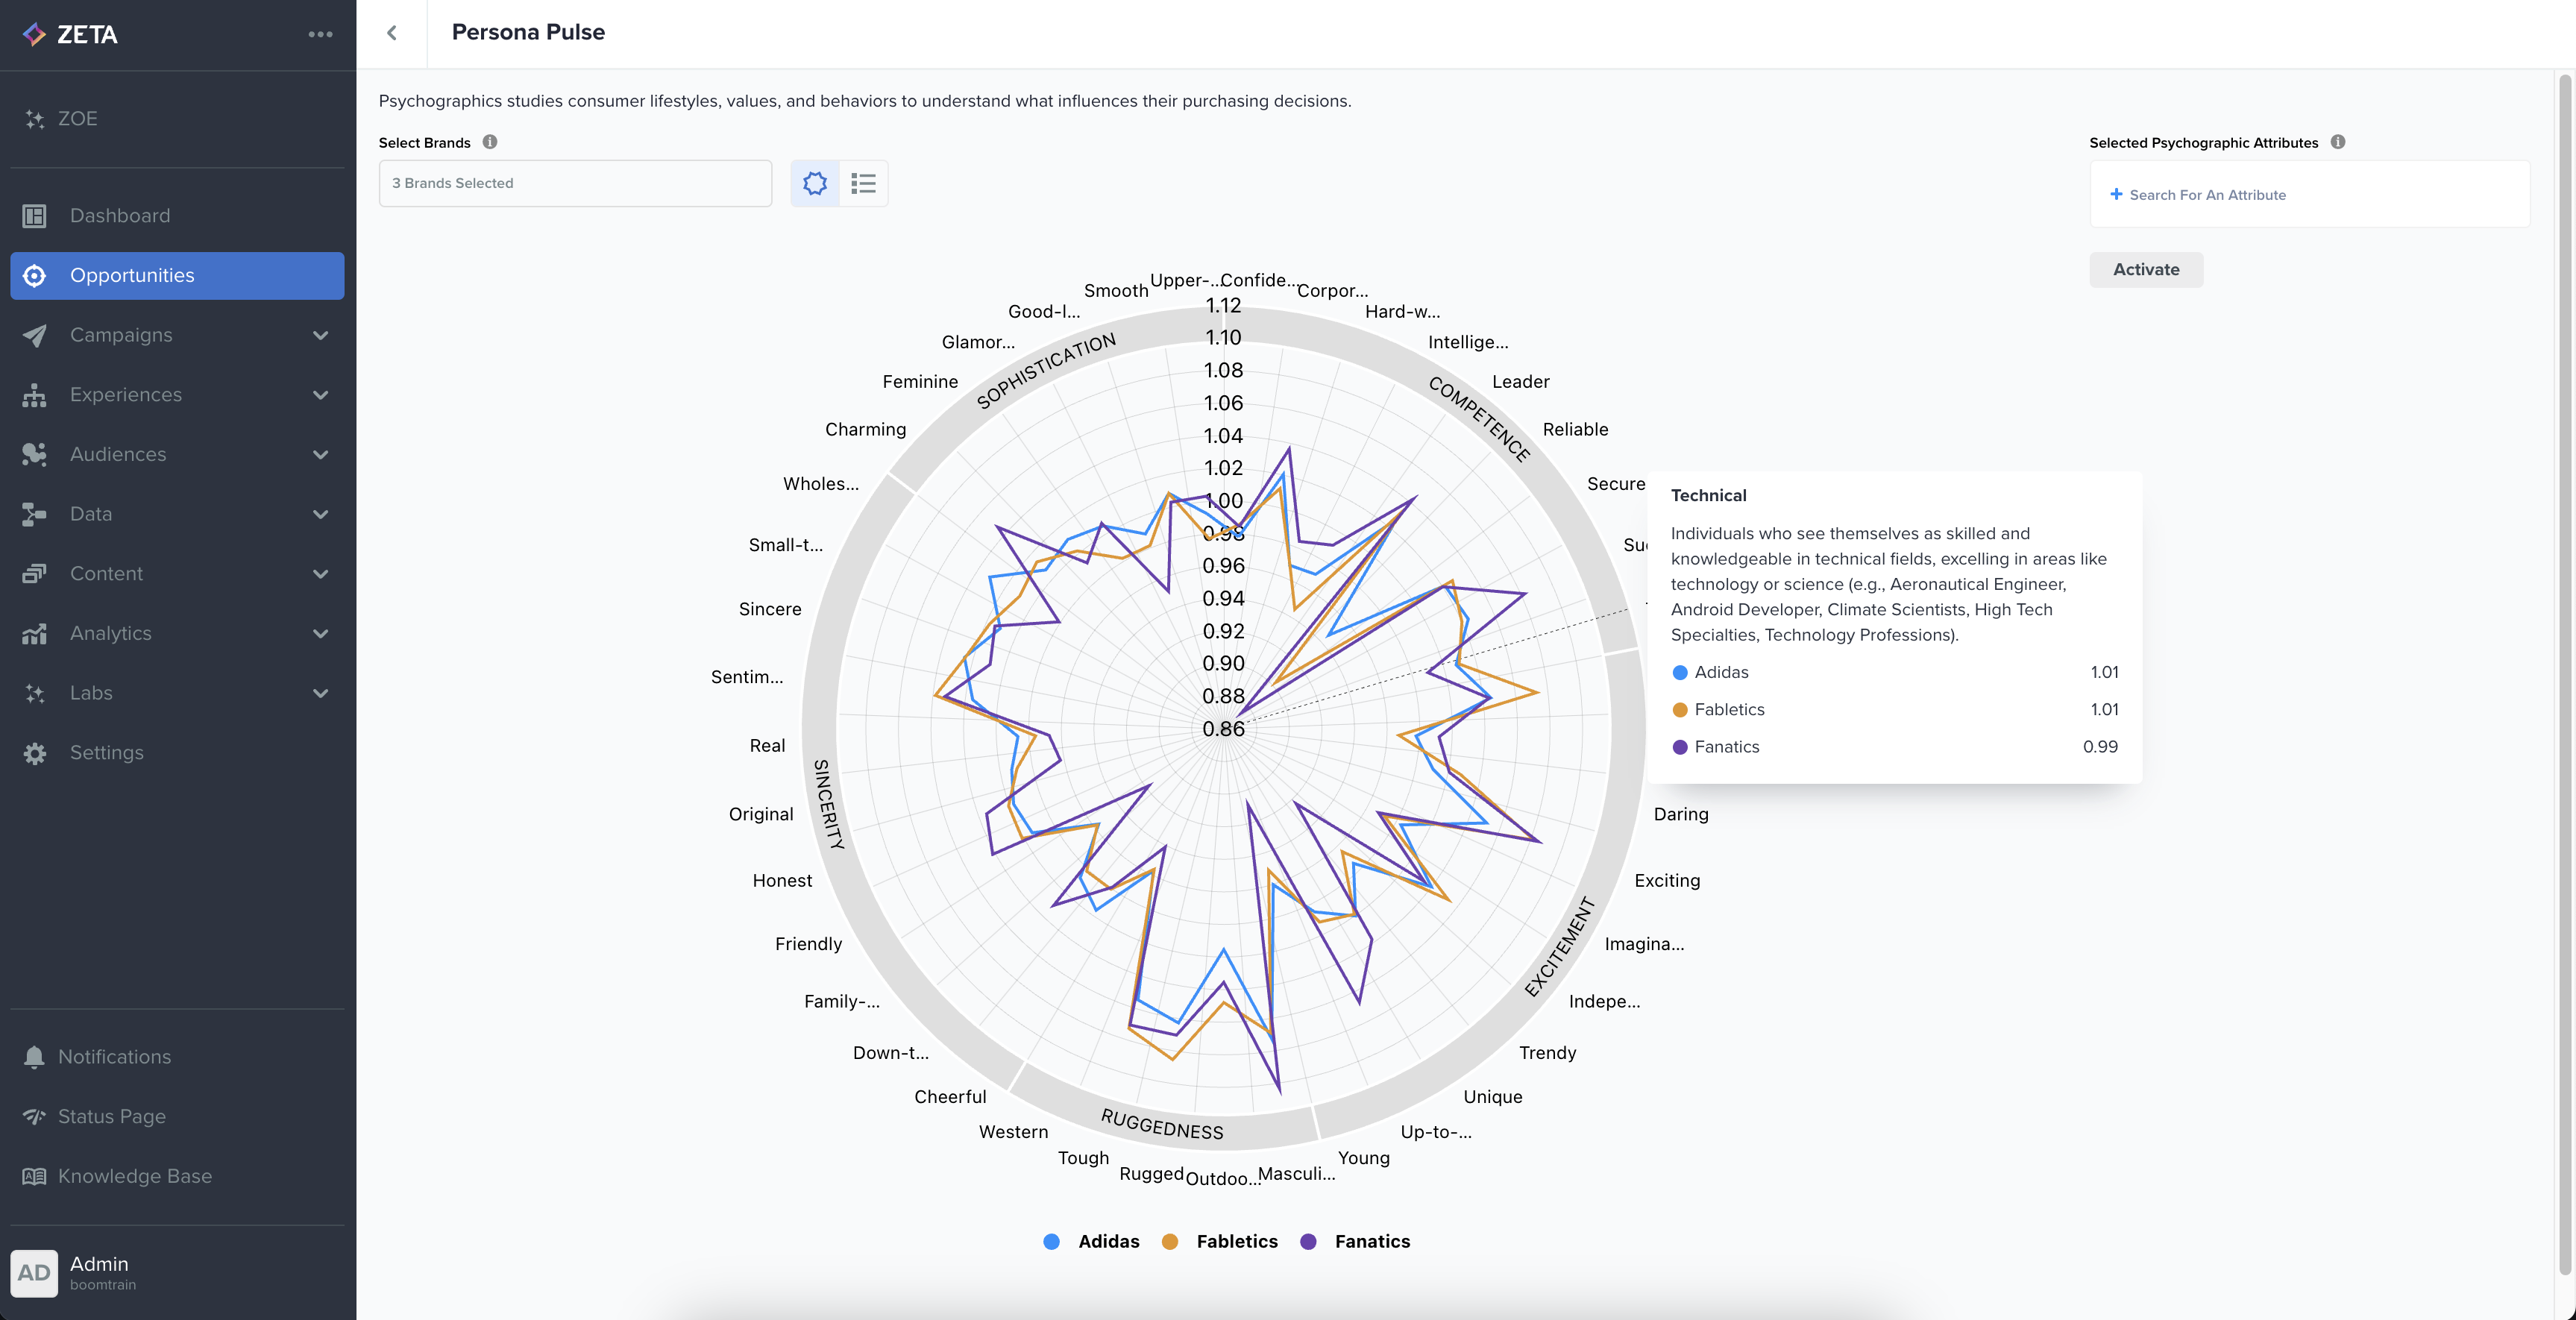
You can also hover over any legend and the corresponding line in the chart will be highlighted, and other lines will be grayed out.
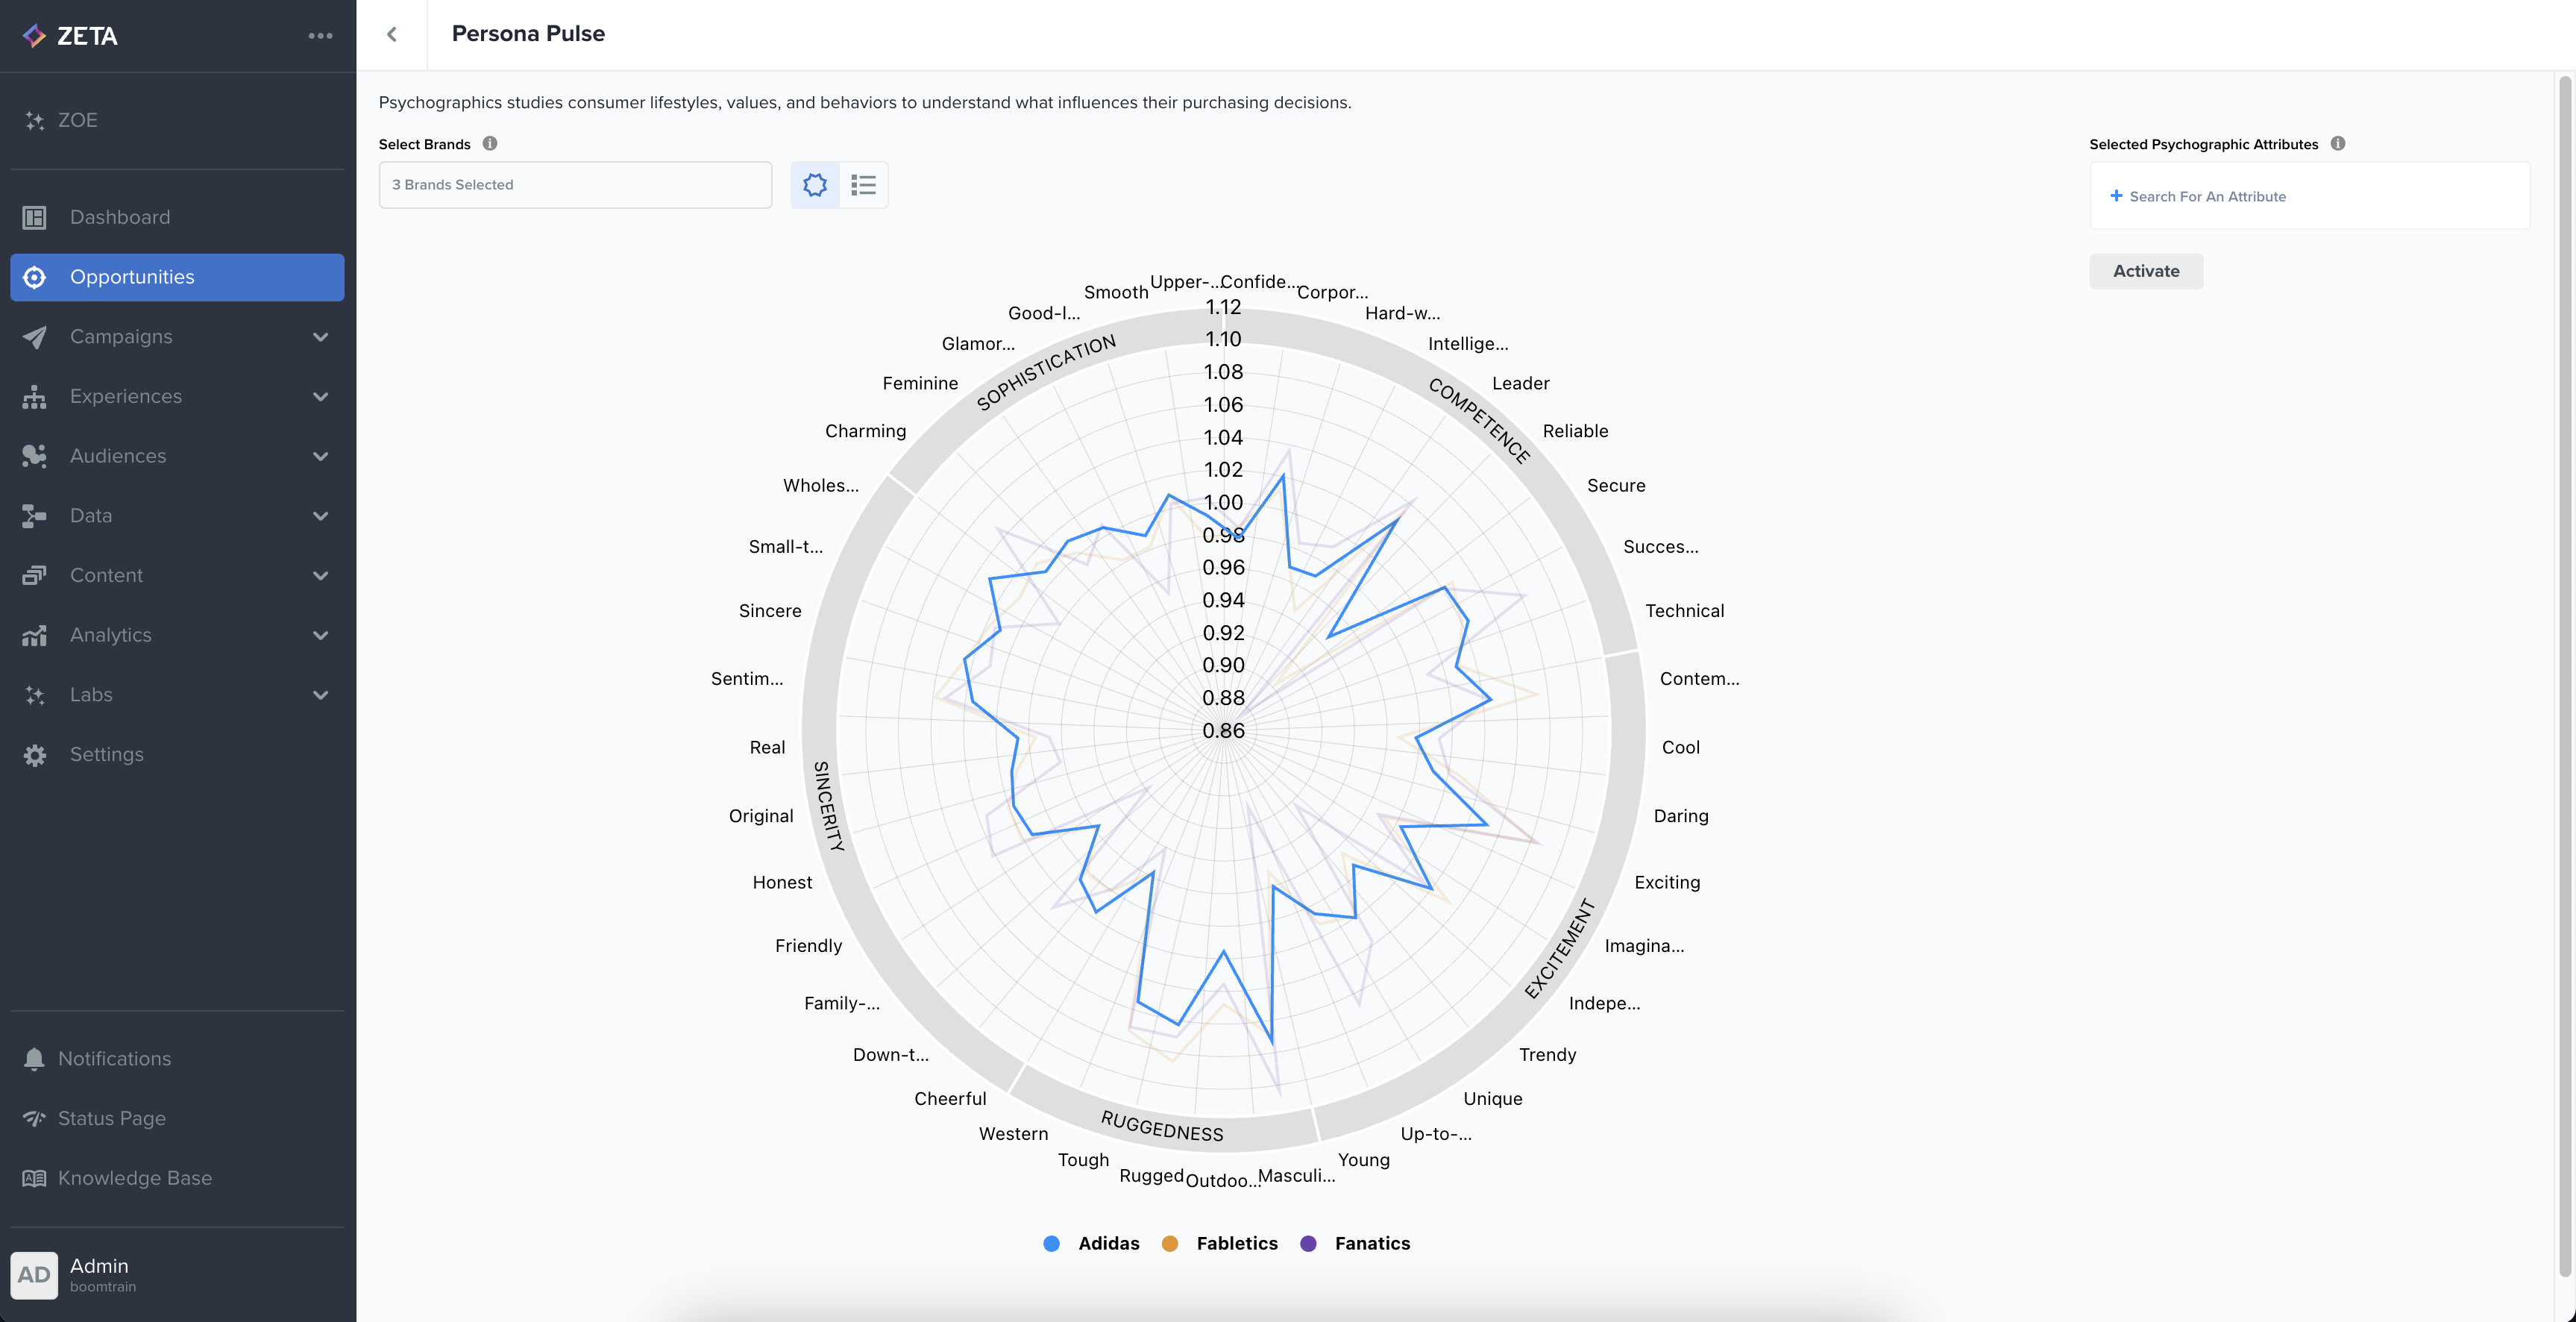
4. Next, select the Psychographic attributes from around the chart. These values are added to the Activation section in the top right corner.
.png?inst-v=15fec351-7812-4ad4-bce9-8e20f33bf3ea)
5. Click on the Activate button, and the brands along with the psychographic attributes selected will be taken to ZMP Audience Explorer, from where you can save them as your segments.
-20240510-060623.gif?inst-v=15fec351-7812-4ad4-bce9-8e20f33bf3ea)
Top-Values View
While the Radial chart view provides a complete view of the data, you can switch to a simpler view using the Toggle switch at the top left.

This view is called the Top-values view. This view shows only the top 5 Psychographic attributes per brand.
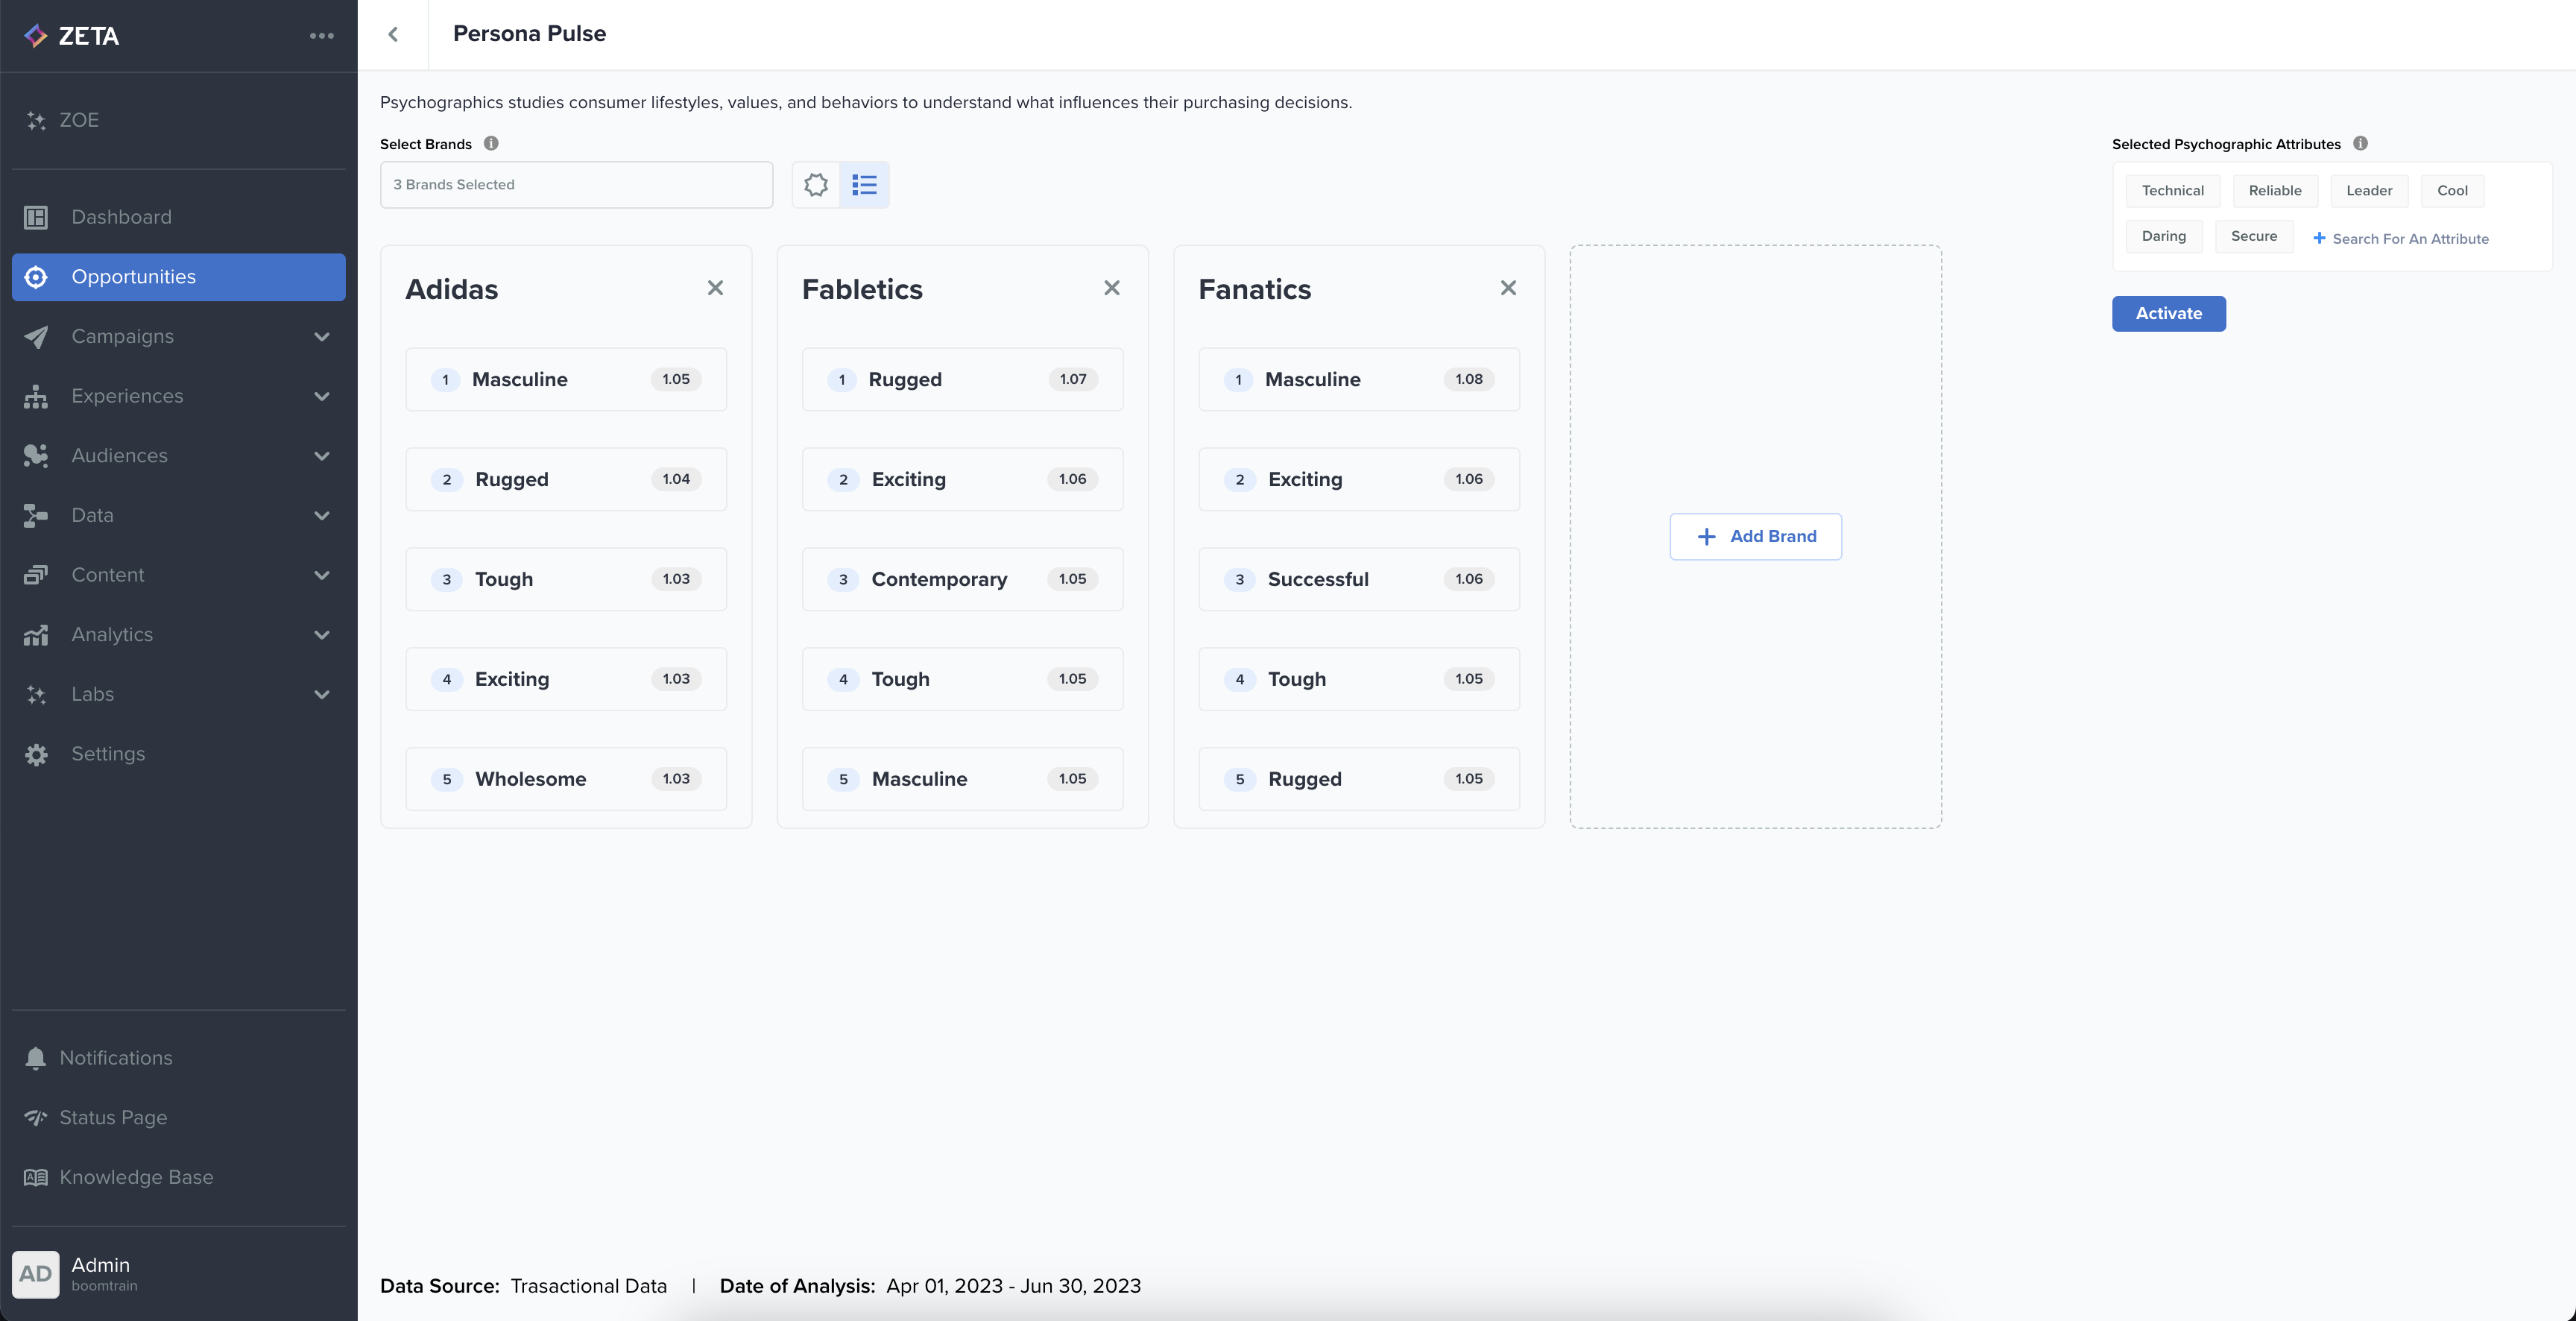
You can click on any Attribute from any brand's top 5 values, and that value will be highlighted in other brands' cards. This helps showcase the overlap of Psychographic values among brands.
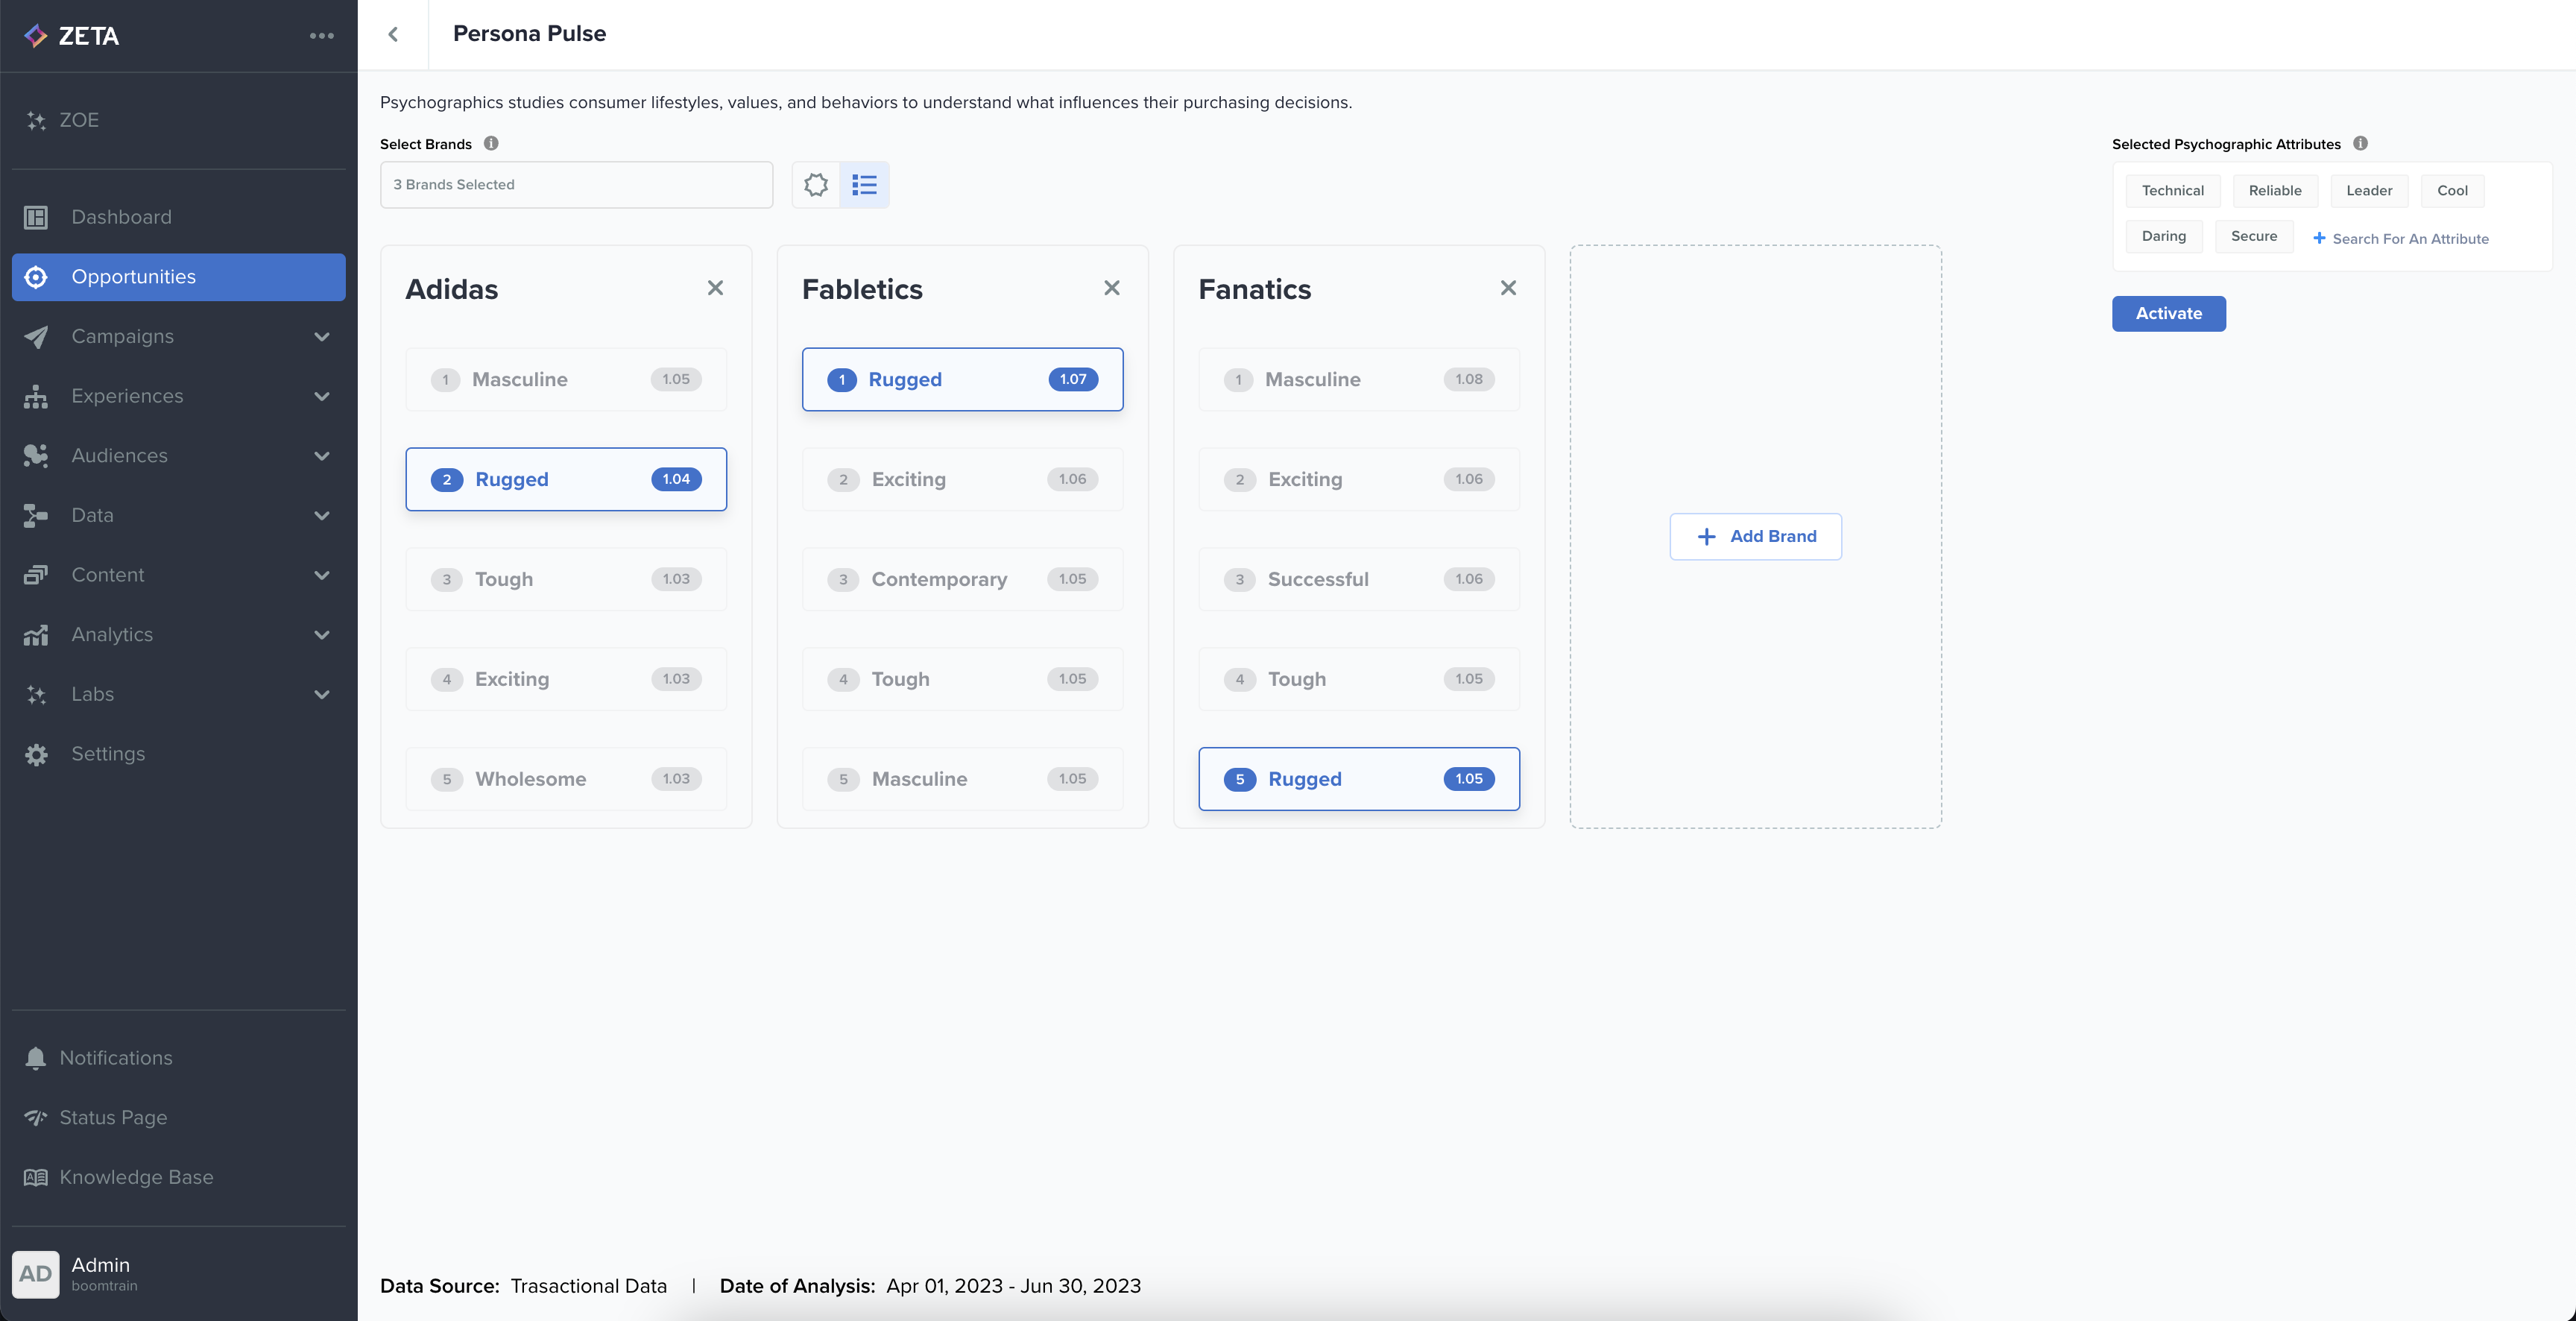
If in case the value is not present in any brand card, that brand card will be grayed out.
Generate Insights
Click on the Generate Insights button at the top right corner to view recommendations for the chosen brand(s)
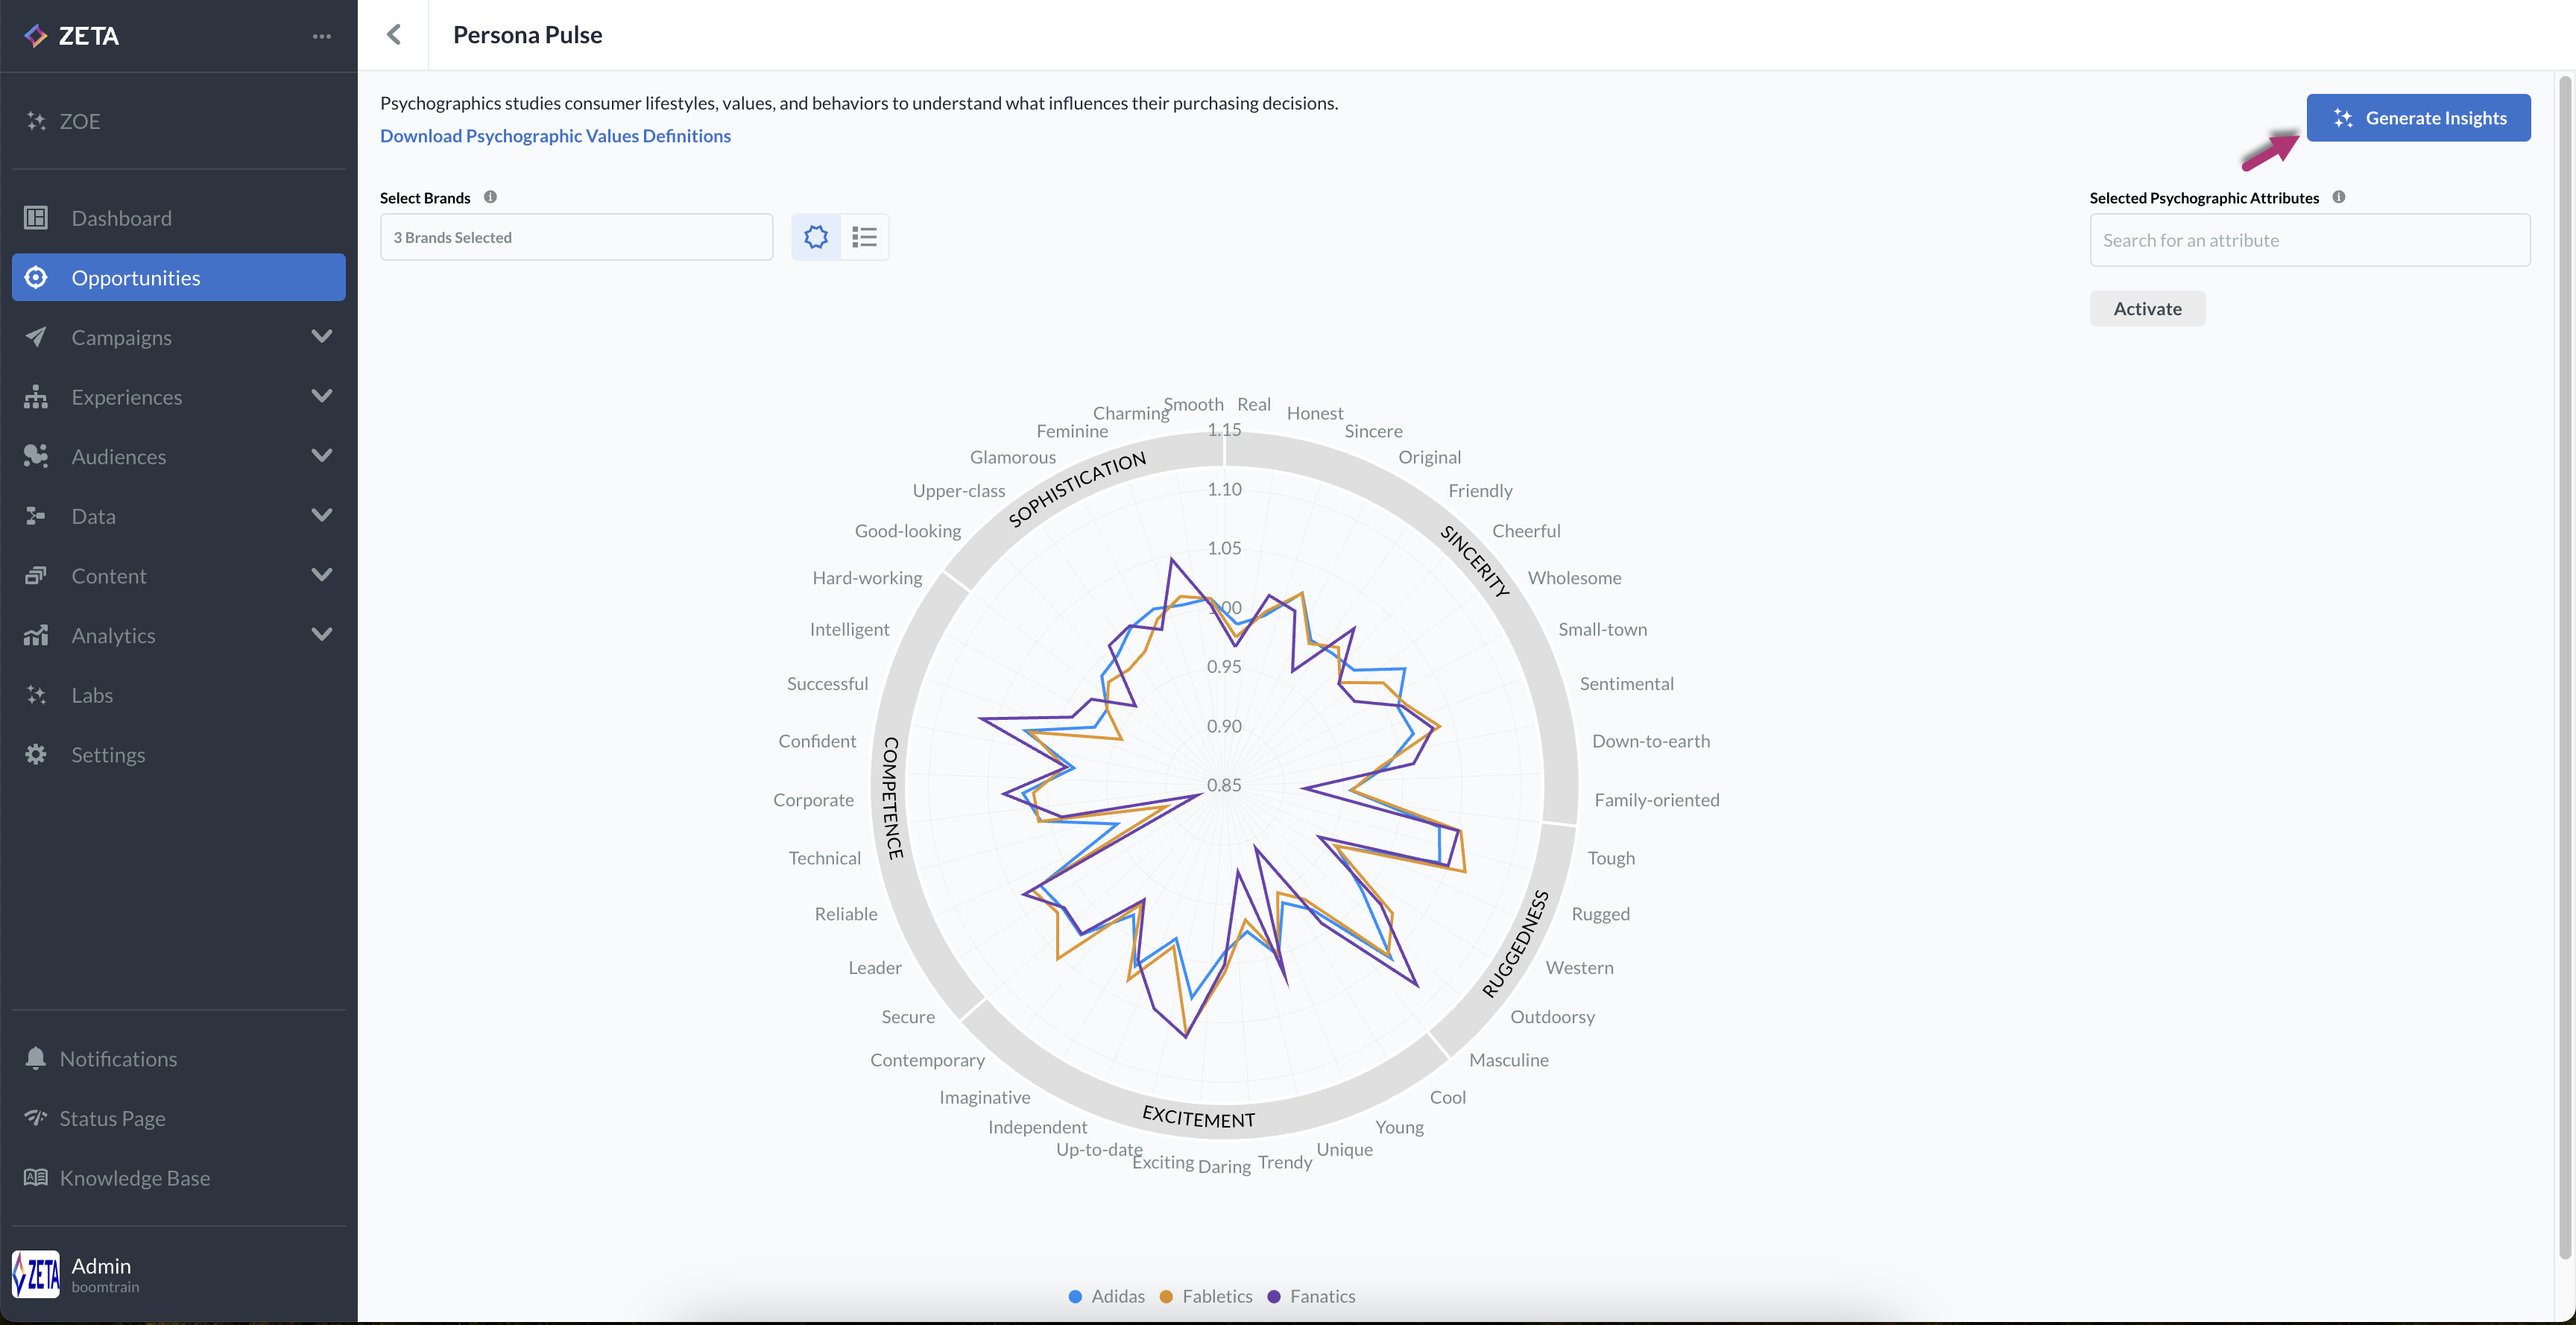
This will open a new panel on the right side of the screen, and the AI-generated insights and recommendations will be shown for the selected brand(s)
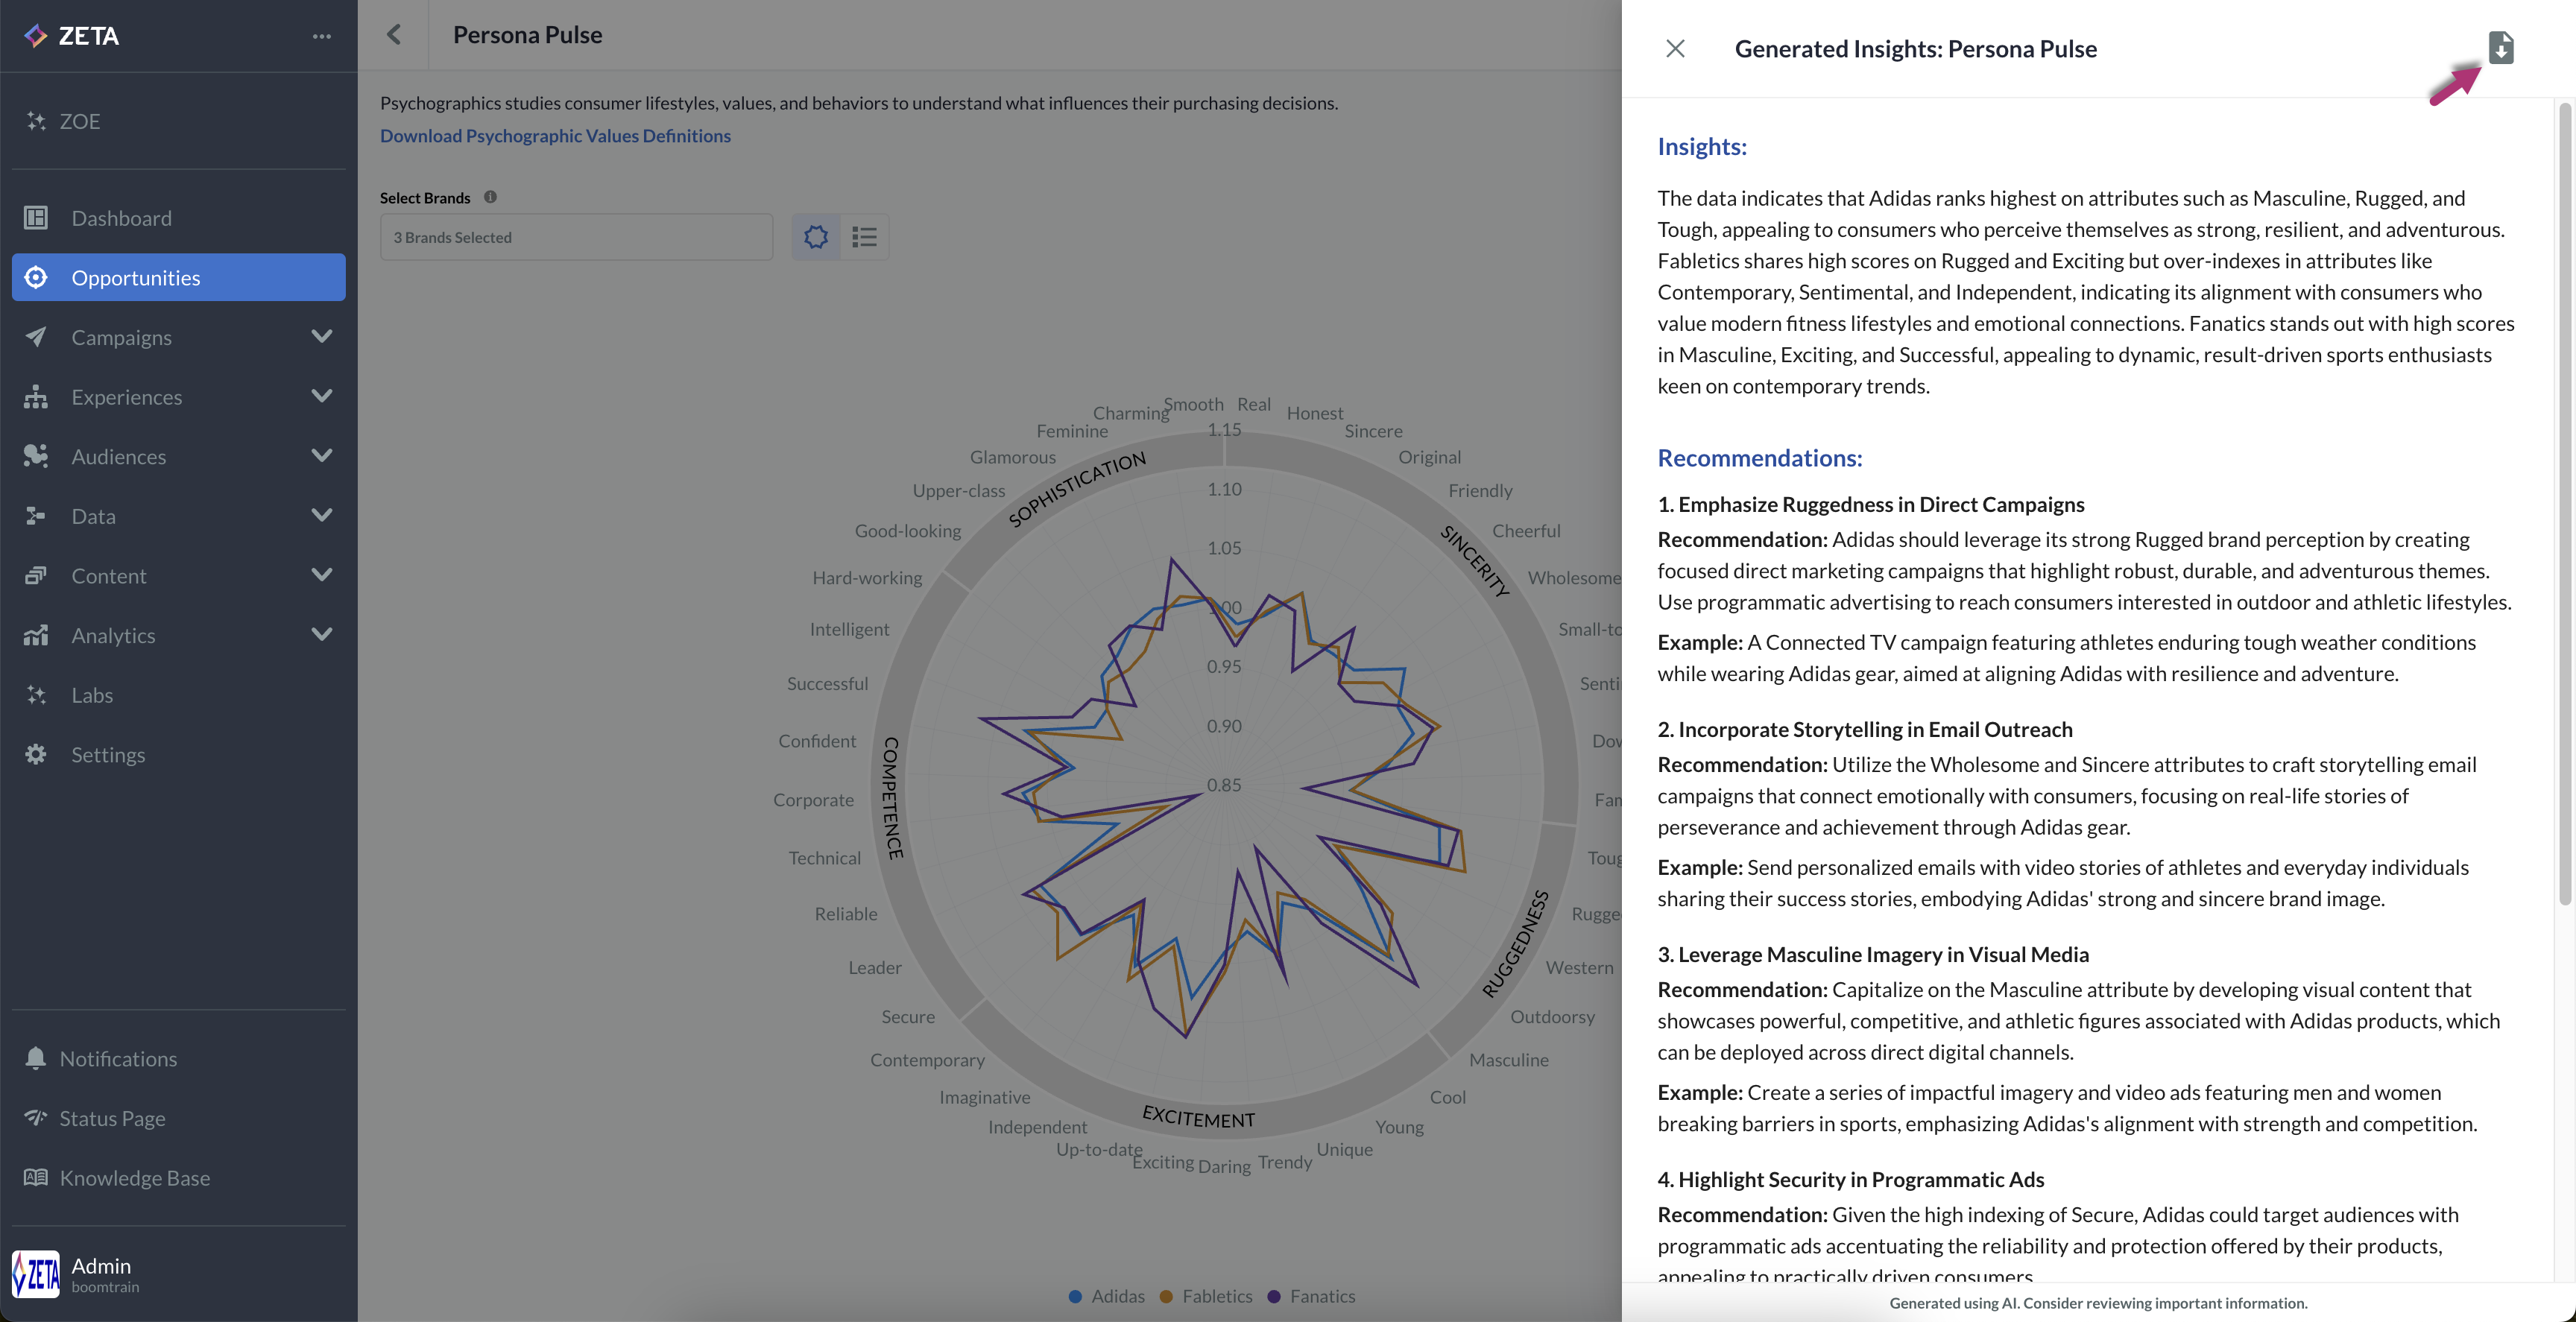
You can also download the insights and recommendations in PDF format using the top-right Download PDF button.
