

Node-Level Insights is currently available exclusively in the U.S., but we’re just getting started. Stay tuned for updates as we bring Node-Level Insights to more regions soon!
Using intelligence and historical data, you can get more context with Node-Level Insights in Experience Builder. This feature provides both historical and forecasted performance data while you’re building your experience, as well as forecasted and comparative performance once your experience is active.
-
As you build your experience, this feature helps you select more common events and gives you more confidence on what to expect.
-
Once the experience is active, you can monitor performance based on previous forecasts and previous actual performance, while continuing to get forecasted data for the next set of days.
Draft State
While building your experience, you’ll see more data on your nodes in the Insights module to give you insight into how they have performed and are expected to perform.
Historical Performance
For trigger and event nodes, you will see counts to tell you how often these events have been fired in your account recently. Trigger nodes will be measured using the total times that event has been raised. Event nodes will provide the unique people who have done the event.
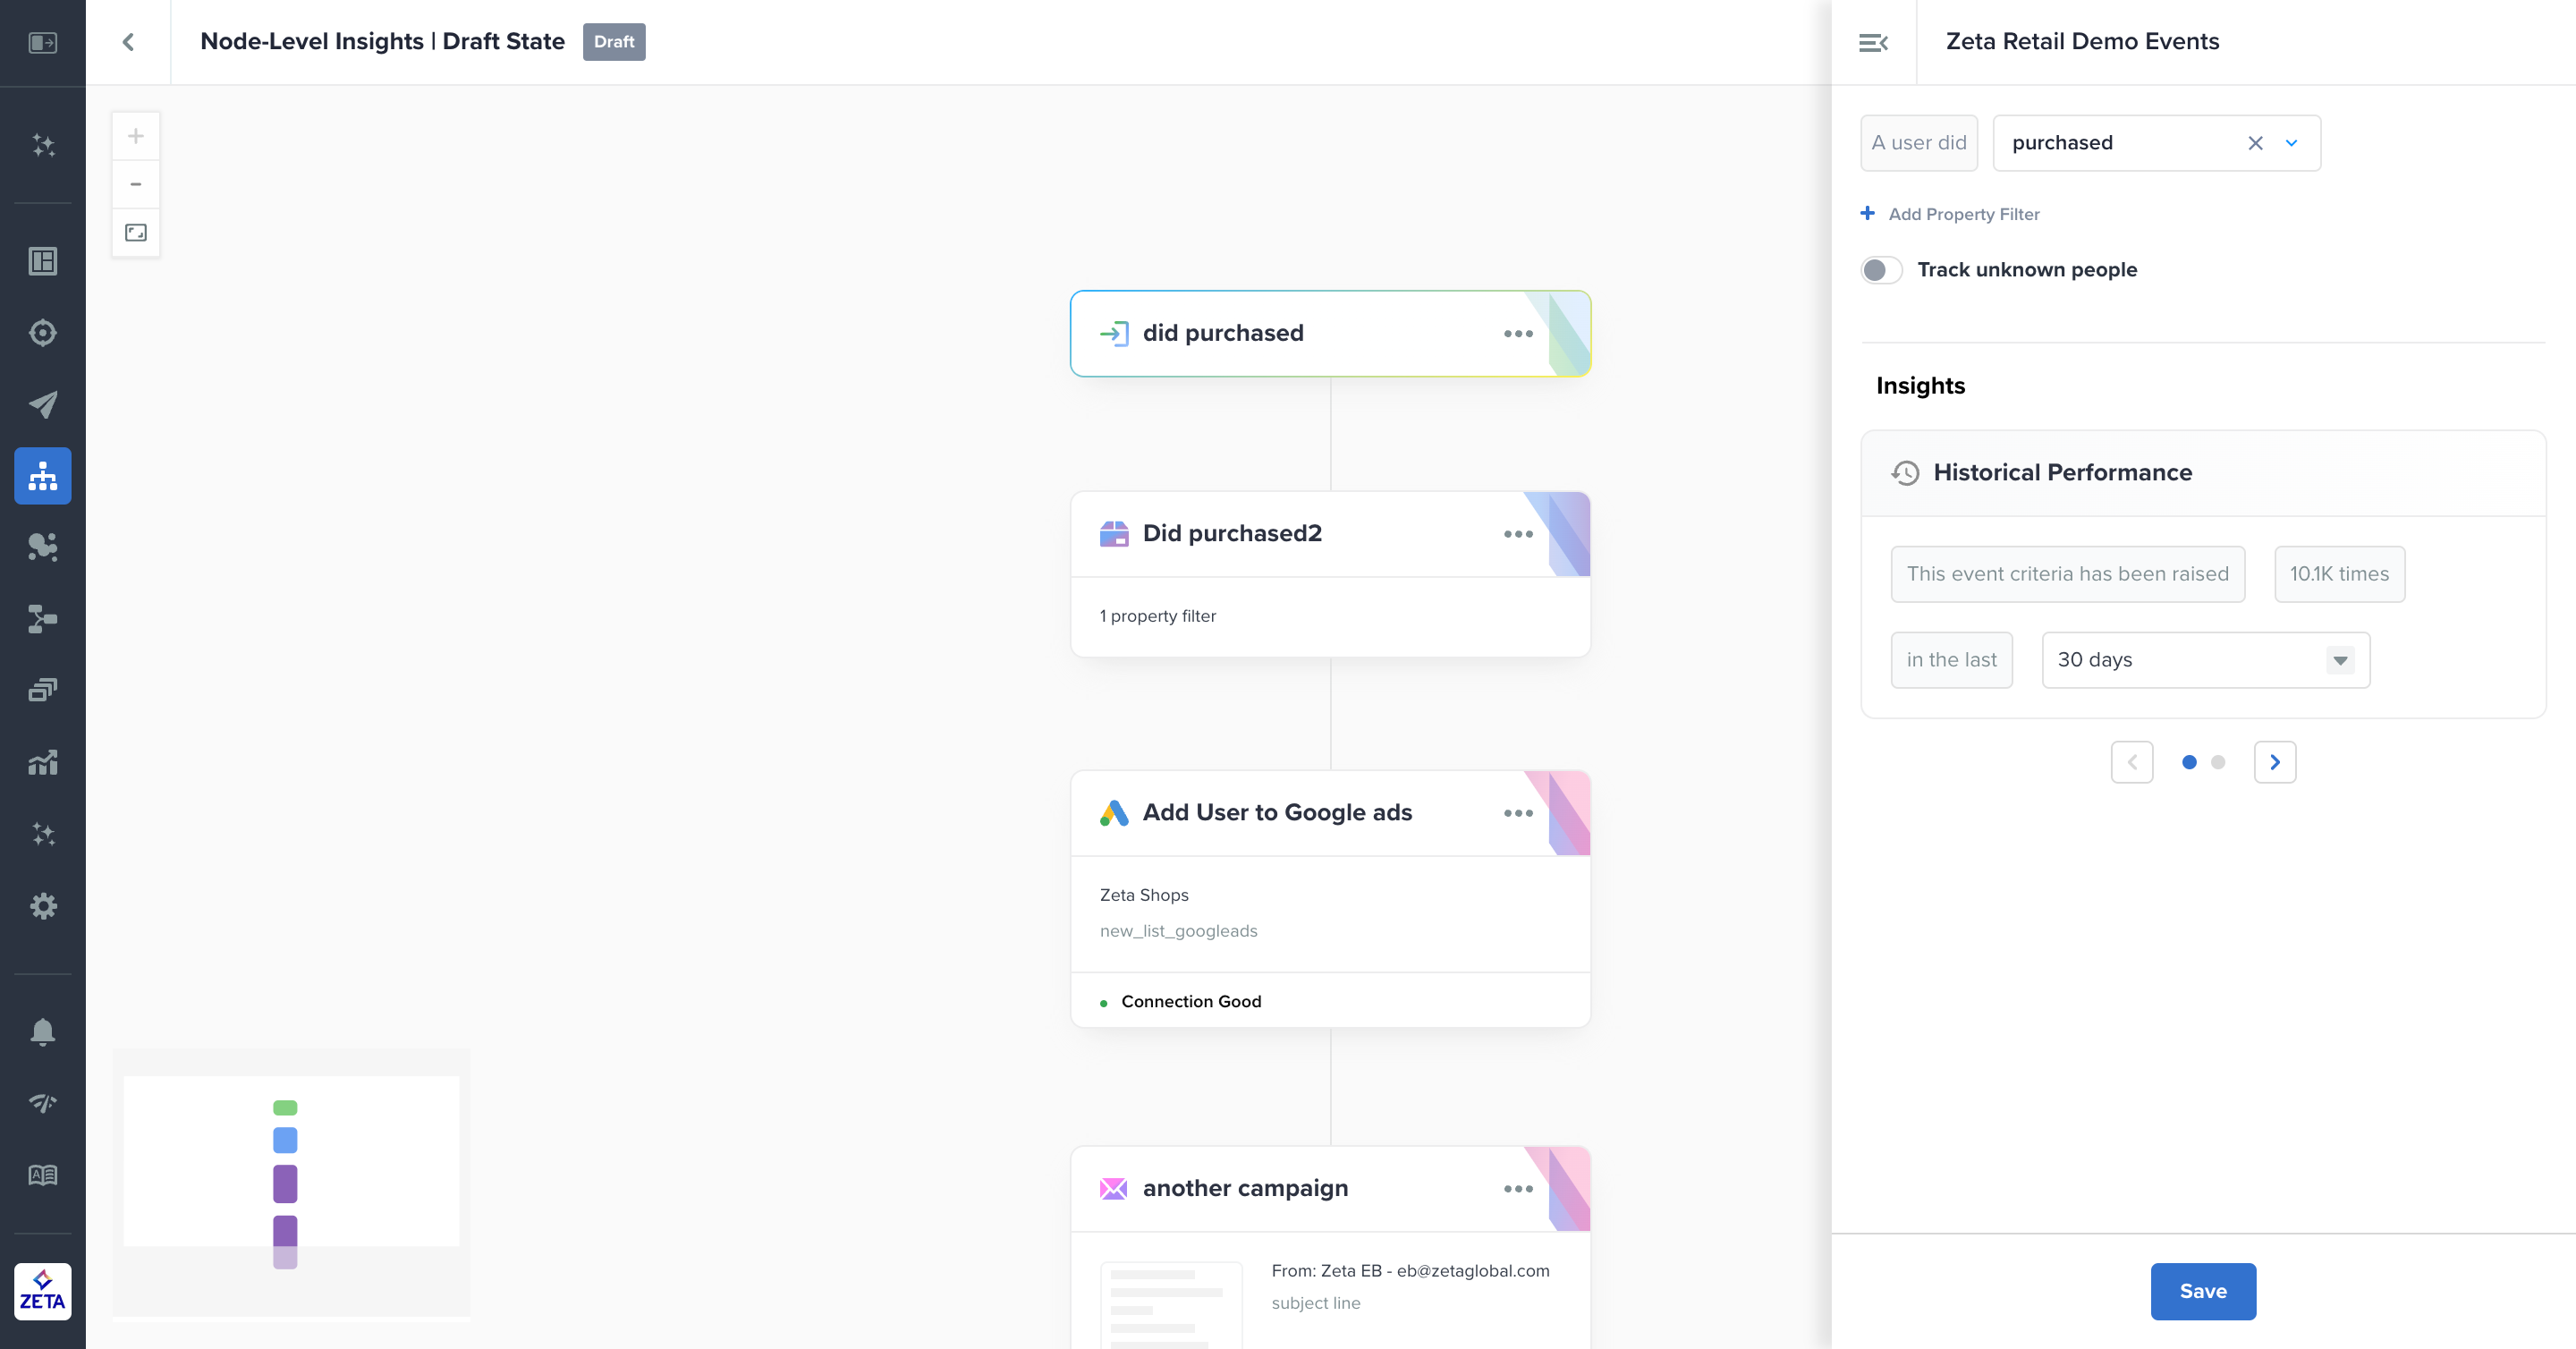
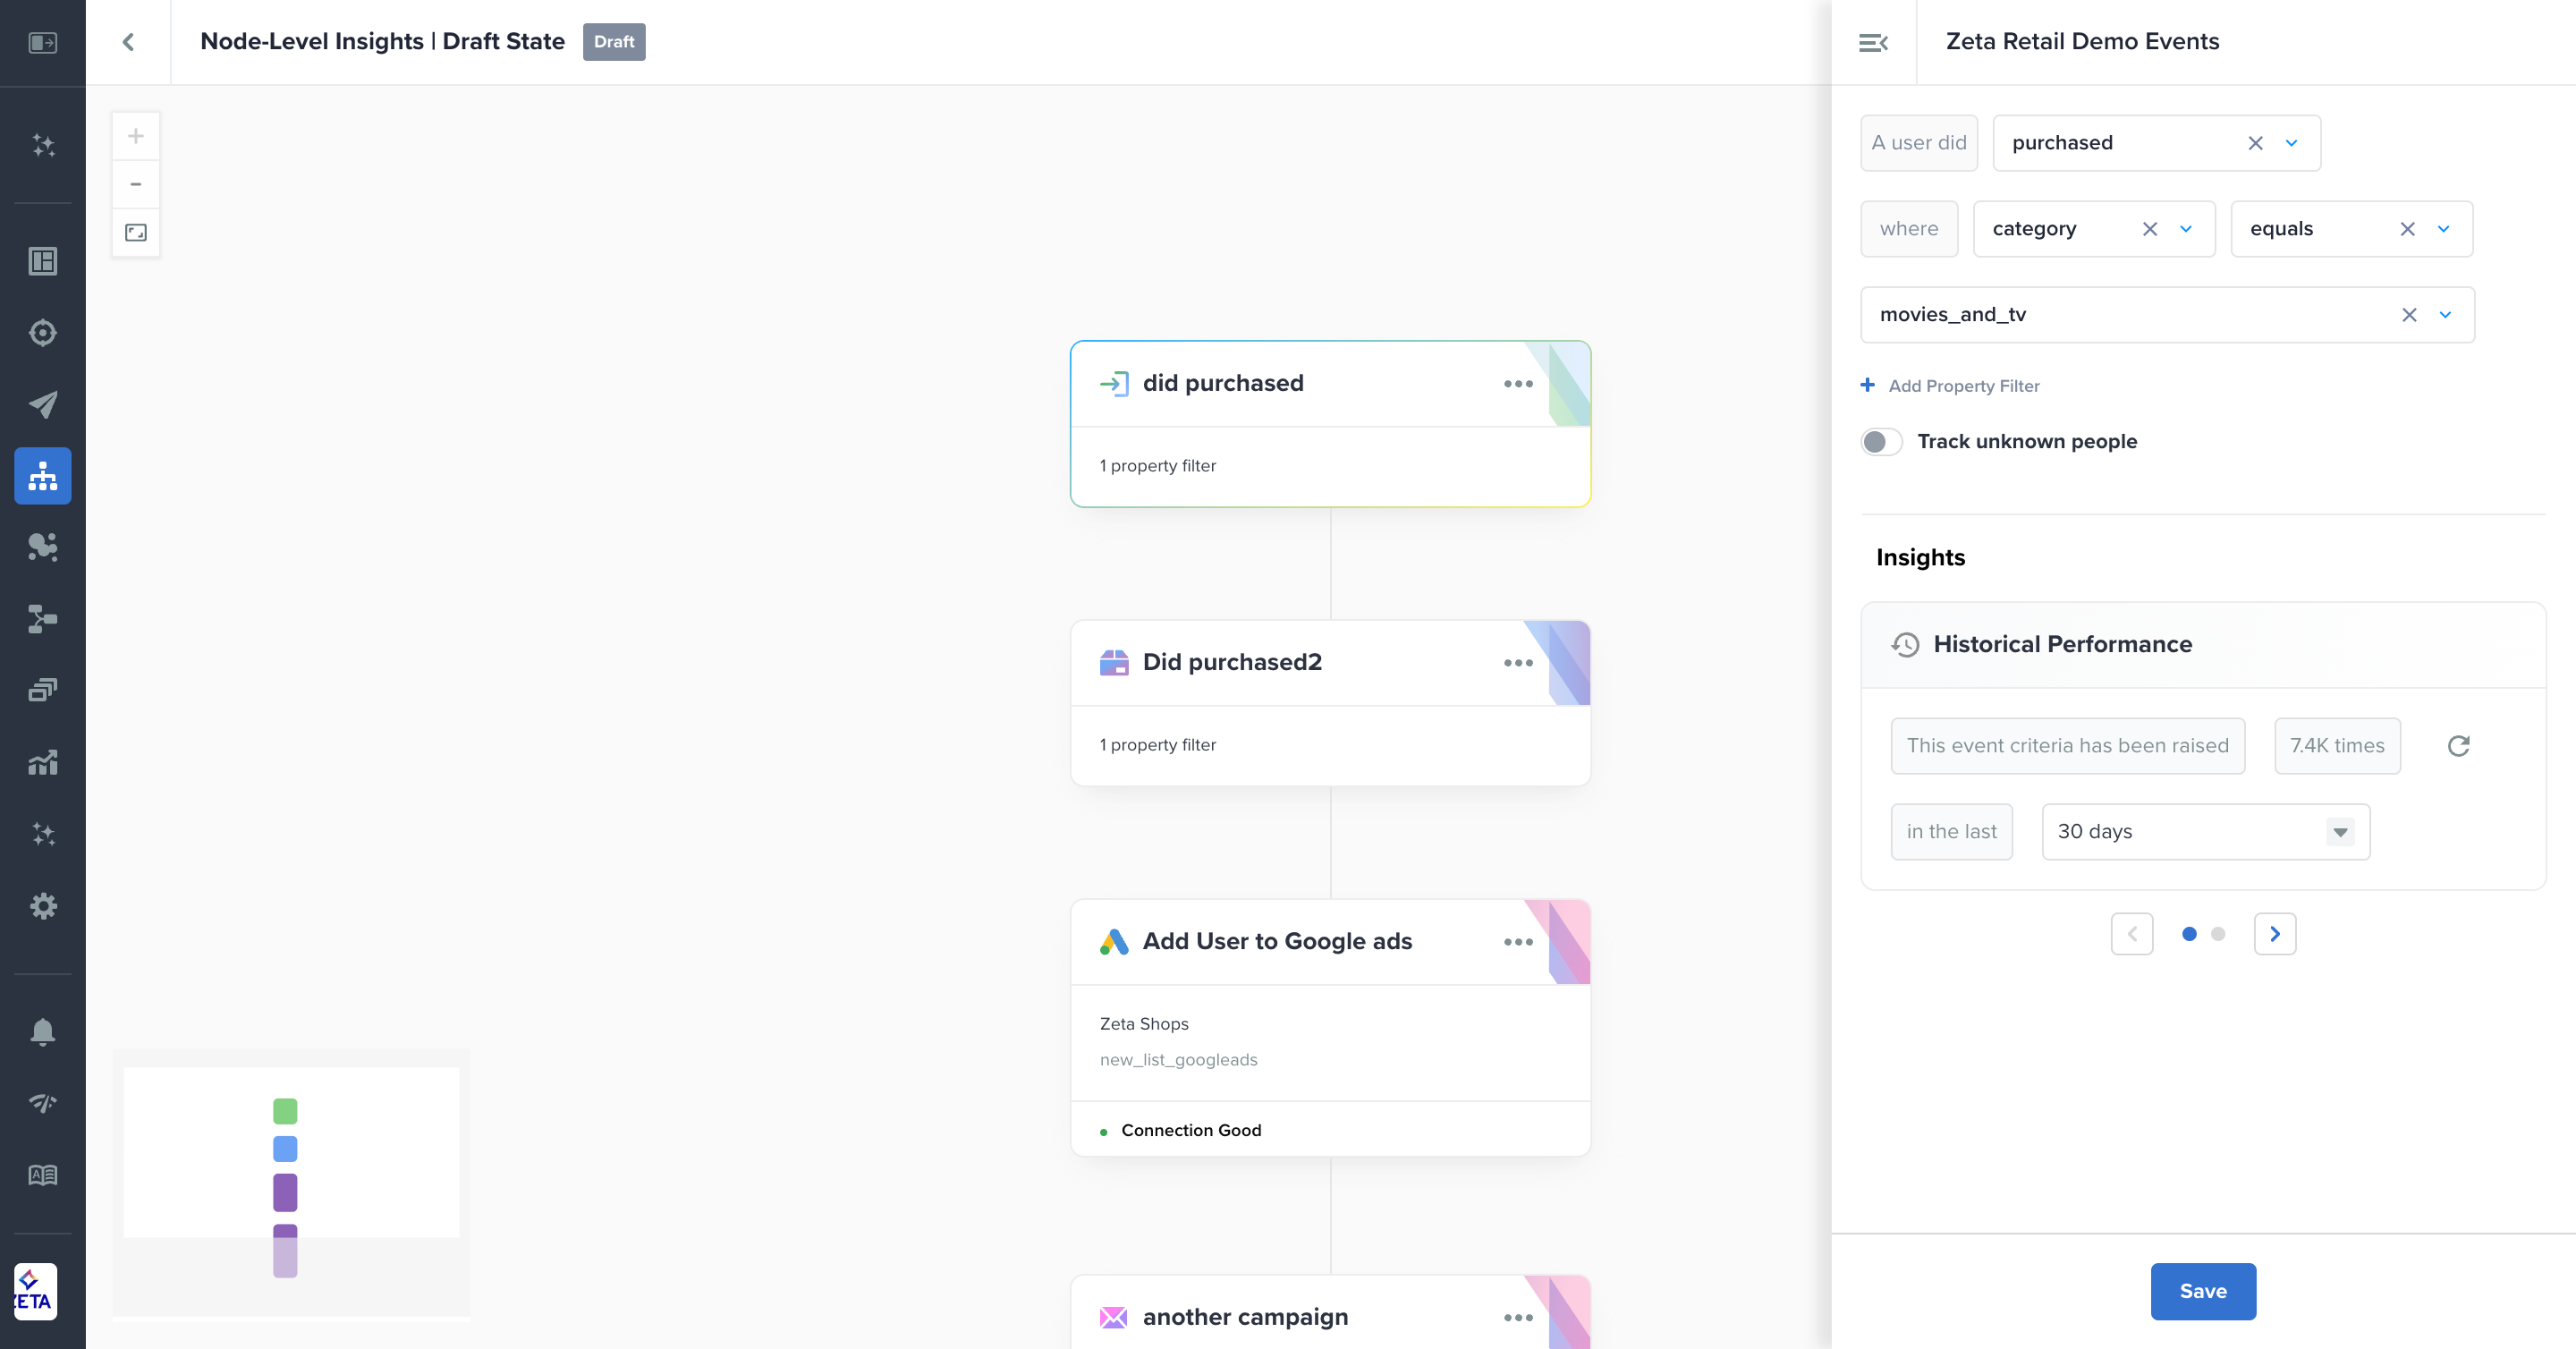
By default, you will see counts for the trigger or event node without filters applied. If you apply a property filter, the counts won’t be visible until you save the node for the first time.
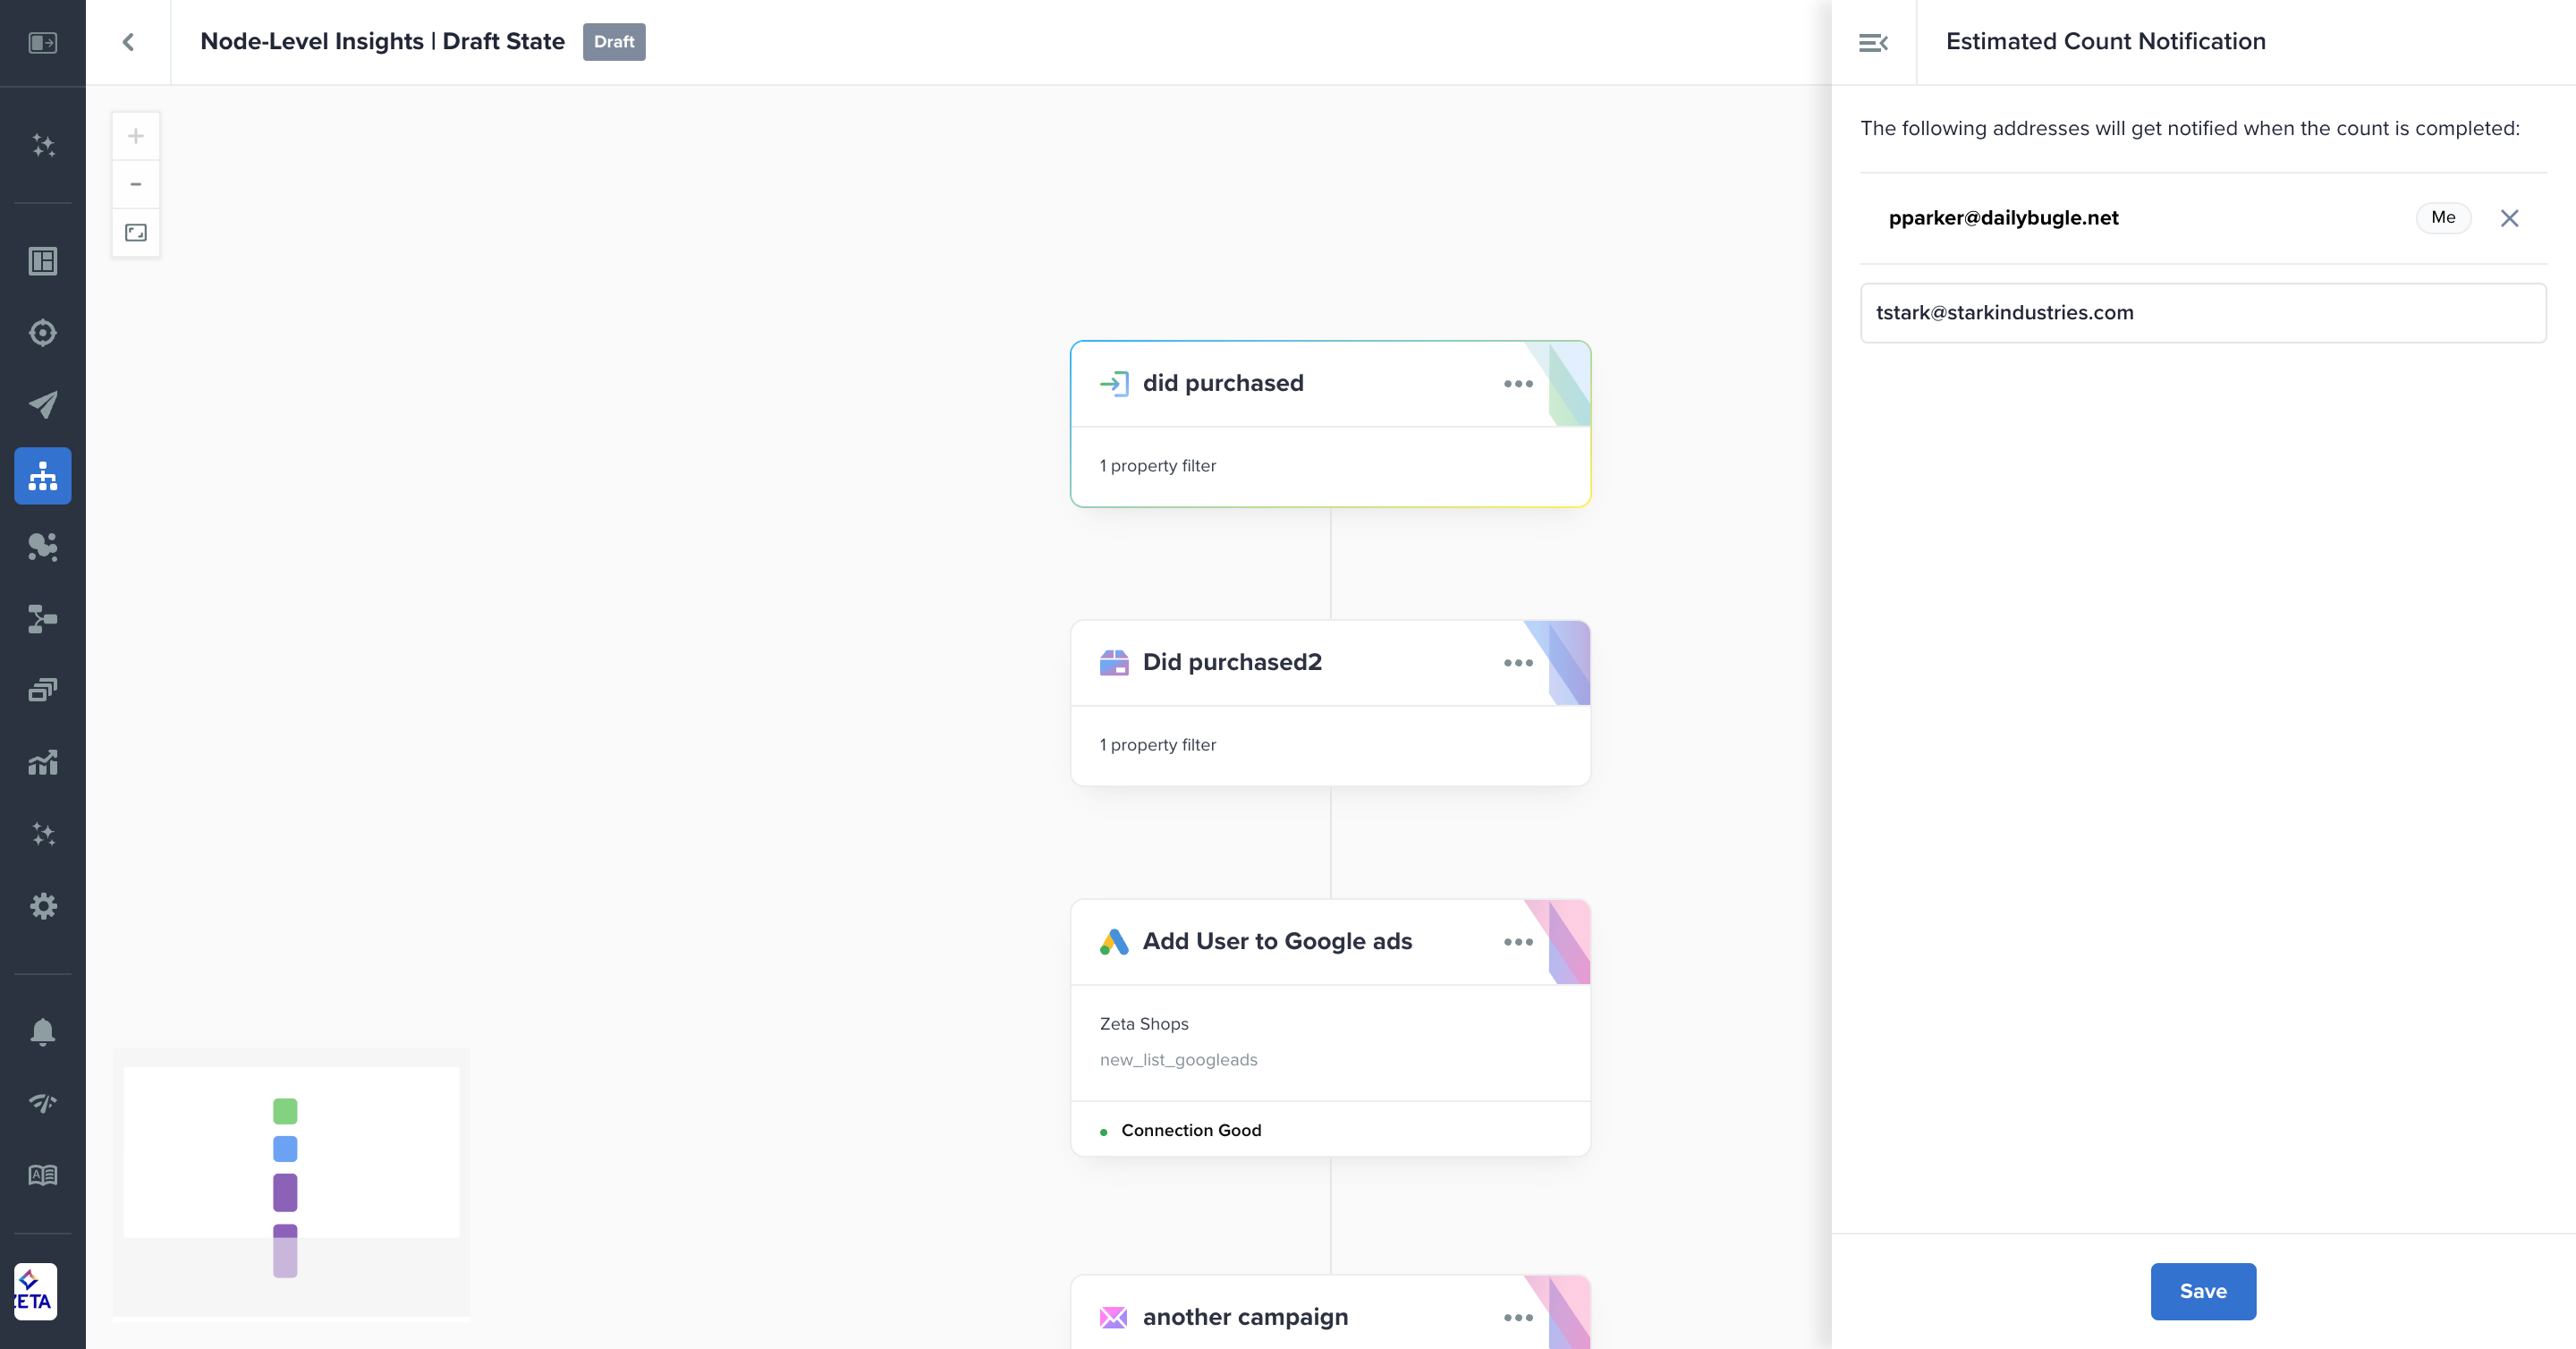
Exact Count Notifications
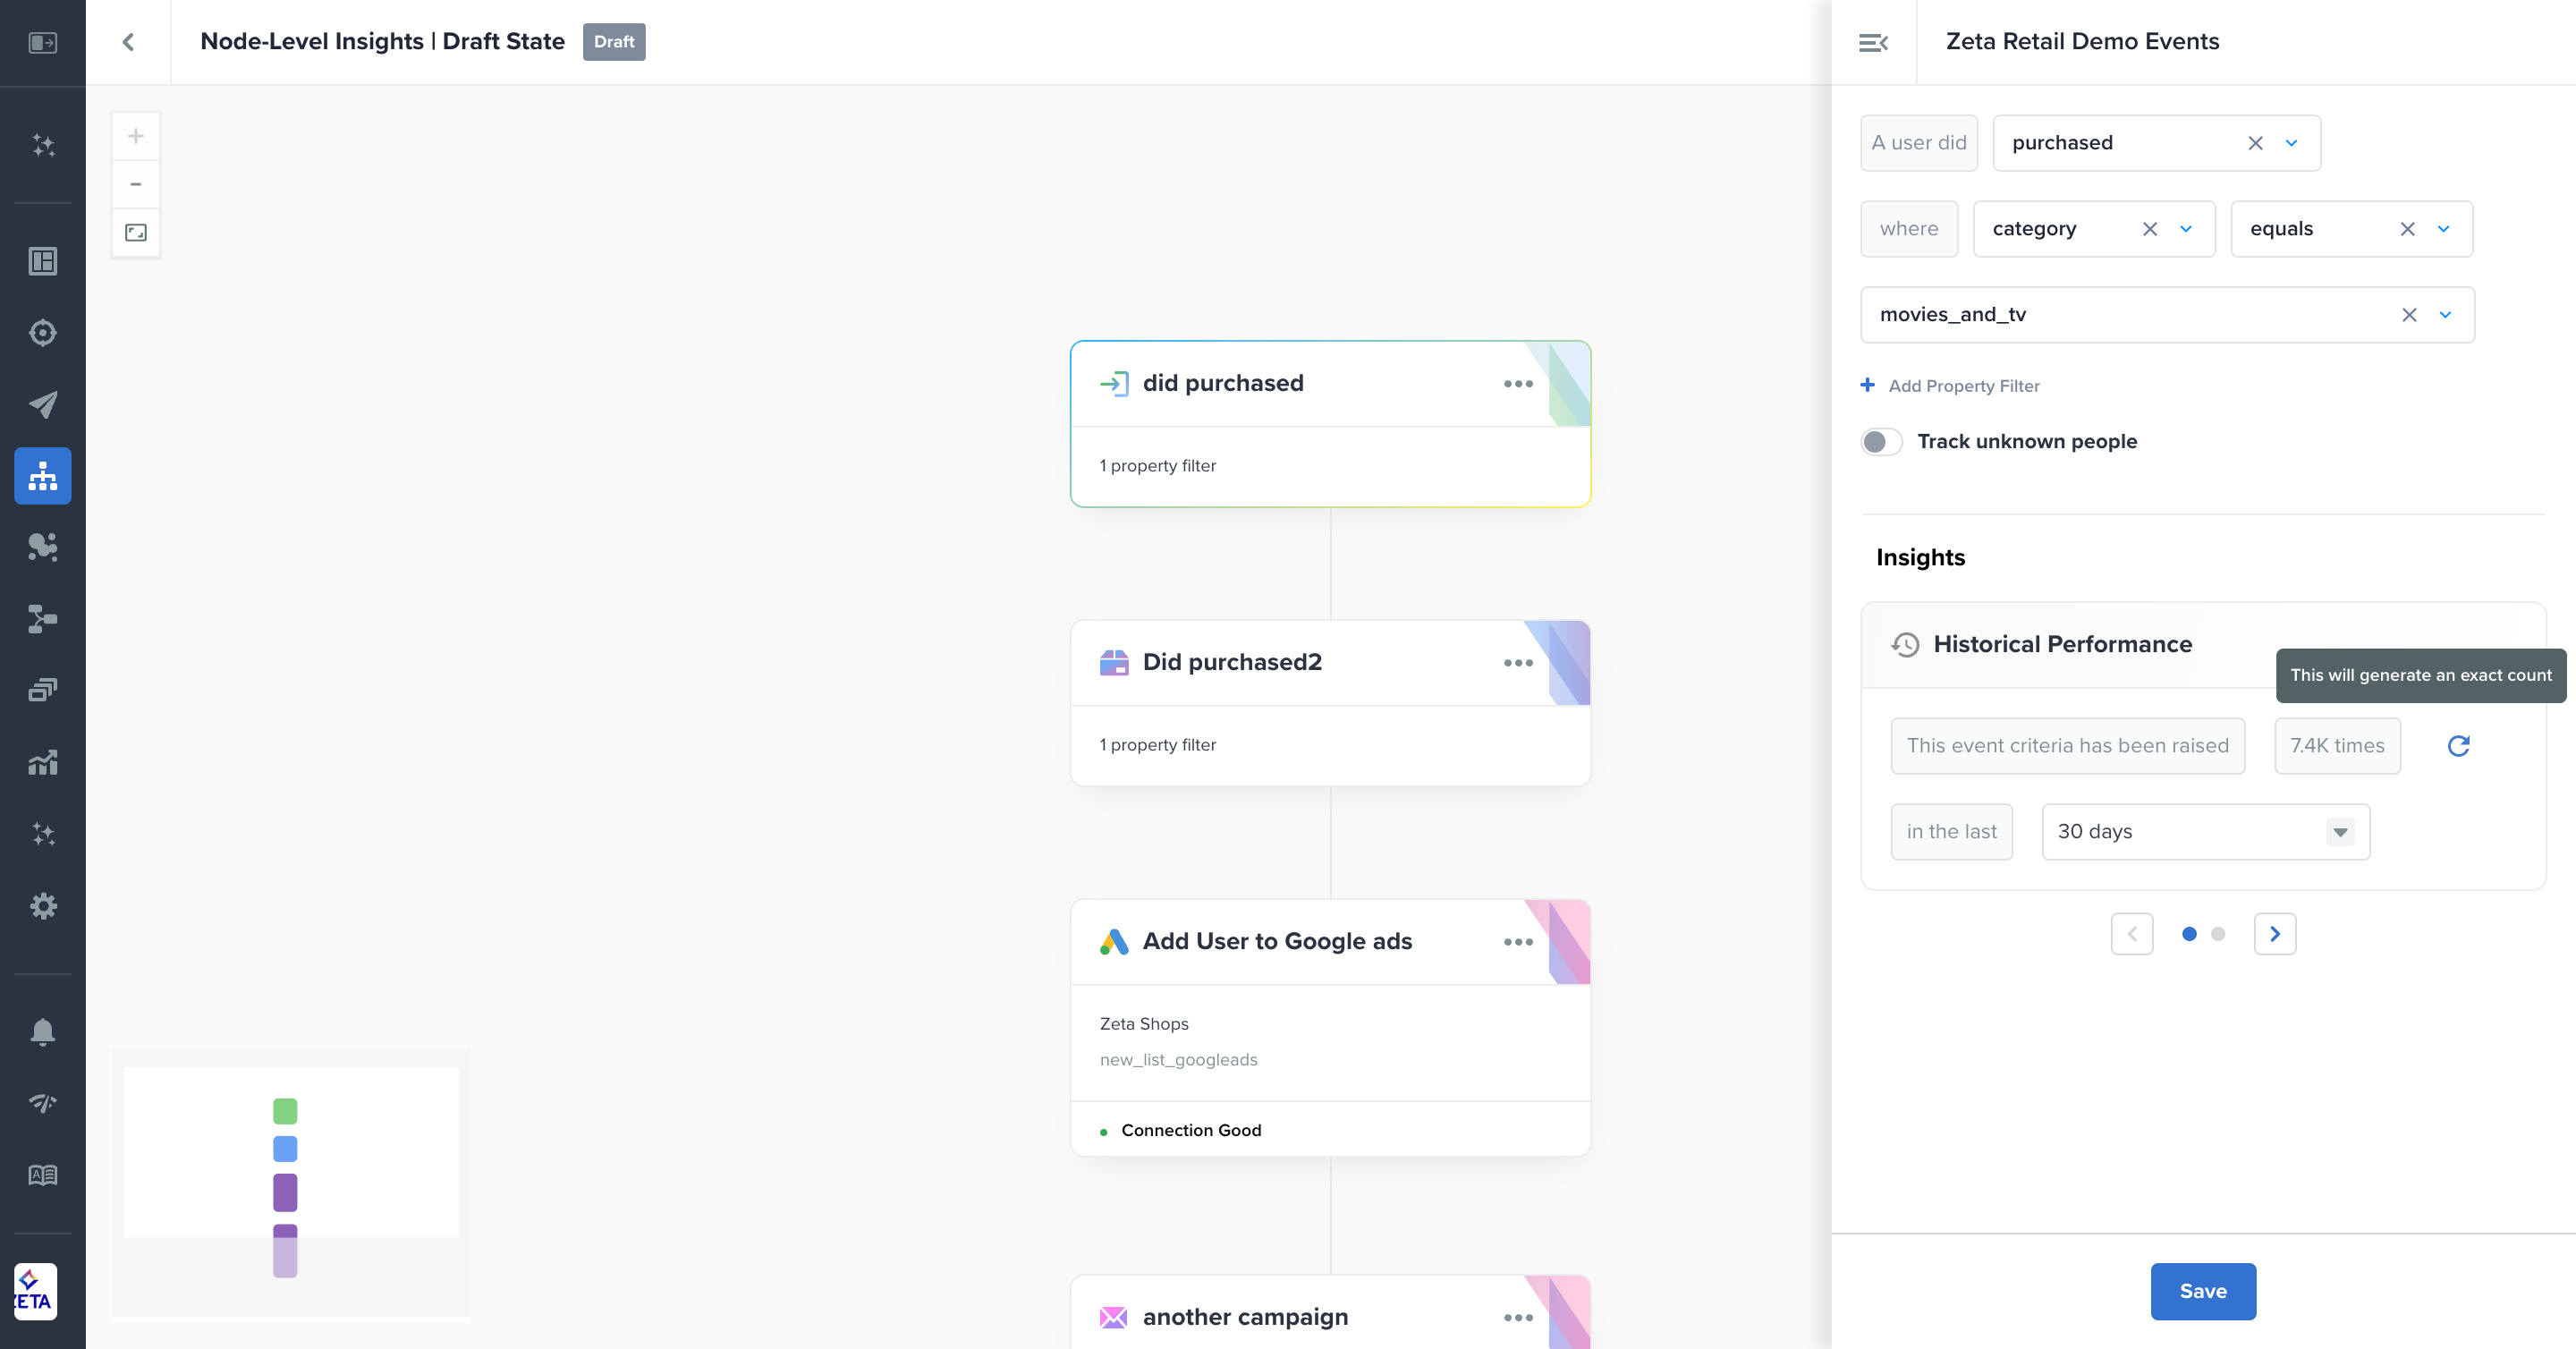
To return data faster, trigger nodes with property filters applied and all event nodes provide estimated counts for historical performance by default. If you want to see the exact count, click on the refresh button to start the query.
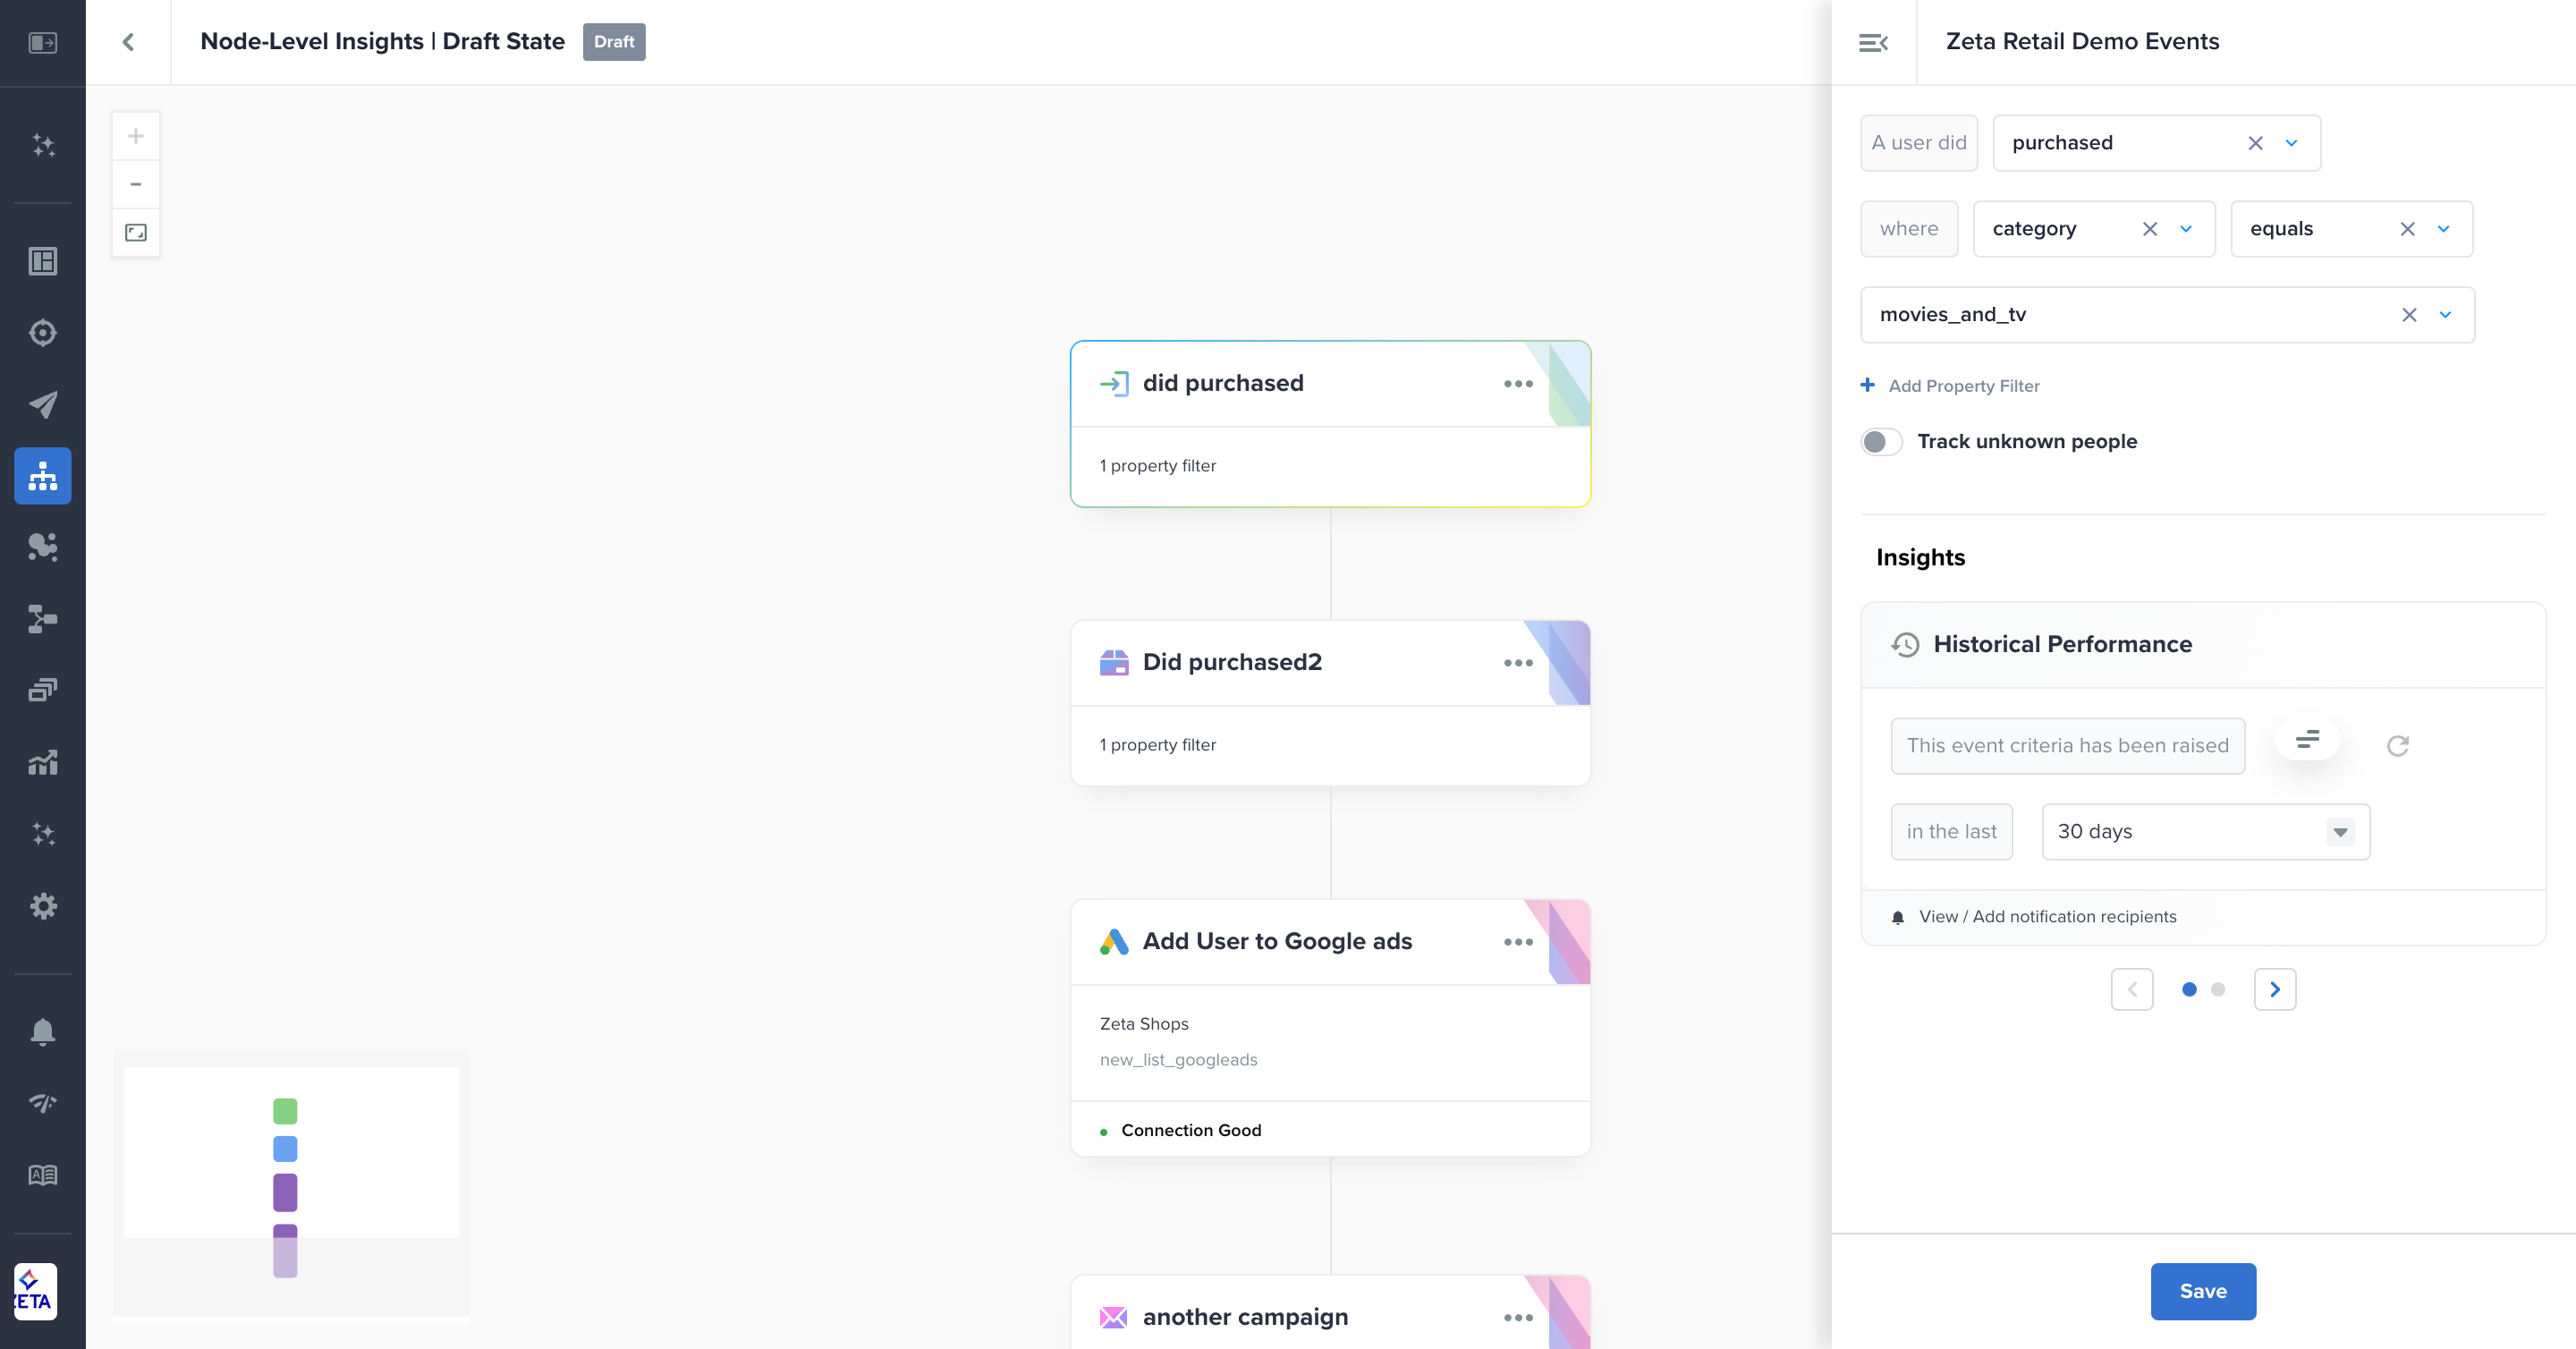
Click on Get notified when completed to get an email when your exact count calculation is done. If you’ve already requested notification for yourself, you can click on View/Add notification recipients below the counts to input additional email addresses separated by a comma. Once saved, all users listed will get a notification when the calculation is finished.
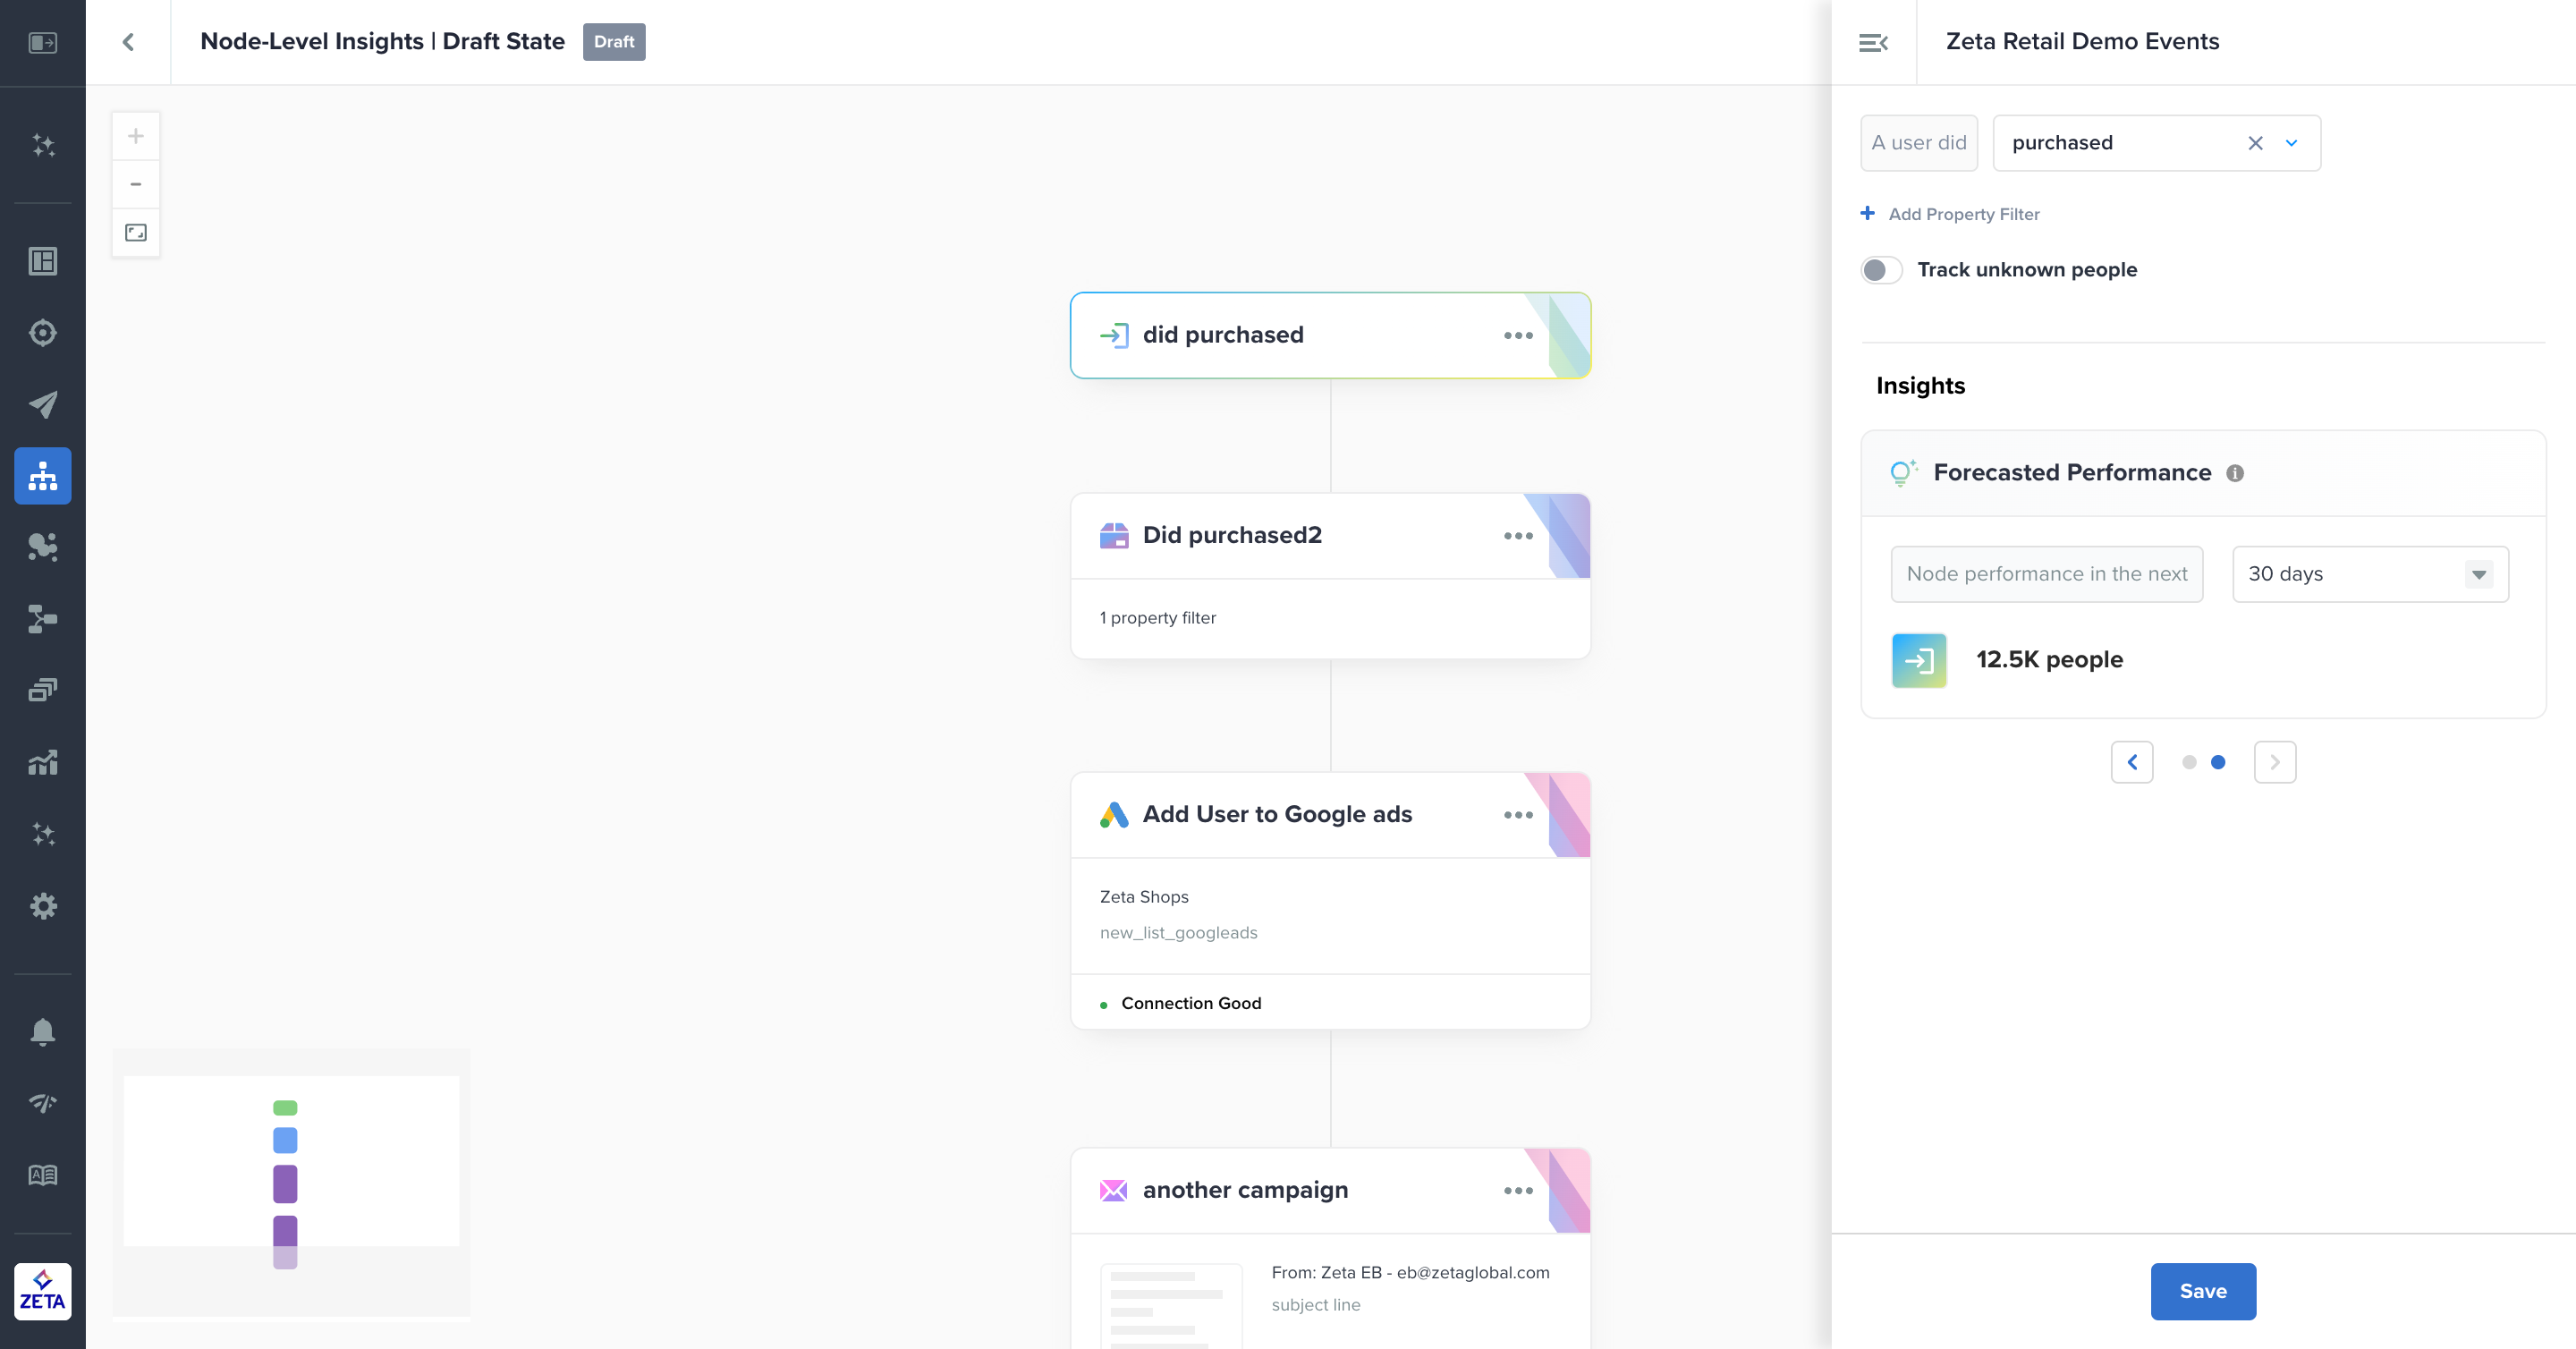
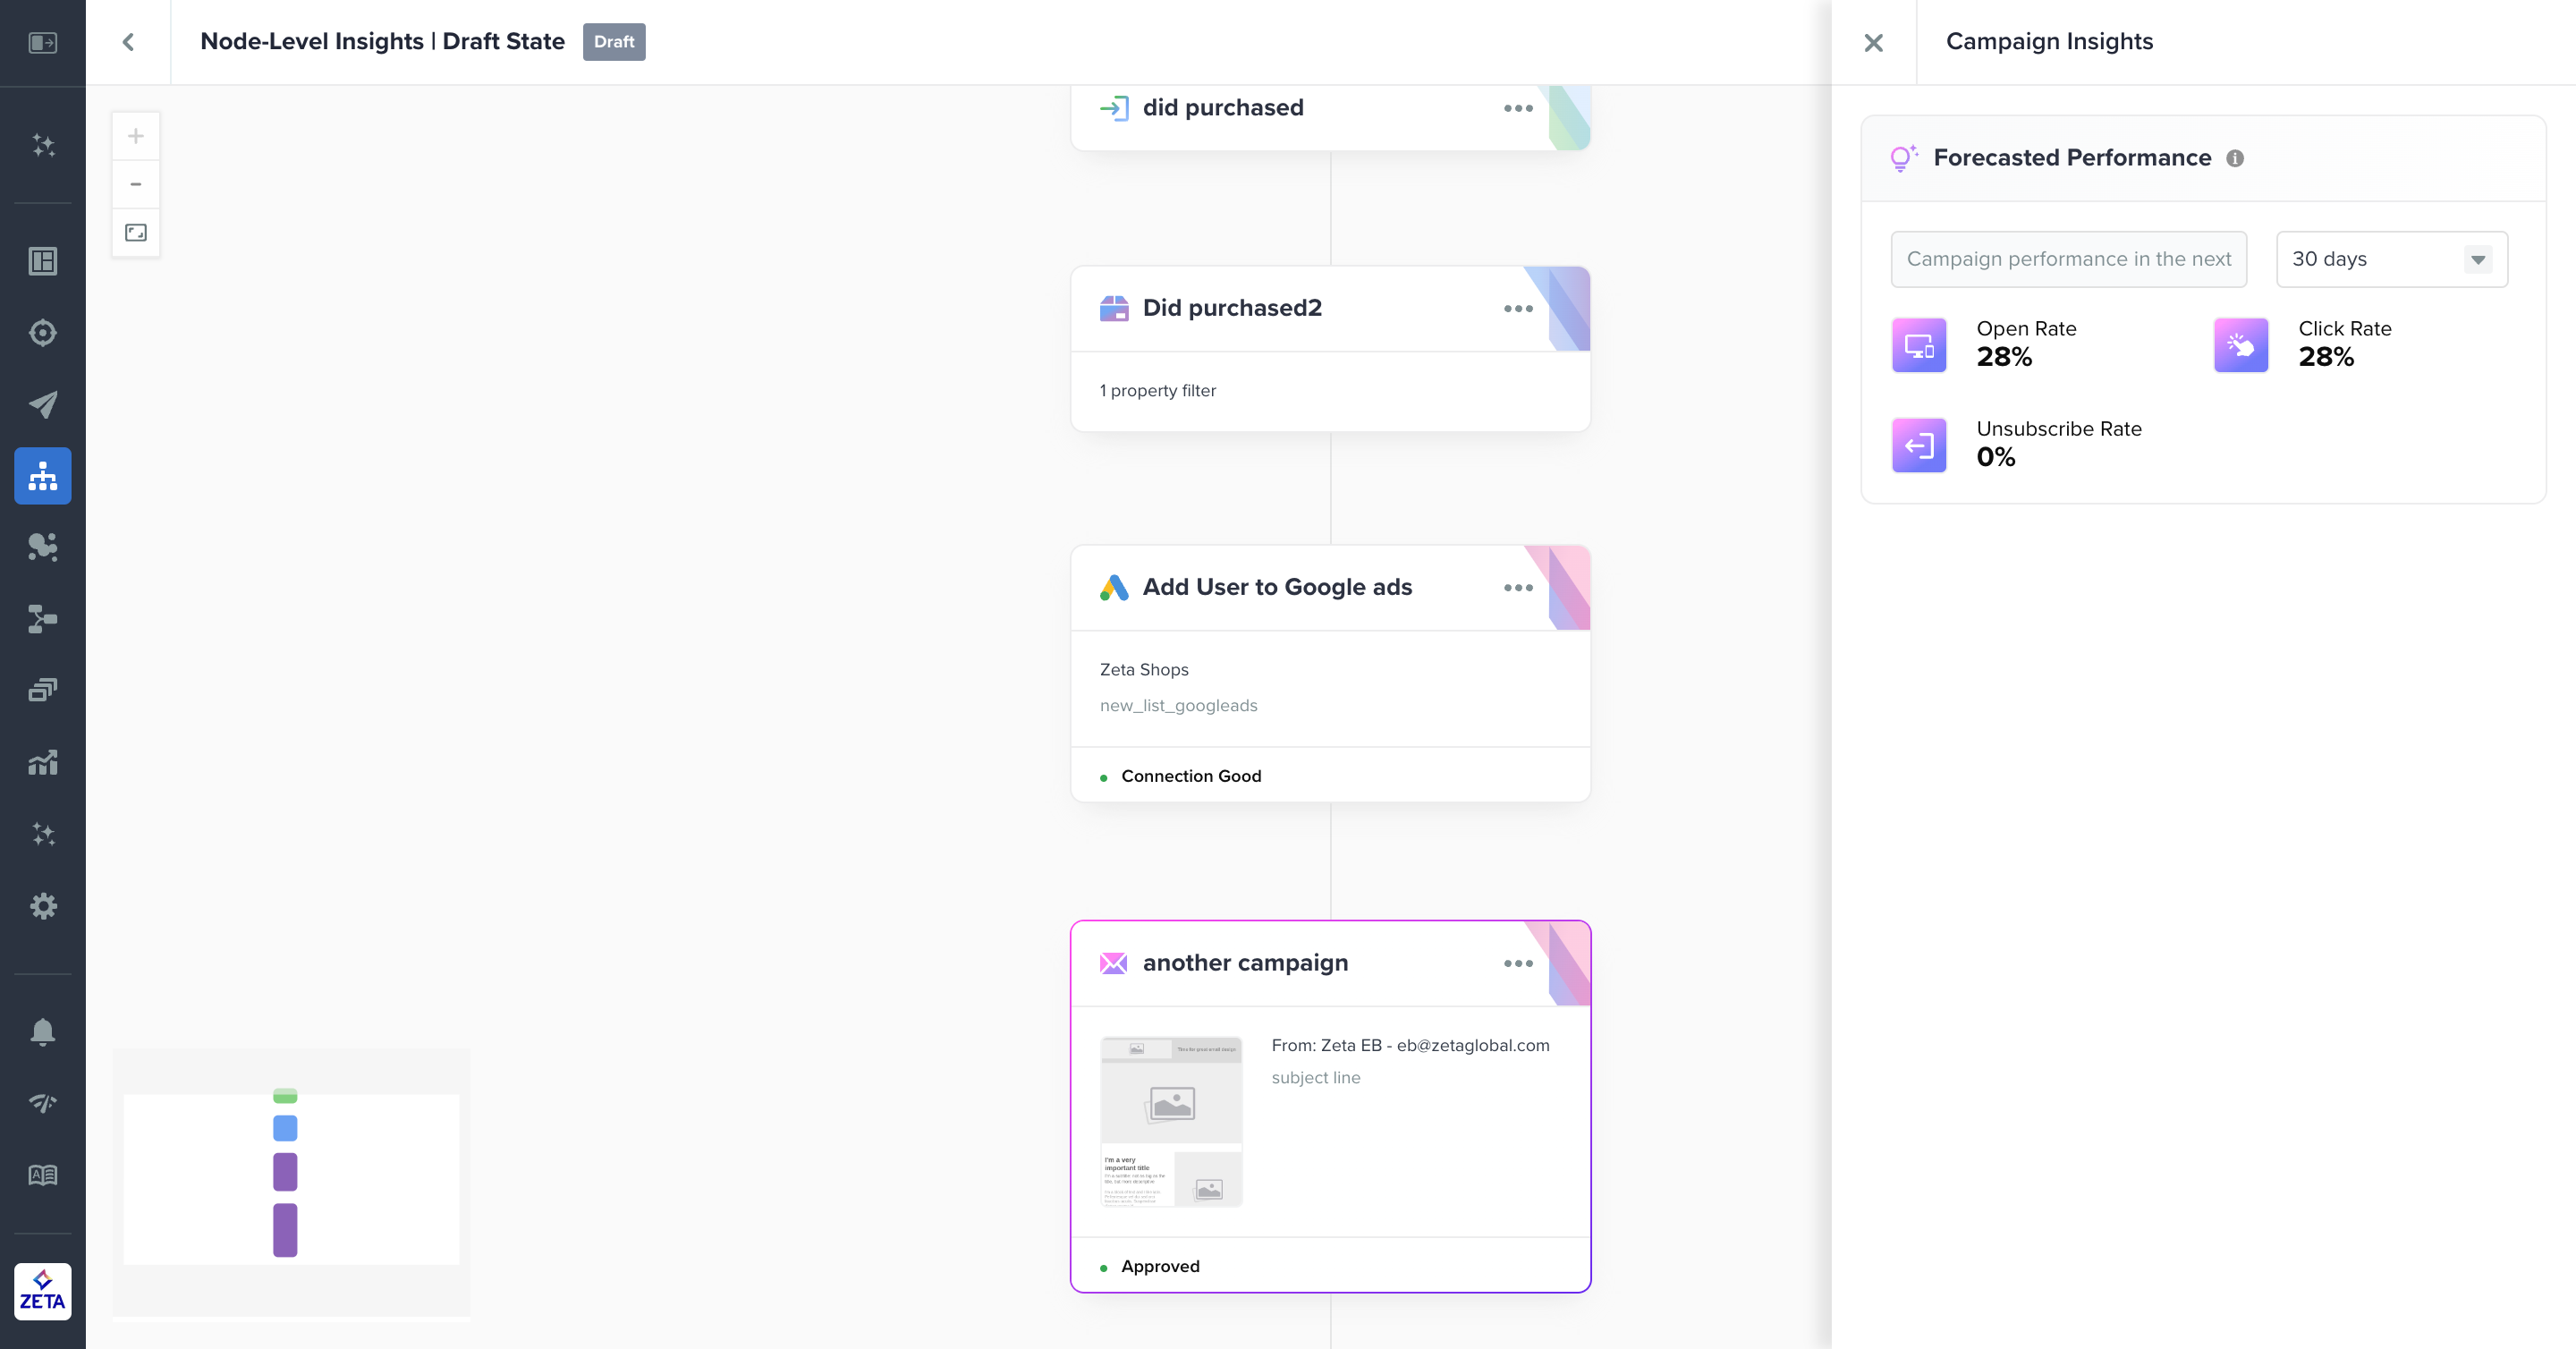
Forecasted Performance
For the trigger, event, action, and non-audience split nodes in the draft state, you will see counts to tell you how often these events are expected to be fired in the near future (1, 7, 30, or 60 days). Forecasts in the draft state will provide the counts using unique people. Email and SMS/MMS campaigns will provide forecasts using the metrics specific to the selected channel.
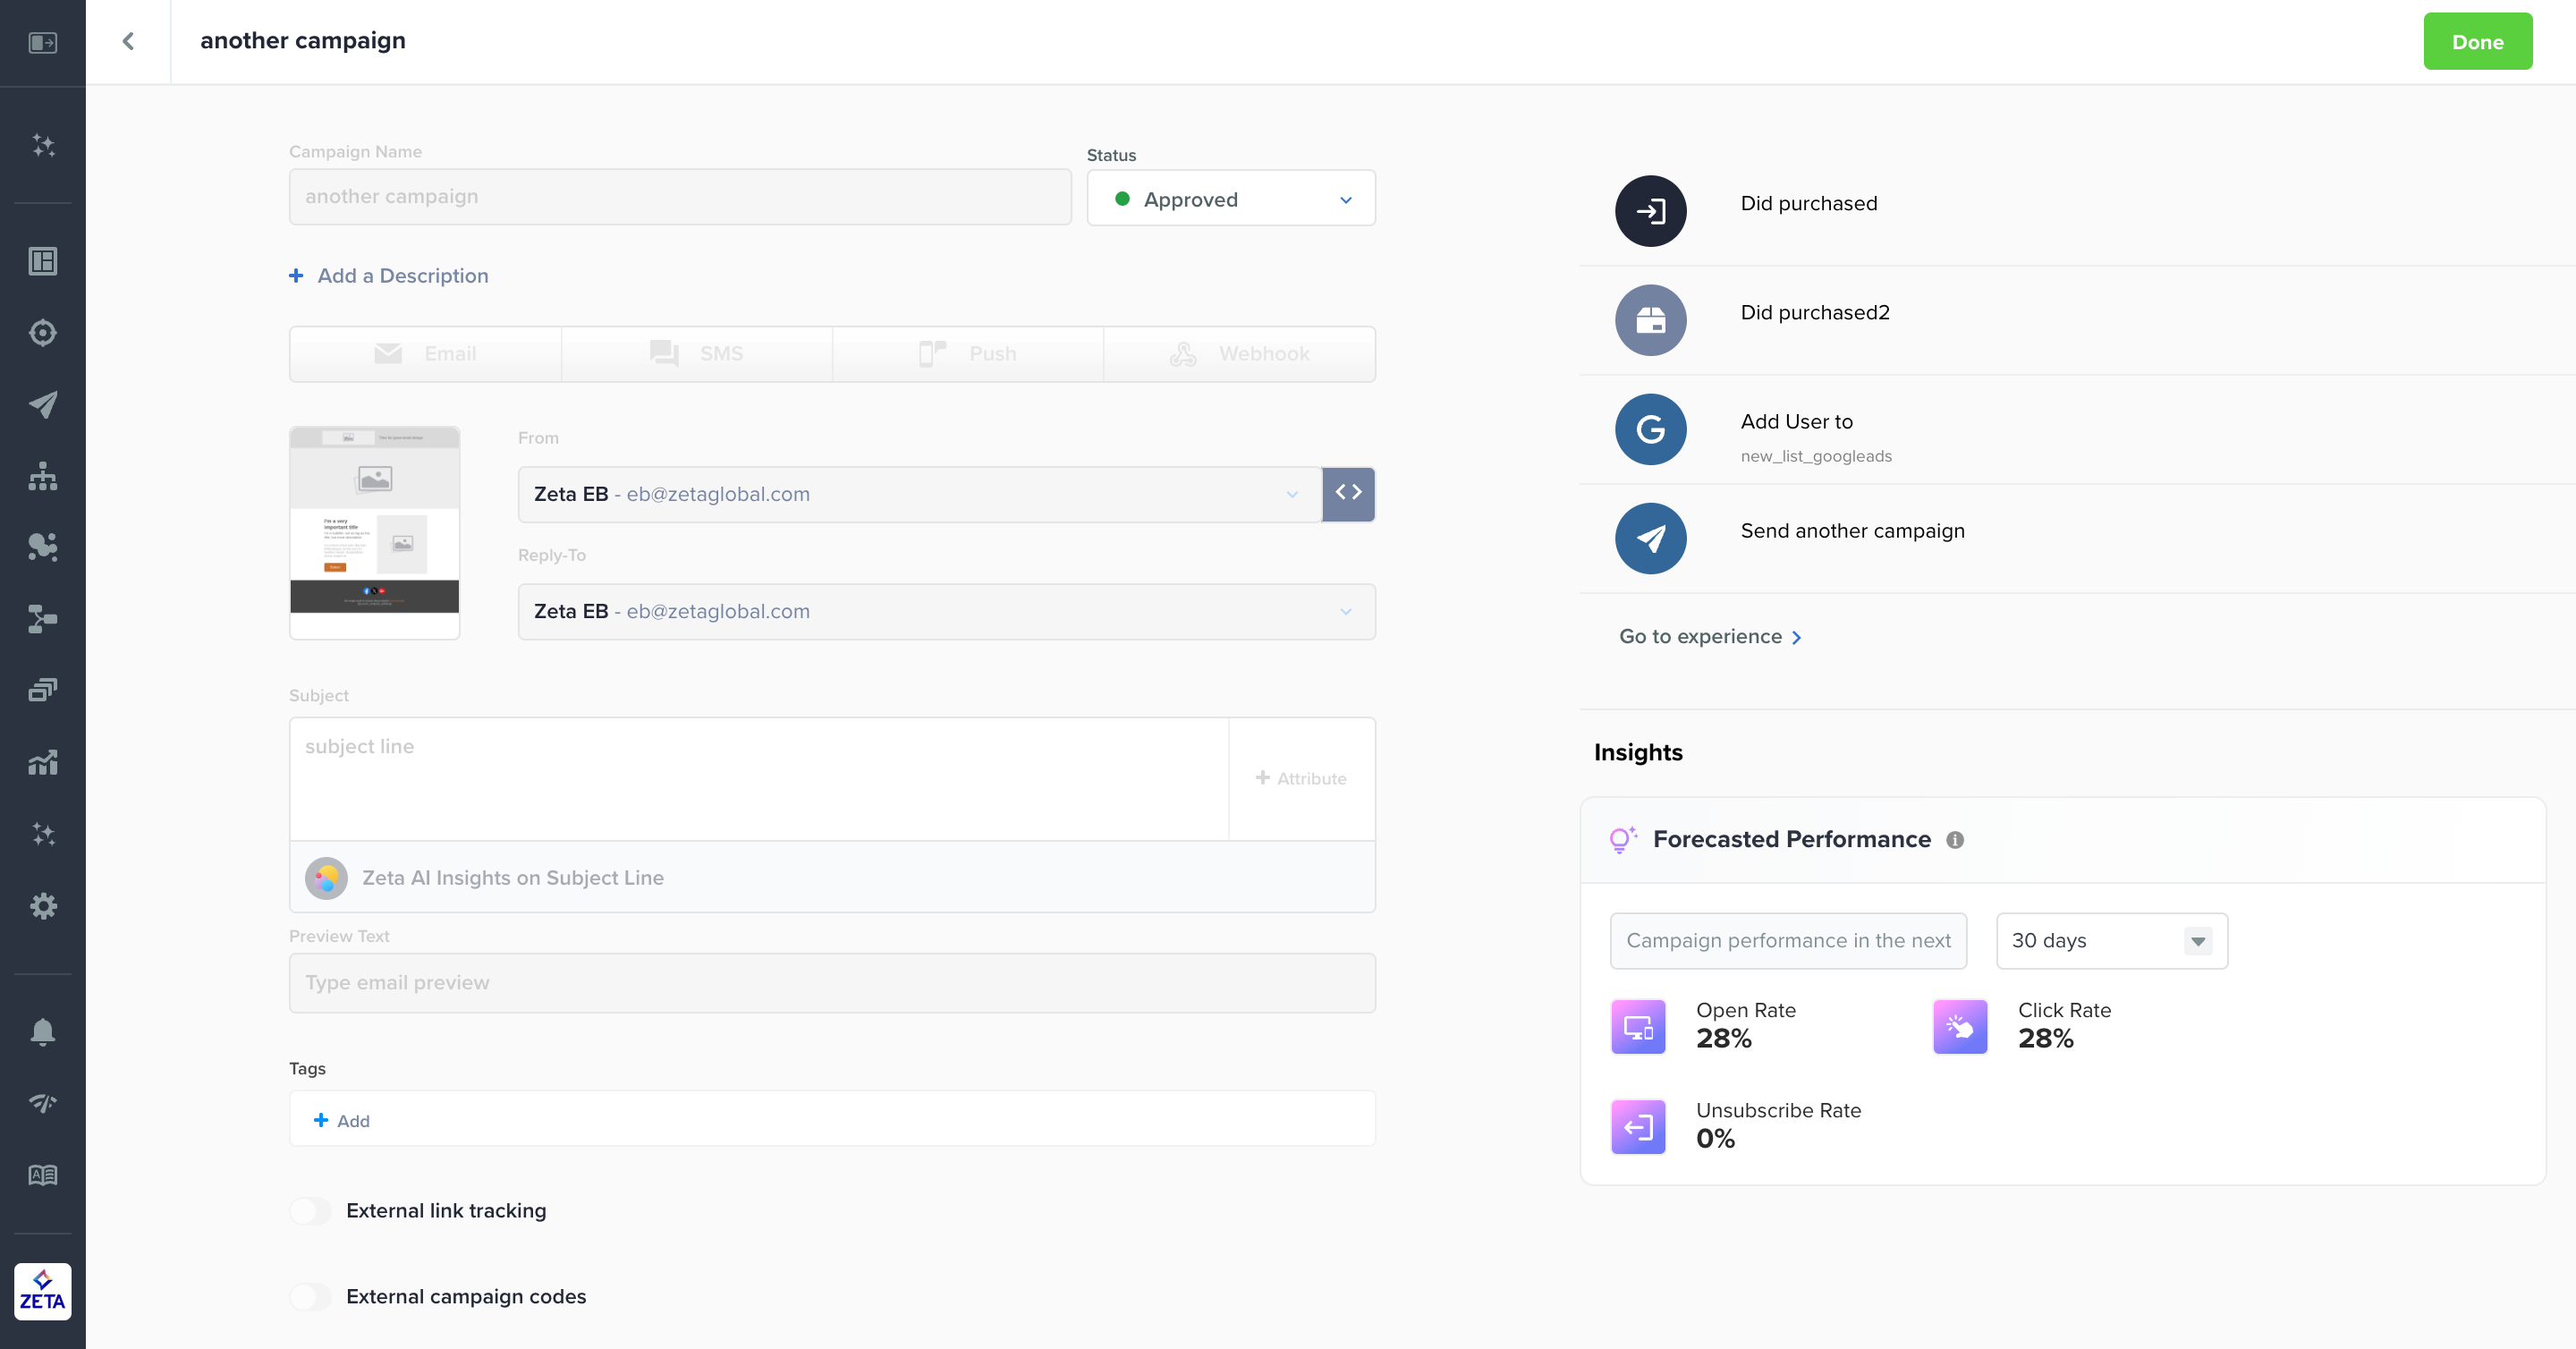
Campaign forecasts can be found in the side panel and in the Campaign Builder. In the draft state, these metrics correlate across general campaign performance and don’t change based on content inputs. The only supported channels for forecasting are email and SMS/MMS.
The chart below lists what to expect by node type and exceptions for both historical and forecasted performance in the draft state.
|
Node Type |
Sample Nodes |
Data in Draft State |
Definition |
|---|---|---|---|
|
Trigger Node |
|
|
Does not apply to Use an Audience or High Priority Messaging |
|
Event Node |
|
|
|
|
Action Node (Campaigns) |
|
|
This does not apply to push, webhook, and third-party channel campaigns |
|
Action Node (Non-Campaigns) |
|
|
|
|
Split Node |
|
|
This does not apply to non-audience splits |
Active State
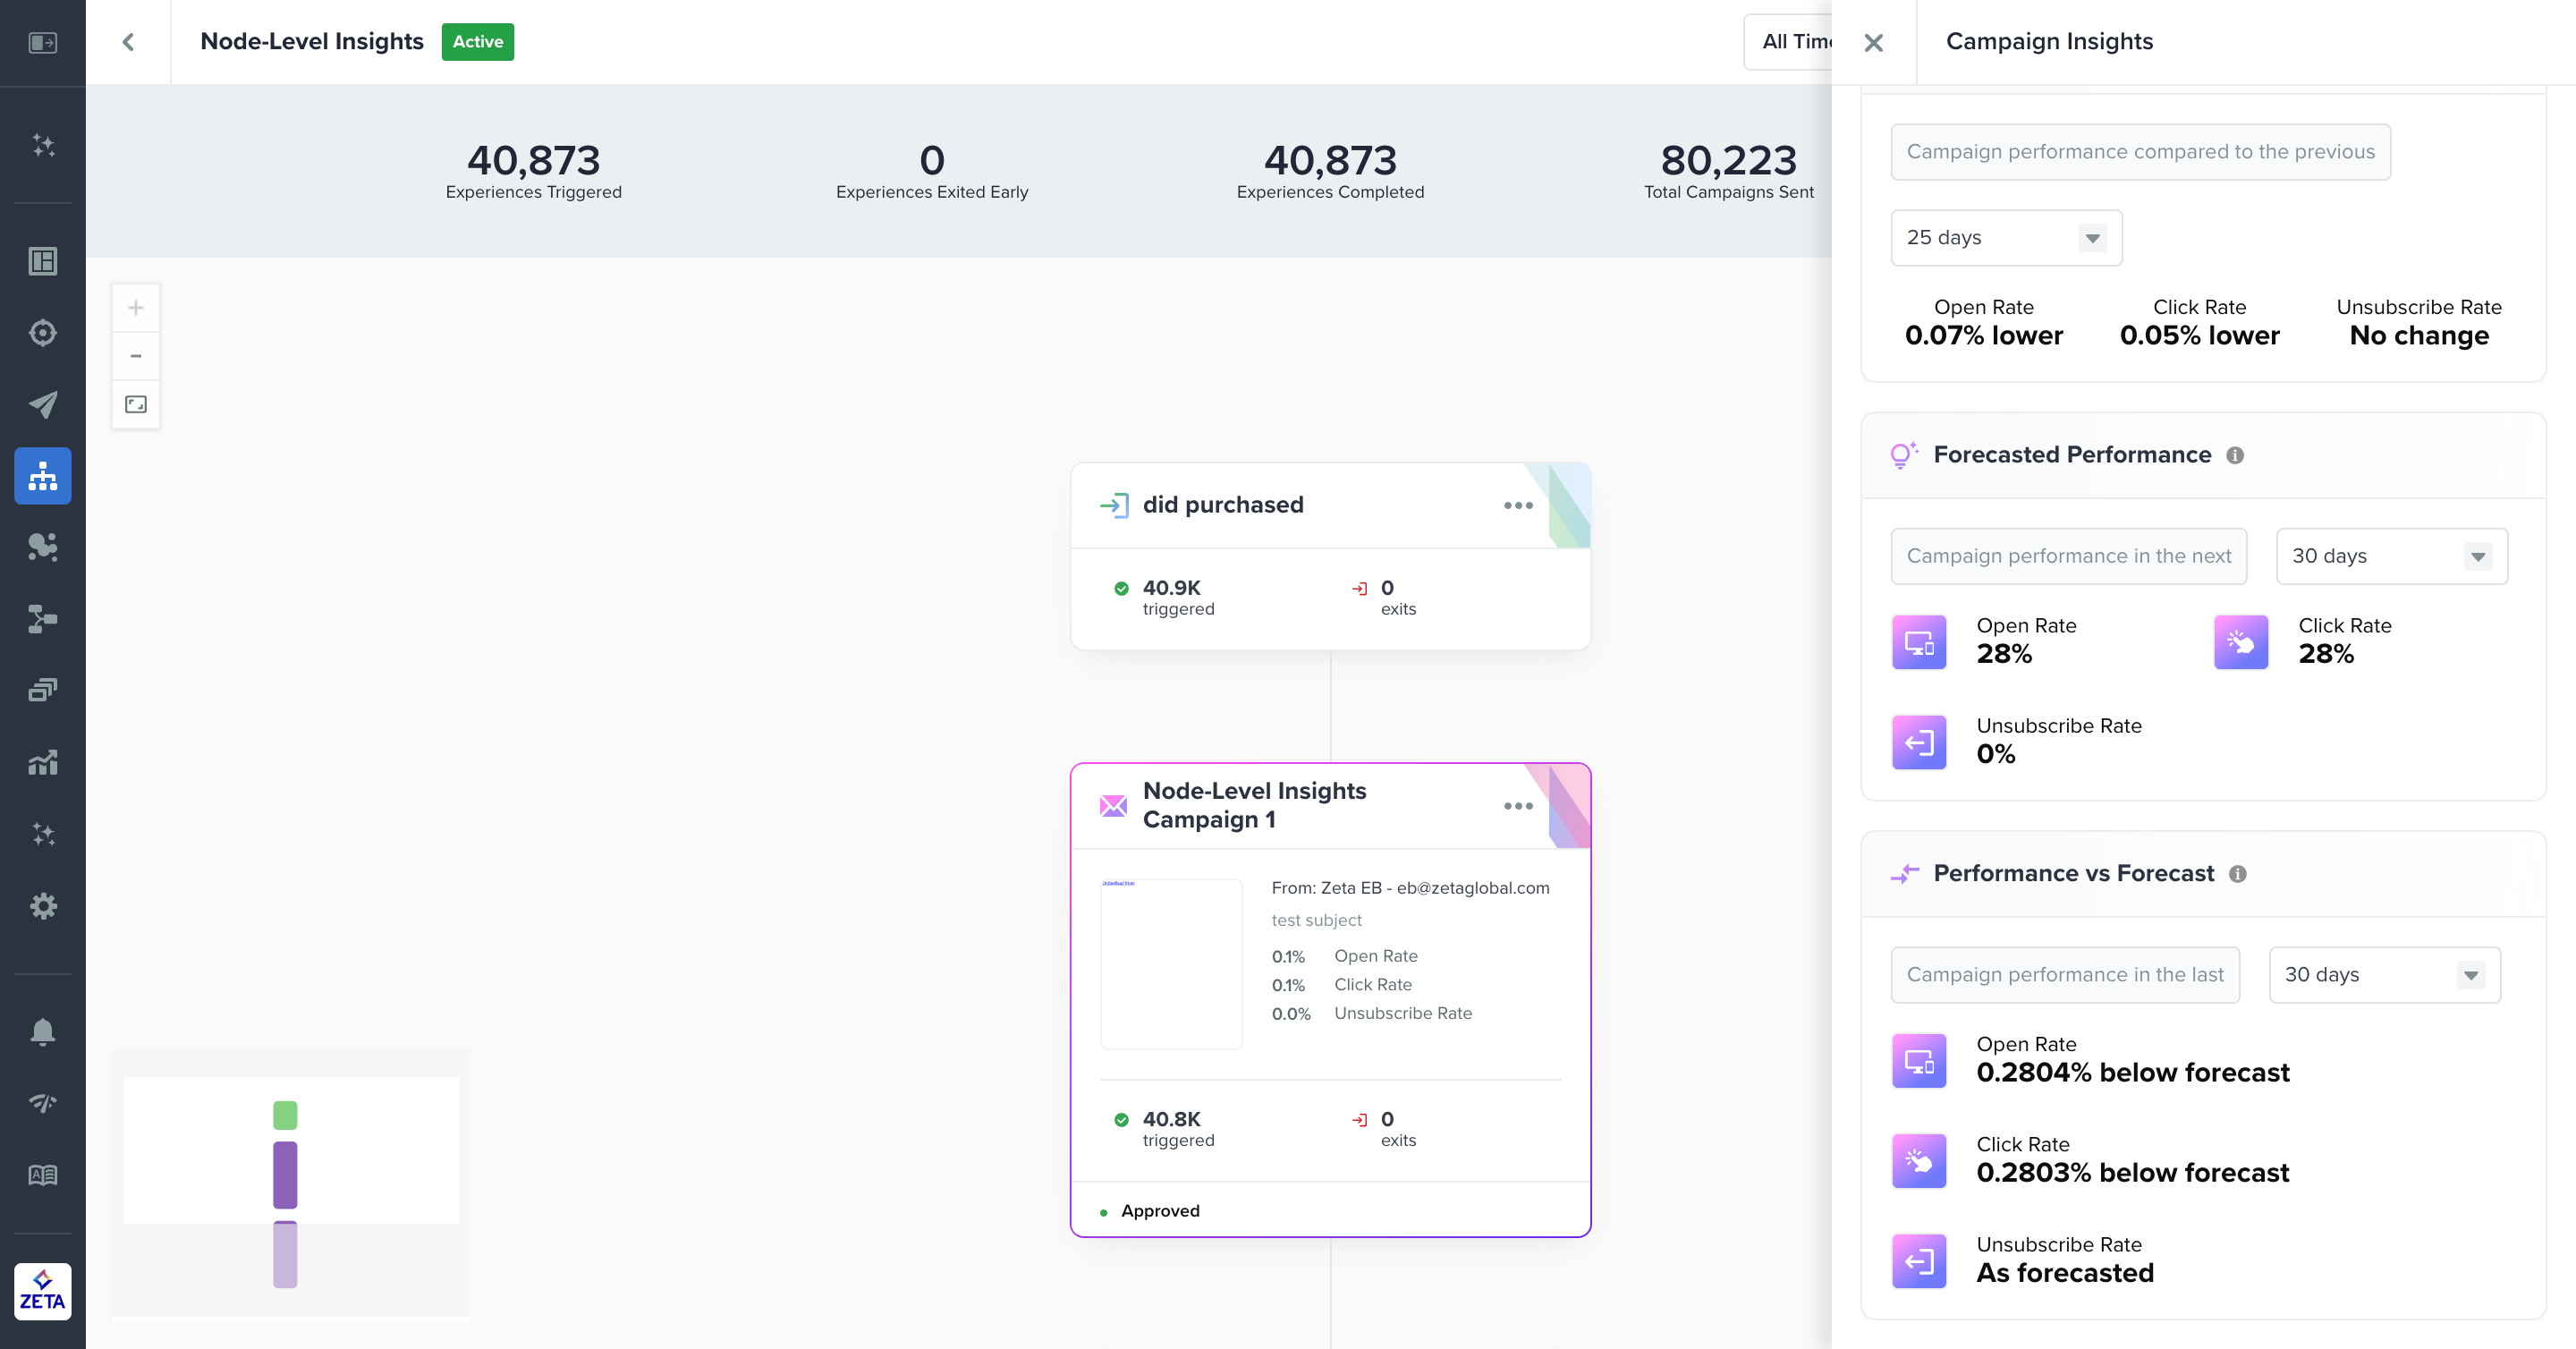
Once you activate your experience, you’ll see three possible data points in the Insights module to help you measure your performance contextually and continue forecasting performance over the next set of days.
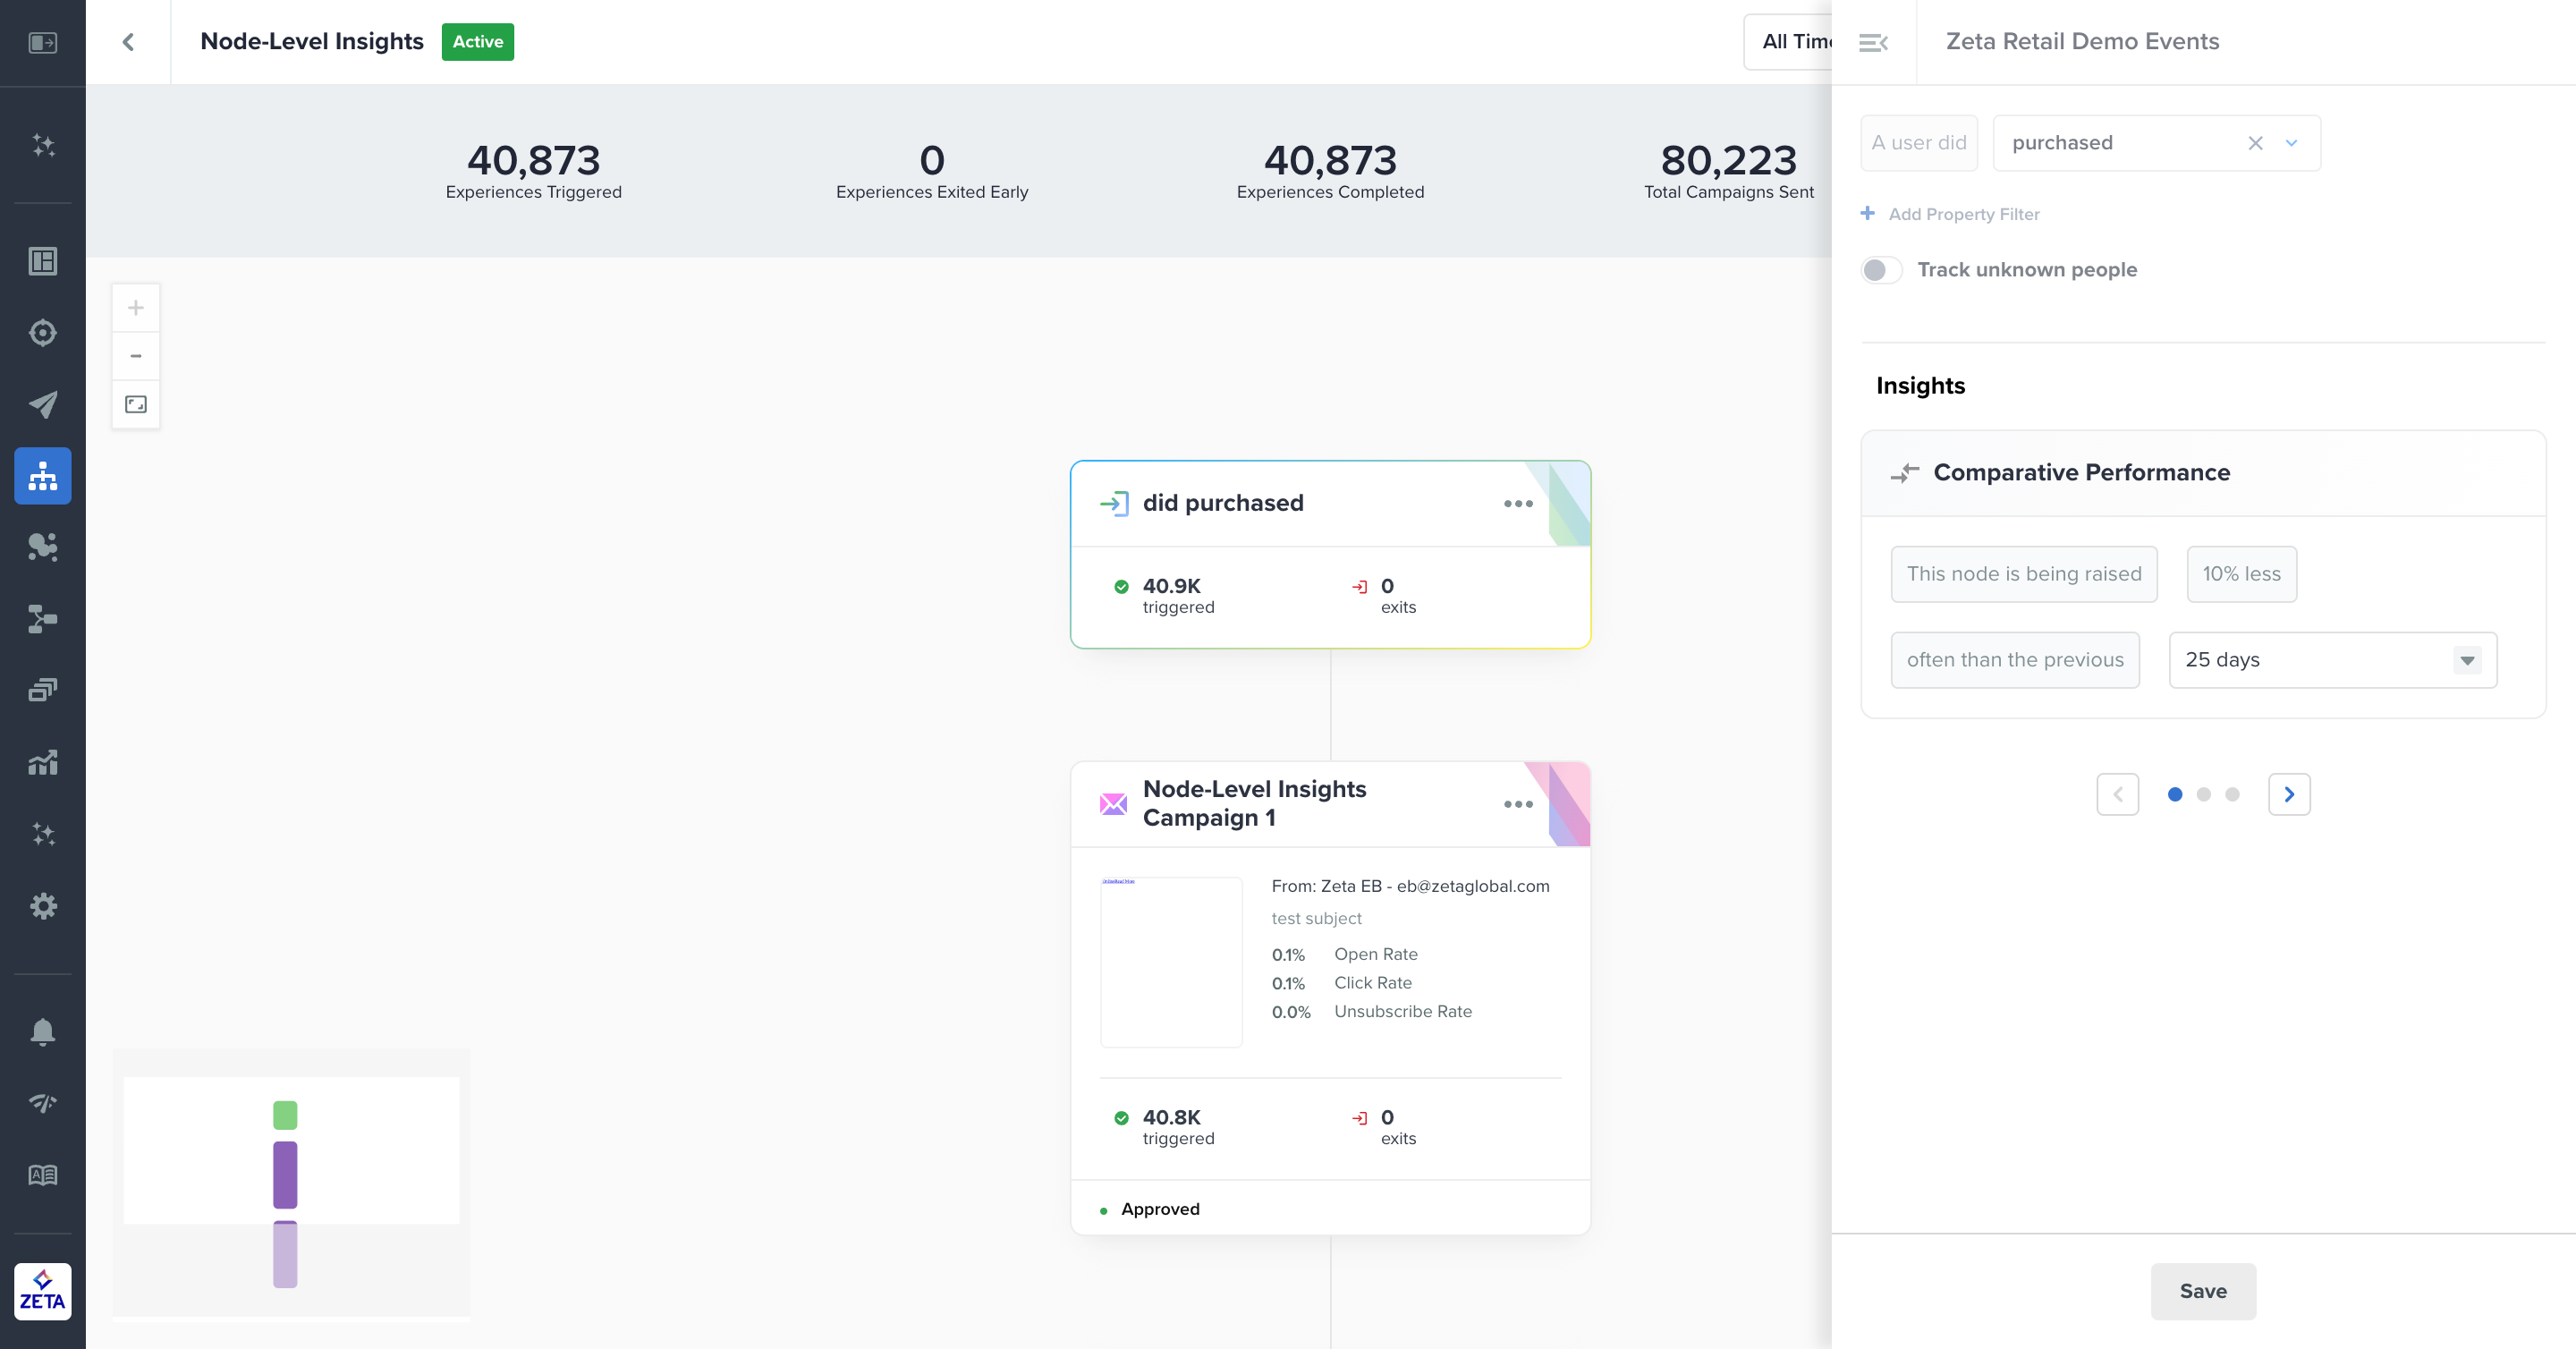
Comparative Performance
For all nodes in experiences activated for at least 2 days, you will see percentages to tell you how the node is performing against itself compared to the previous set of days. For example, if a node has been active for 90 days, it will compare the last 30 days to the previous 30 days and show the percentage change between them. This will help you identify trends and determine if you need to make changes to the node criteria.
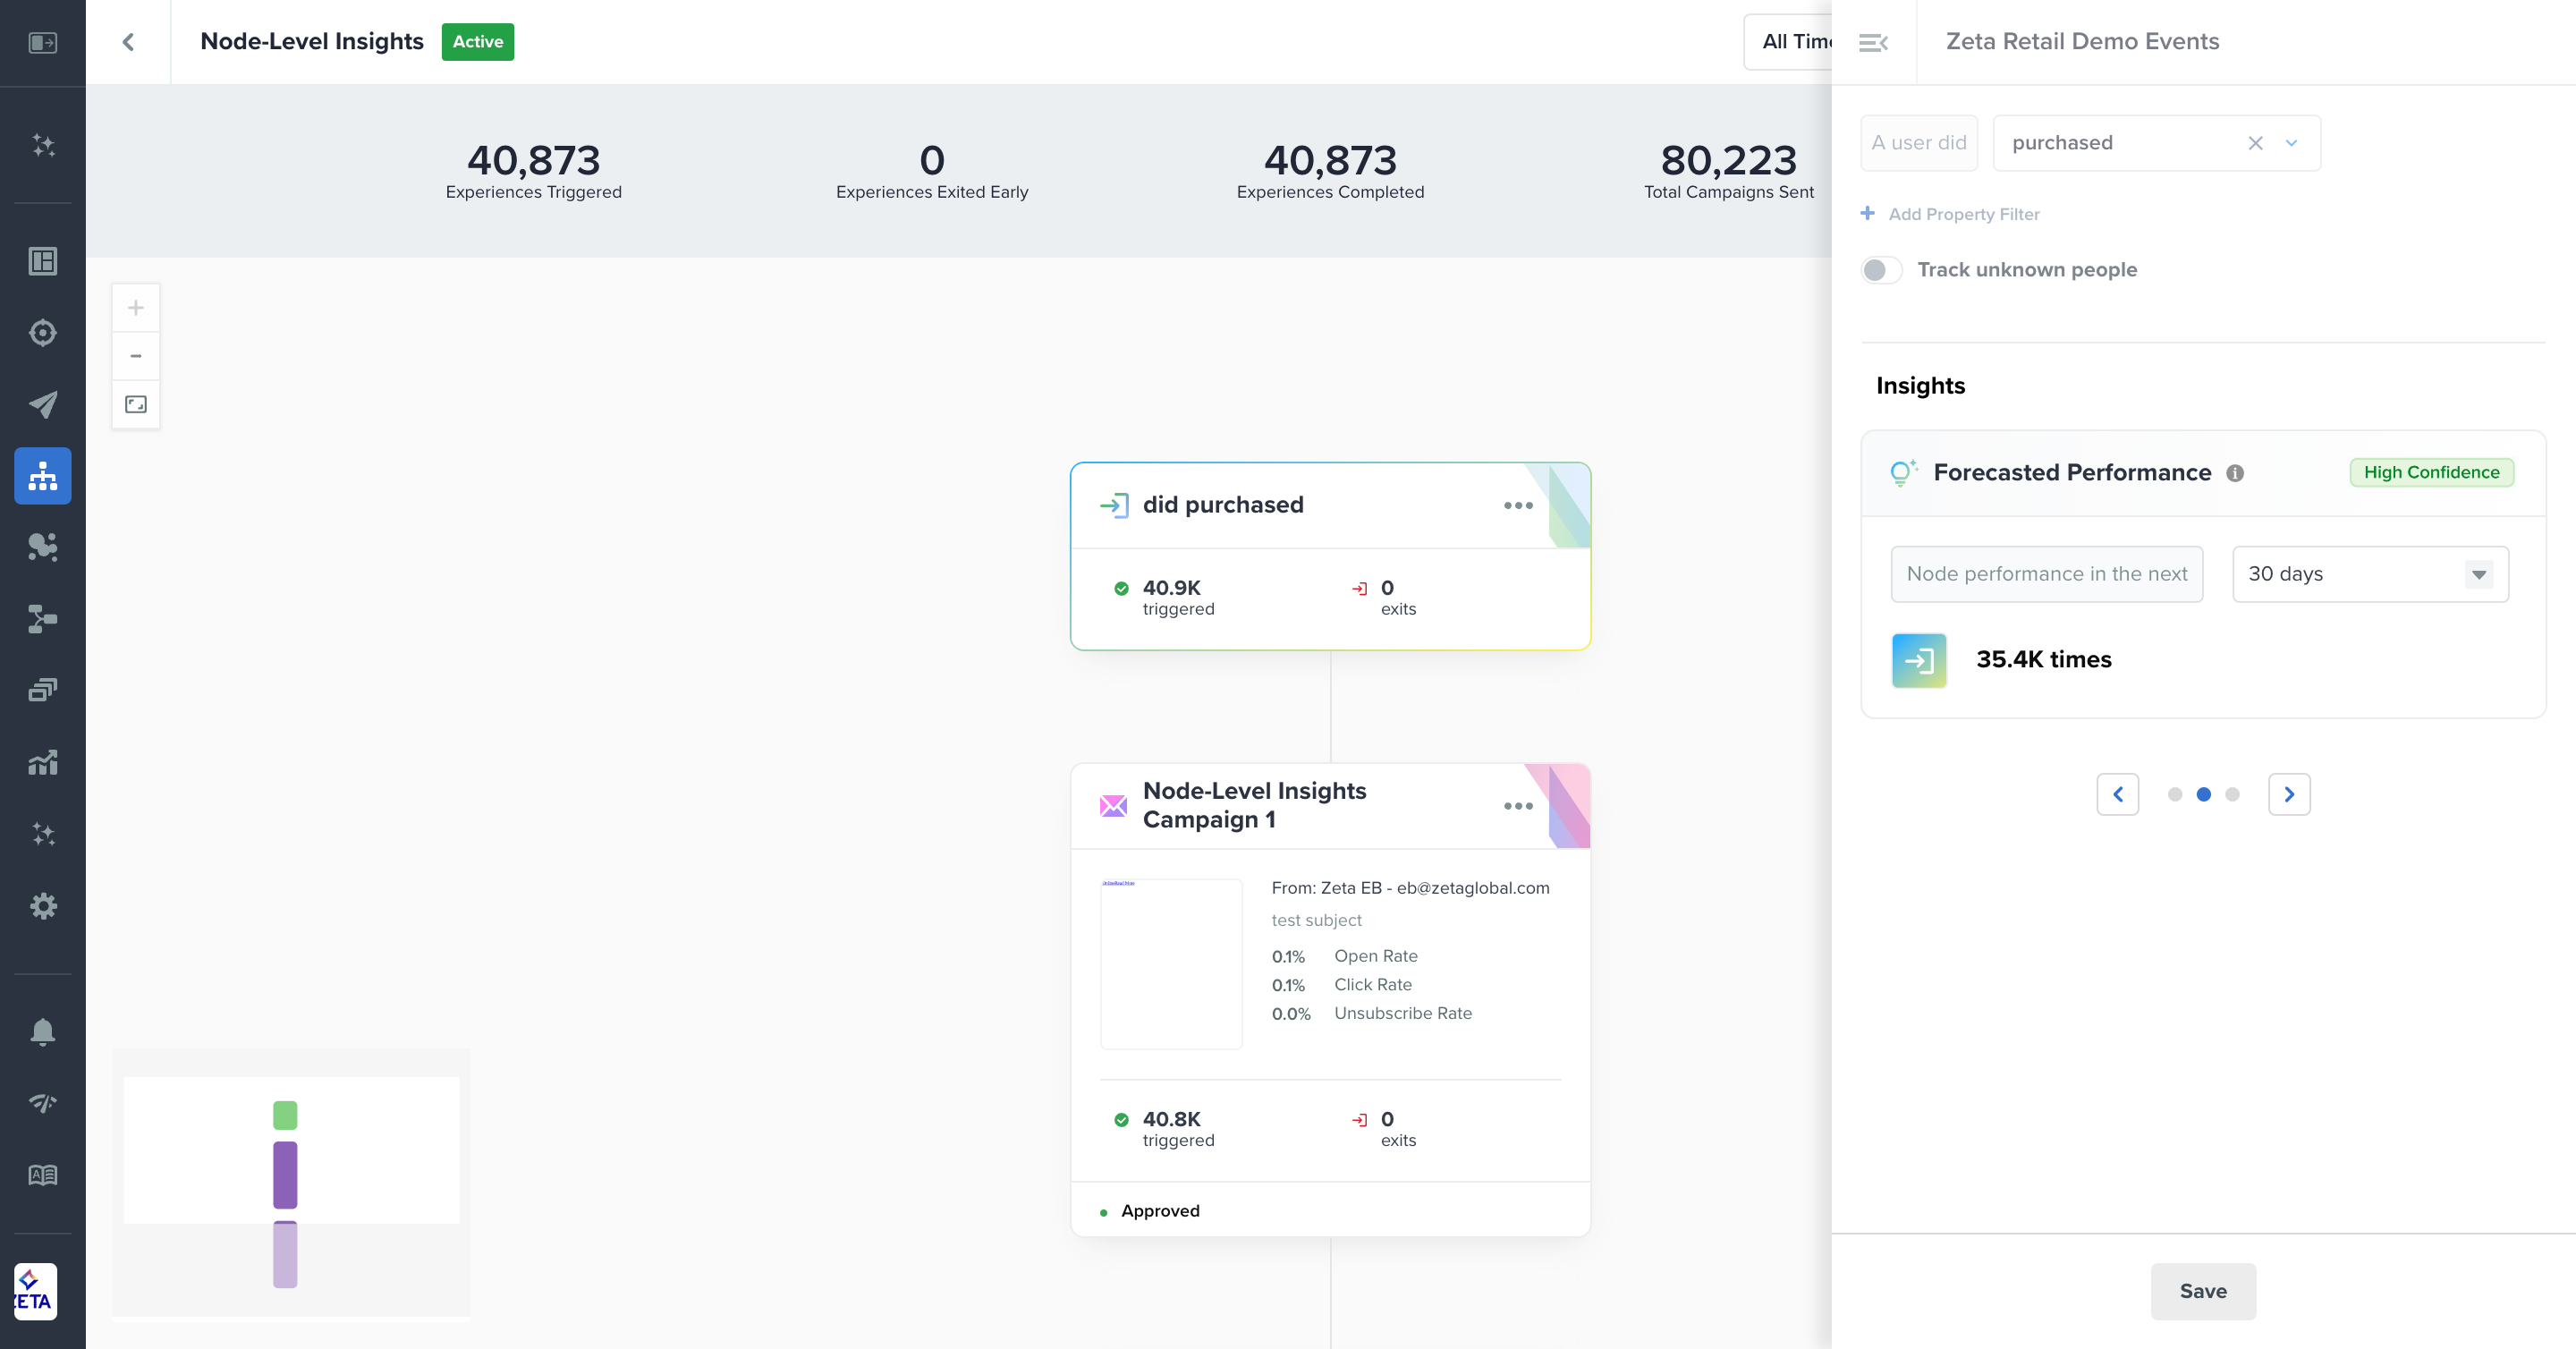
Forecasted Performance
For trigger, event, action, and non-audience split nodes in experiences activated for at least 5 days, you will see counts to tell you how the node is expected to perform in the next 1, 7, 30, or 60 days. Two key differences from the draft state are:
-
In the active state, the forecast is looking back at historical data for this node specifically and will continue to learn while the experience is active and adjust based on actual performance
-
The forecasted counts in the active state are for the total times that node is triggered, not unique people
Because some nodes won’t be fired within the first 5 days of an experience being activated, such as a node after a 7-day delay, or aren’t fired enough, there will be a label of There is not enough data. This will switch to a count as soon as it has enough data to provide a meaningful forecast.
For more info on Confidence Scores, visit Zeta Forecasting.
Performance vs Forecast
For nodes with forecasting in experiences activated for at least 5 days, you will also see a percentage to compare the forecast to the actual performance of the node. Like forecasting, you may see some nodes with the label There is not enough data; this will update as soon as the forecasted performance is provided.
The chart below lists what to expect by node type and exceptions for comparative and forecasted performance in the active state.
|
Node Type |
Sample Nodes |
Data in Active State |
Definition |
|---|---|---|---|
|
Trigger Node |
|
|
|
|
Event Node |
|
|
|
|
Action Node (Campaigns) |
|
|
Channel-specific metrics do not apply to push, webhook, and third-party channel campaigns |
|
Action Node (Non-Campaigns) |
|
|
|
|
Split Node |
|
|
Forecasting does not apply to non-audience splits |
|
Delay Node |
|
|
|