

Demographic Intelligence is a tool that allows users to explore and compare demographic segments across various attributes such as age, generation, income, ethnicity, heritage, and location over time. Evolving from the former “Multicultural Data Explorer,” it supports research and analysis by providing insights into how different audience groups behave, covering aspects like media consumption, store visits, purchasing behavior, and household or financial characteristics.
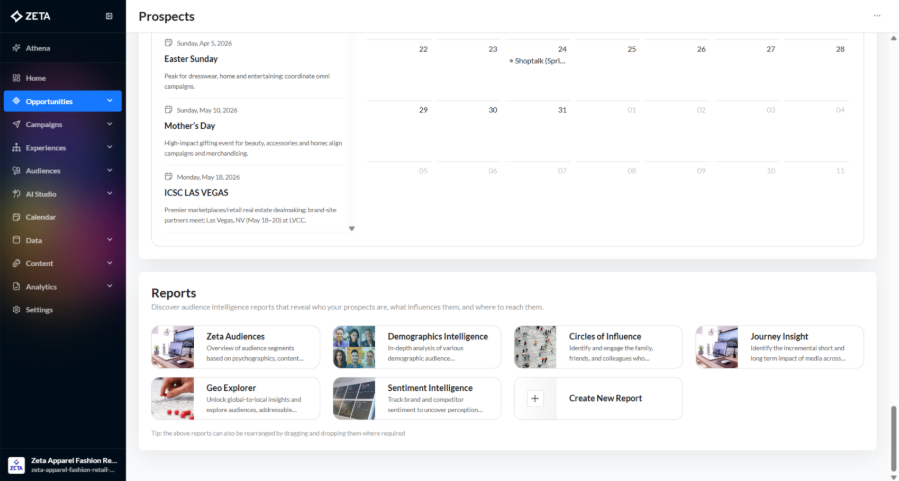
From the Opportunities menu, navigate to the Prospects page, then scroll down to the reports section.
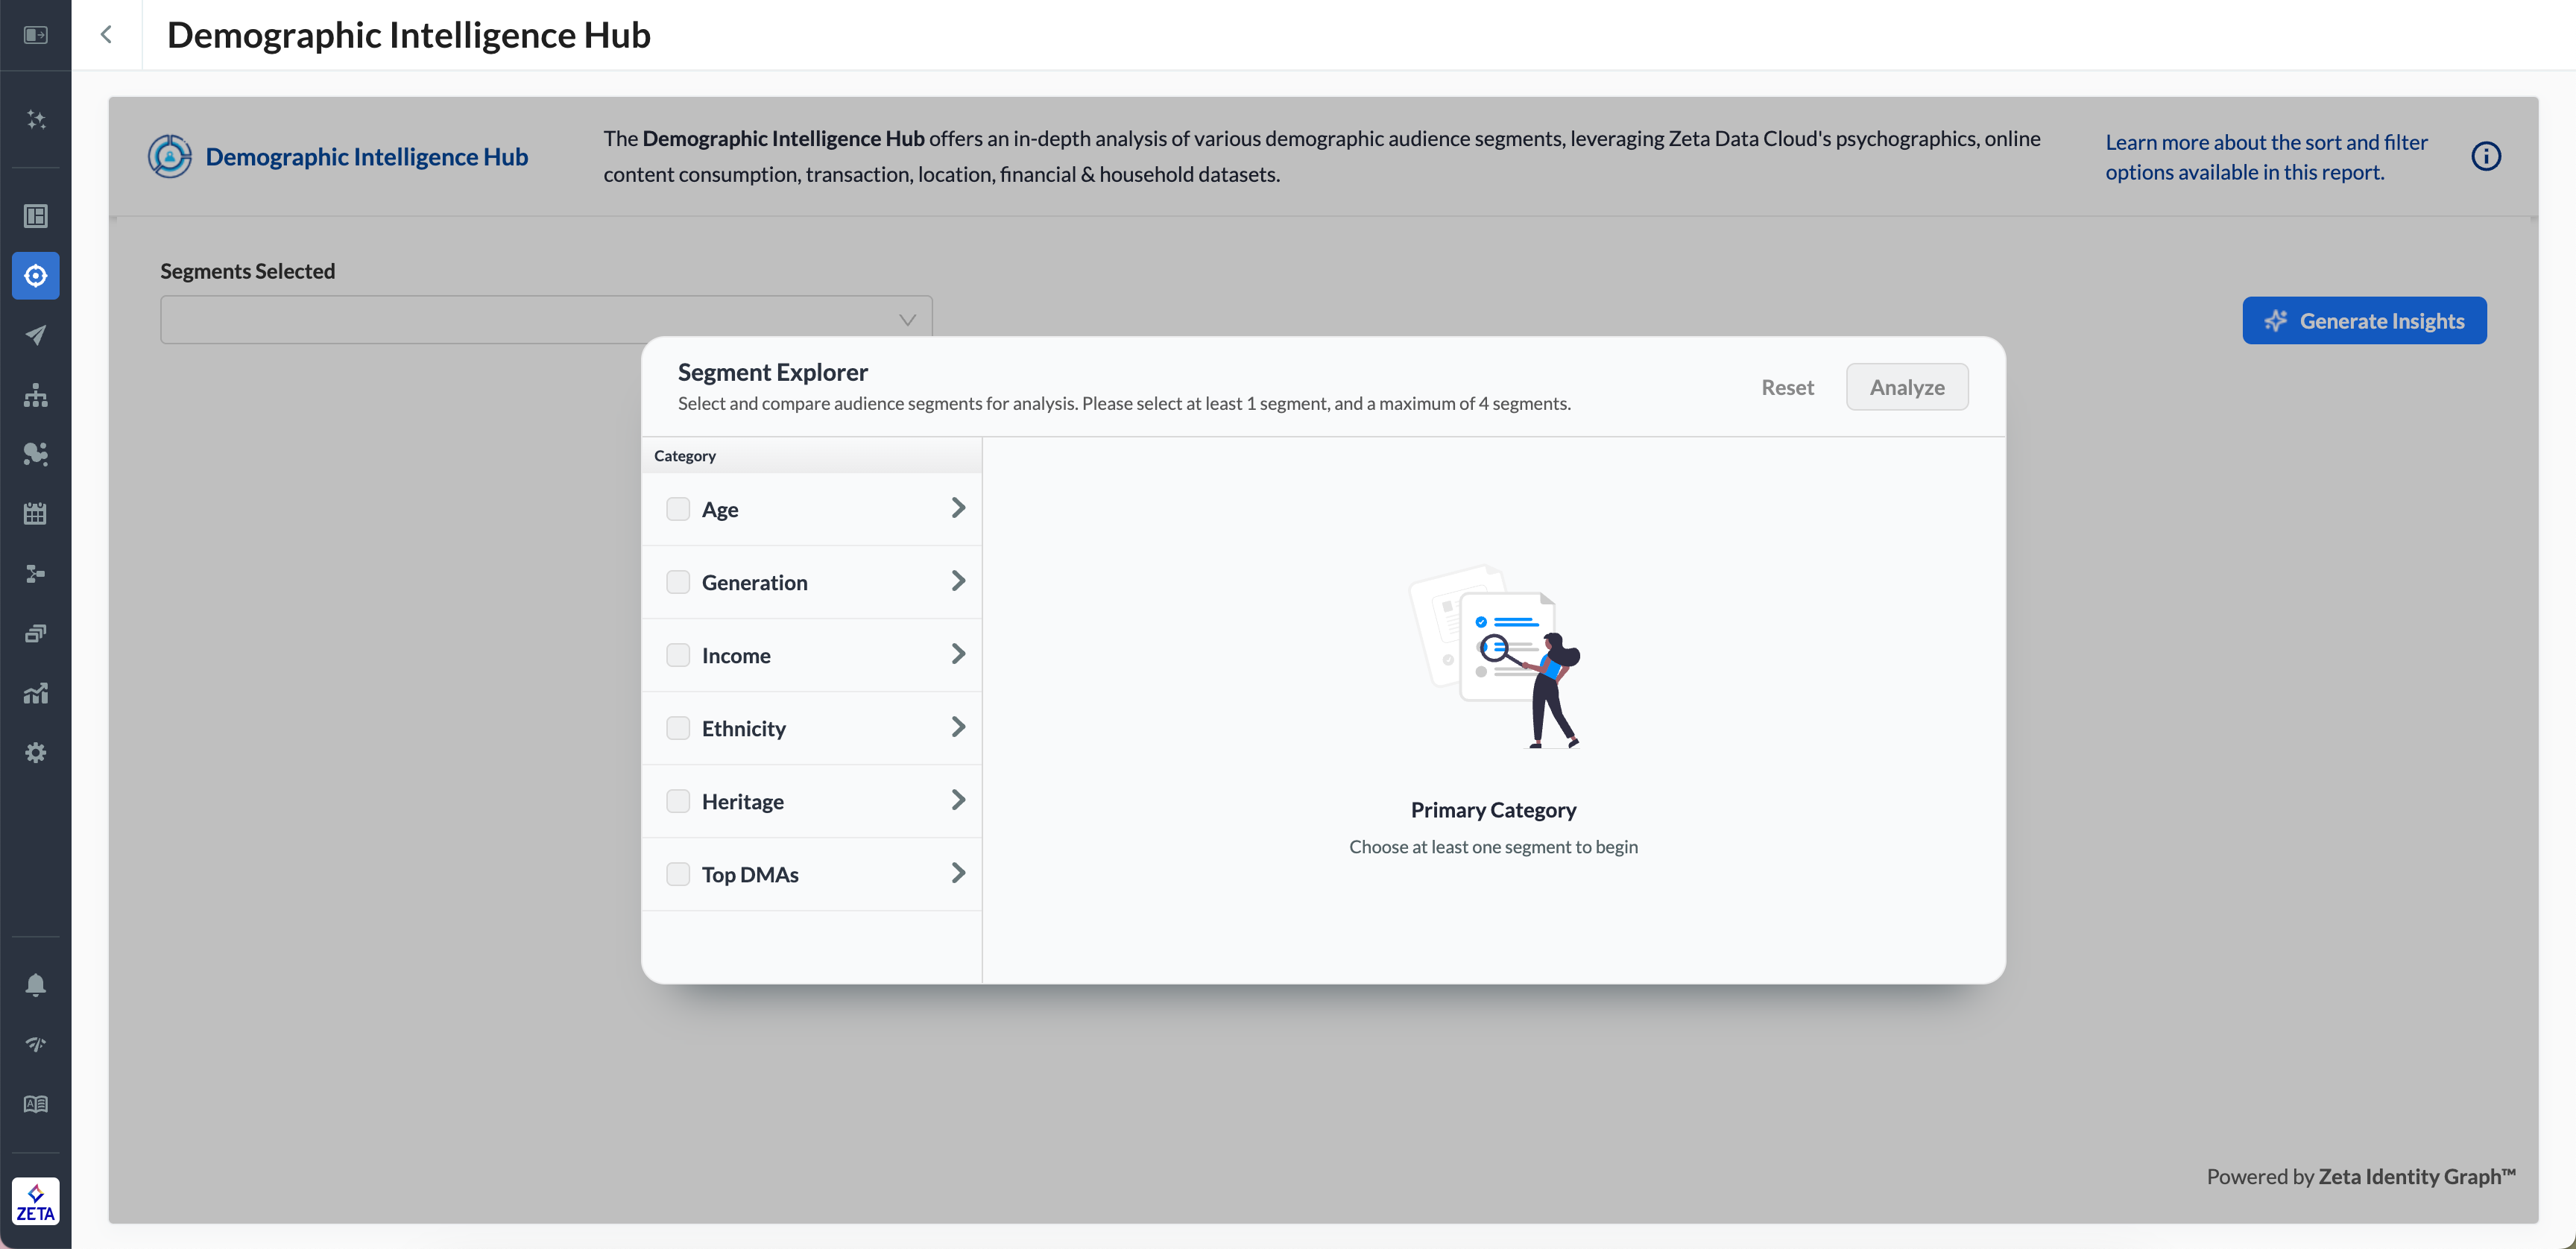
To begin your analysis, use the Segment Explorer to select up to four demographic dimensions. The available categories include:
-
Age Group – Compare behavioral and attitudinal data by age brackets.
-
Generation – Segment by generational groups such as Gen Z, Millennials, Gen X, etc.
-
Income Group – Understand variations across different household income levels.
-
Heritage – Explore cultural heritage-based segments for deeper audience understanding.
-
Geography (Top DMAs) – Filter by major U.S. Designated Market Areas (DMAs) for regional analysis.
-
Ethnicity – Identify trends and behaviors within key ethnic audience groups.
Simply check one or more boxes to select your desired segment(s), then click on Analyze to proceed. You must select at least one segment to continue.
-20250616-092346.gif?cb=a19bdd31791fa3765dc96cb5536d2e01)
Coverage
The Coverage tab shows the extent to which data can be enriched using Zeta’s Data Cloud. It visualizes reachability and channel-wise activity across the selected segments, essentially highlighting how much of each segment Zeta can identify and match data for.
-20250616-092645.gif?cb=147720244268d078c54fcfc258805d51)
-
The Reachability bar graph displays the portion of data that Zeta’s Data Cloud can enrich across your selected demographic segments. This is represented as a percentage bar chart, helping you evaluate the scale and completeness of data coverage for each group.
-
The Activity by Channel bar graph visualizes each segment’s communication activity across different channels over the last 90 days. This includes platforms such as email, mobile, CTV, and others, highlighting preferred modes of engagement.
Demographics
The Demographics section allows you to explore basic population attributes, such as age, gender, income, and location, for your selected audience segments. For each attribute, you can toggle between Index and Percentage views.
Each demographic attribute is benchmarked against Zeta’s network baseline, providing context on how each audience segment compares to the broader population.
-20250616-093852.gif?cb=6738d2ce7be01dc4d297f4529b785331)
-
Age displays the age group distribution of your selected segment(s), with options to view as a percentage or indexed against the Zeta network. The percentage view shows the actual share of individuals within each age bracket, while the index view indicates how much more or less likely a segment is to fall into a specific age group compared to the network baseline.
-
Gender illustrates the gender distribution, typically male vs. female, across selected audience segments. Index view shows a higher or lower likelihood of being a specific gender compared to the network, while the percentage shows the direct share of each gender in the segment.
-
Income breaks down income levels by household income brackets (e.g., <$50K, $50K–$100K, $100K+), showing how each selected segment compares to the Zeta baseline. Index values show above or below the baseline.
-
Geographic / ZIP Distribution displays the geographic concentration of a segment, either at a DMA (Designated Market Area) level or by ZIP codes, and how it compares to the baseline. A high index means they're more likely to exhibit that trait, while a low index means they’re less likely.
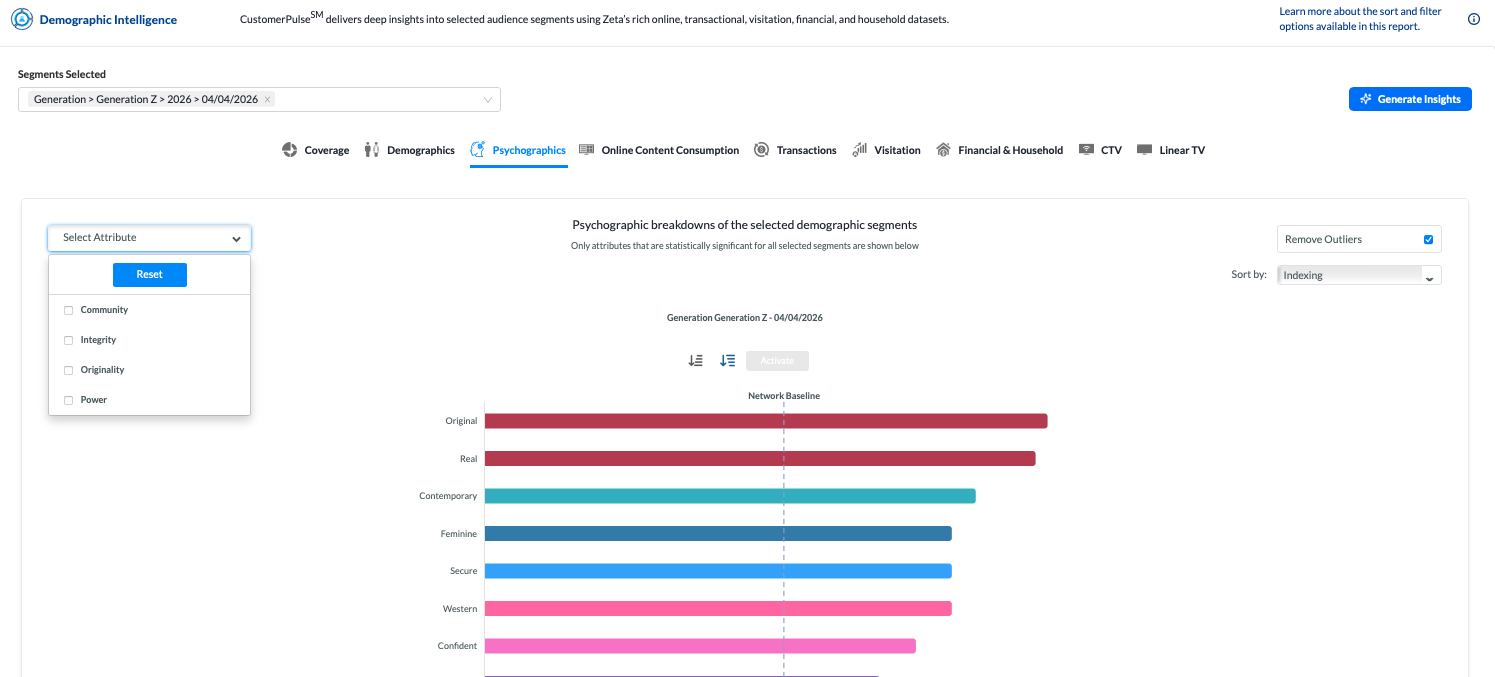
Psychographics
The Psychographics section uncovers deeper behavioral and attitudinal traits of selected audience segments. It presents statistically significant characteristics such as personality descriptors, lifestyle labels, and values that are more or less likely within each group compared to Zeta’s network baseline.
These insights help marketers understand not just who their audience is, but how they think, enabling more resonant messaging and brand alignment.
-
Choose specific psychographic dimensions to view from the Attribution dropdown, for example, traits tied to consumer confidence, lifestyle perception, or aspirational identity.
-
The Remove Outliers Checkbox is enabled by default and helps filter out anomalies, ensuring the displayed data reflects meaningful patterns across segments.
When unchecked, the system introduces a Customer Overlap Percentile control, allowing you to set a threshold (e.g., top 10%, 25%) to display venues based on their popularity within the segment.
-
You can sort attributes in one of two ways:
-
Indexing – Sorts traits by the degree to which they deviate from the network baseline.
-
Customer Overlap – Sorts traits by the volume of customers within a segment that exhibit the selected trait.
-
Online Content Consumption
The Online Content Consumption section highlights the digital behaviors and brand interactions of your selected demographic segments. It reveals what types of content, websites, and brand domains are most engaging for different audiences, providing critical insights for content planning and digital targeting.
This section compares segment-specific consumption patterns to Zeta’s network baseline, spotlighting categories where your audience significantly over- or under-indexes.
-20250617-074829.gif?cb=44216055a92ca2cd7e54b6cbcdf7150d)
-
Select the Category / Sub-Category Dropdowns to narrow down the data to a specific content domain (e.g., Healthcare, Retail, Tech) and its corresponding sub-verticals. This allows for more focused insights into user interest areas.
-
When the Remove Outliers option is enabled (default setting), this removes atypical data points that could skew interpretation, useful for surfacing more stable patterns of interest.
When unchecked, the system introduces a Customer Overlap Percentile control, allowing you to set a threshold (e.g., top 10%, 25%) to display venues based on their popularity within the segment.
-
Sort By Menu:
-
Indexing – Sorts based on deviation from the baseline, spotlighting the most unique or over-indexed content engagements.
-
Customer Overlap – Sorts based on how many customers within each segment engage with the selected content/brand.
-
Transactions
The Transactions section provides visibility into the purchase behavior and brand interactions of different demographic segments. This view captures which brands, categories, or services are most frequently transacted with and how that compares to Zeta’s overall baseline.
It’s a powerful tool for identifying shopping preferences, luxury or travel inclinations, and transactional loyalty among target audiences.
-20250617-075140.gif?cb=46187bf6a44a52de047da4753e7bff3f)
-
Select the Category / Sub-Category Dropdowns to drill down into specific transaction categories such as luxury goods, airlines, tech products, etc., to focus your view.
-
When the Remove Outliers option is enabled (default setting), this filters out extreme or low-confidence values to refine the accuracy of insights (checked by default).
-
Choose how to organize the results:
-
Indexing – Highlights brands where the segment significantly over- or under-indexes.
-
Customer Overlap – Prioritizes brands with the highest raw volume of purchases within the segment.
-
Visitation
The Visitation section provides insight into the physical location behavior of selected demographic segments. It shows where consumers are most likely to visit, across cities, retail chains, quick-serve restaurants, or regional points of interest, based on observed foot traffic patterns.
This data is key for understanding geographic mobility, retail exposure, and offline engagement tendencies of multicultural audiences.
-20250617-075428.gif?cb=2ea3399b49f92d27701921e7a98c9eb4)
-
Select the Category / Sub-Category Dropdowns to refine the view by type of location (e.g., Grocery, Restaurants, Cities).
-
The Remove Outliers Checkbox is enabled by default to clean the view by excluding extreme or low-confidence data.
When unchecked, the system introduces a Customer Overlap Percentile control, allowing you to set a threshold (e.g., top 10%, 25%) to display venues based on their popularity within the segment.
-
Sort By Menu
-
Indexing: Prioritizes locations with the greatest deviation from the baseline.
-
Customer Overlap: Highlights venues with the most raw foot traffic among your selected group.
-
Financial & Household
The Financial & Household section provides a window into the economic capacity and living conditions of your selected audience segments. It captures household-level financial traits, like wealth rating, discretionary spend, mortgage status, and home size, and how these attributes compare to Zeta’s network baseline.
This section helps uncover audience affluence, lifestyle expectations, and purchase capacity, key to strategic targeting, premium positioning, and personalization.
-20250617-075900.gif)
-
Select the Category / Sub-Category Dropdowns to narrow your focus to specific financial dimensions or household composition types.
-
The Remove Outliers Checkbox is enabled by default to filter out extreme values for a cleaner, more representative view.
Disabling this option unlocks the Customer Overlap Percentile slider, allowing you to control the minimum threshold of household prevalence within your segment (e.g., top 10%, top 25%).
-
Sort By Menu
-
Indexing: Sorts attributes by the extent to which they deviate from Zeta’s norm.
-
Customer Overlap: Ranks attributes by actual share of households in the segment meeting that condition.
-
CTV
The CTV section provides insights into how different audience segments consume streaming television content through internet-connected devices. It categorizes users based on their CTV usage intensity, helping marketers understand which groups are most engaged with streaming media.
This view is especially helpful for planning CTV advertising campaigns, segment-specific media buys, and evaluating reach potential across audience types.
-20250617-080252.gif?cb=35035767cd03e58de8d6501d84acfbb6)
Linear TV
The Linear TV section provides a dual-layer view of how selected segments consume traditional, scheduled broadcast television. It combines usage intensity with channel preference analysis, making it a powerful tool for planning campaigns across linear media environments.
This section helps you understand whether your audiences are light or heavy viewers of linear TV and which channels they prefer, supporting smarter TV buys, media planning, and cross-channel strategy.
-20250617-081038.gif?cb=cf7c00392e0bc6a2b01cbf573b0e2471)