

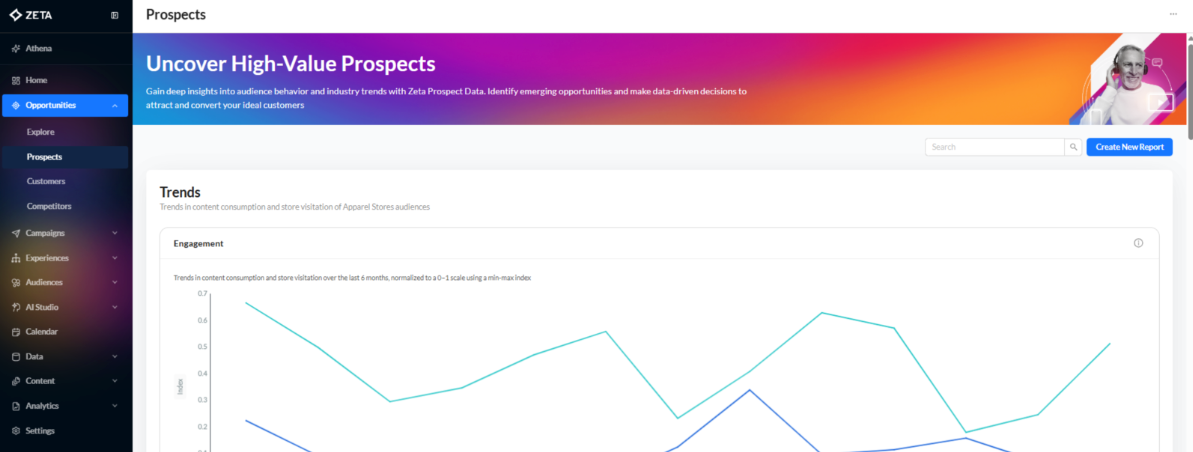
Prospect Trends provides high-level insights that can help identify the best time to engage with consumers. All insights from the Prospect Trends section are derived from Zeta data.
From the Opportunities menu, navigate to the Prospects page.
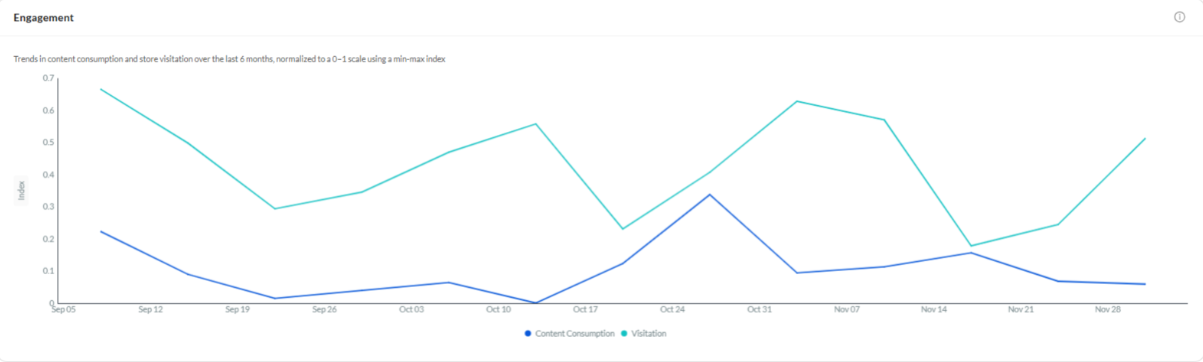
Engagement Trends
Engagement Trends shows content consumption and store visitation over the last 6 months, normalized to a 0–1 scale using a min-max index.
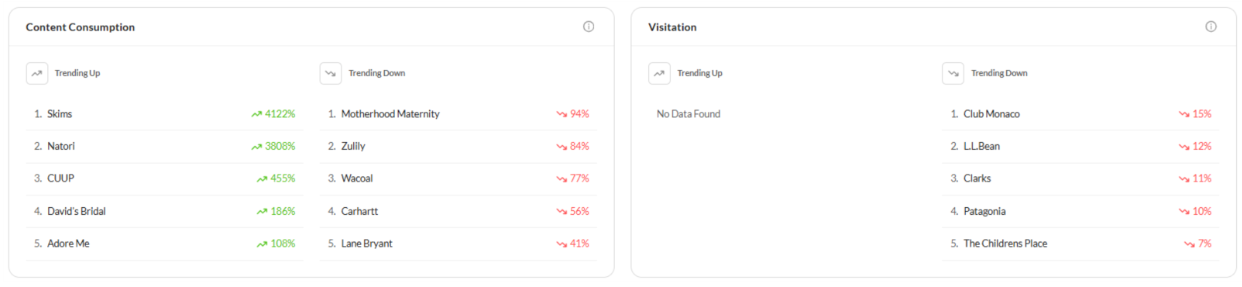
Content Consumption & Visitation Trends
These trends highlight online content consumption and visitation audiences with the largest change week-over-week.
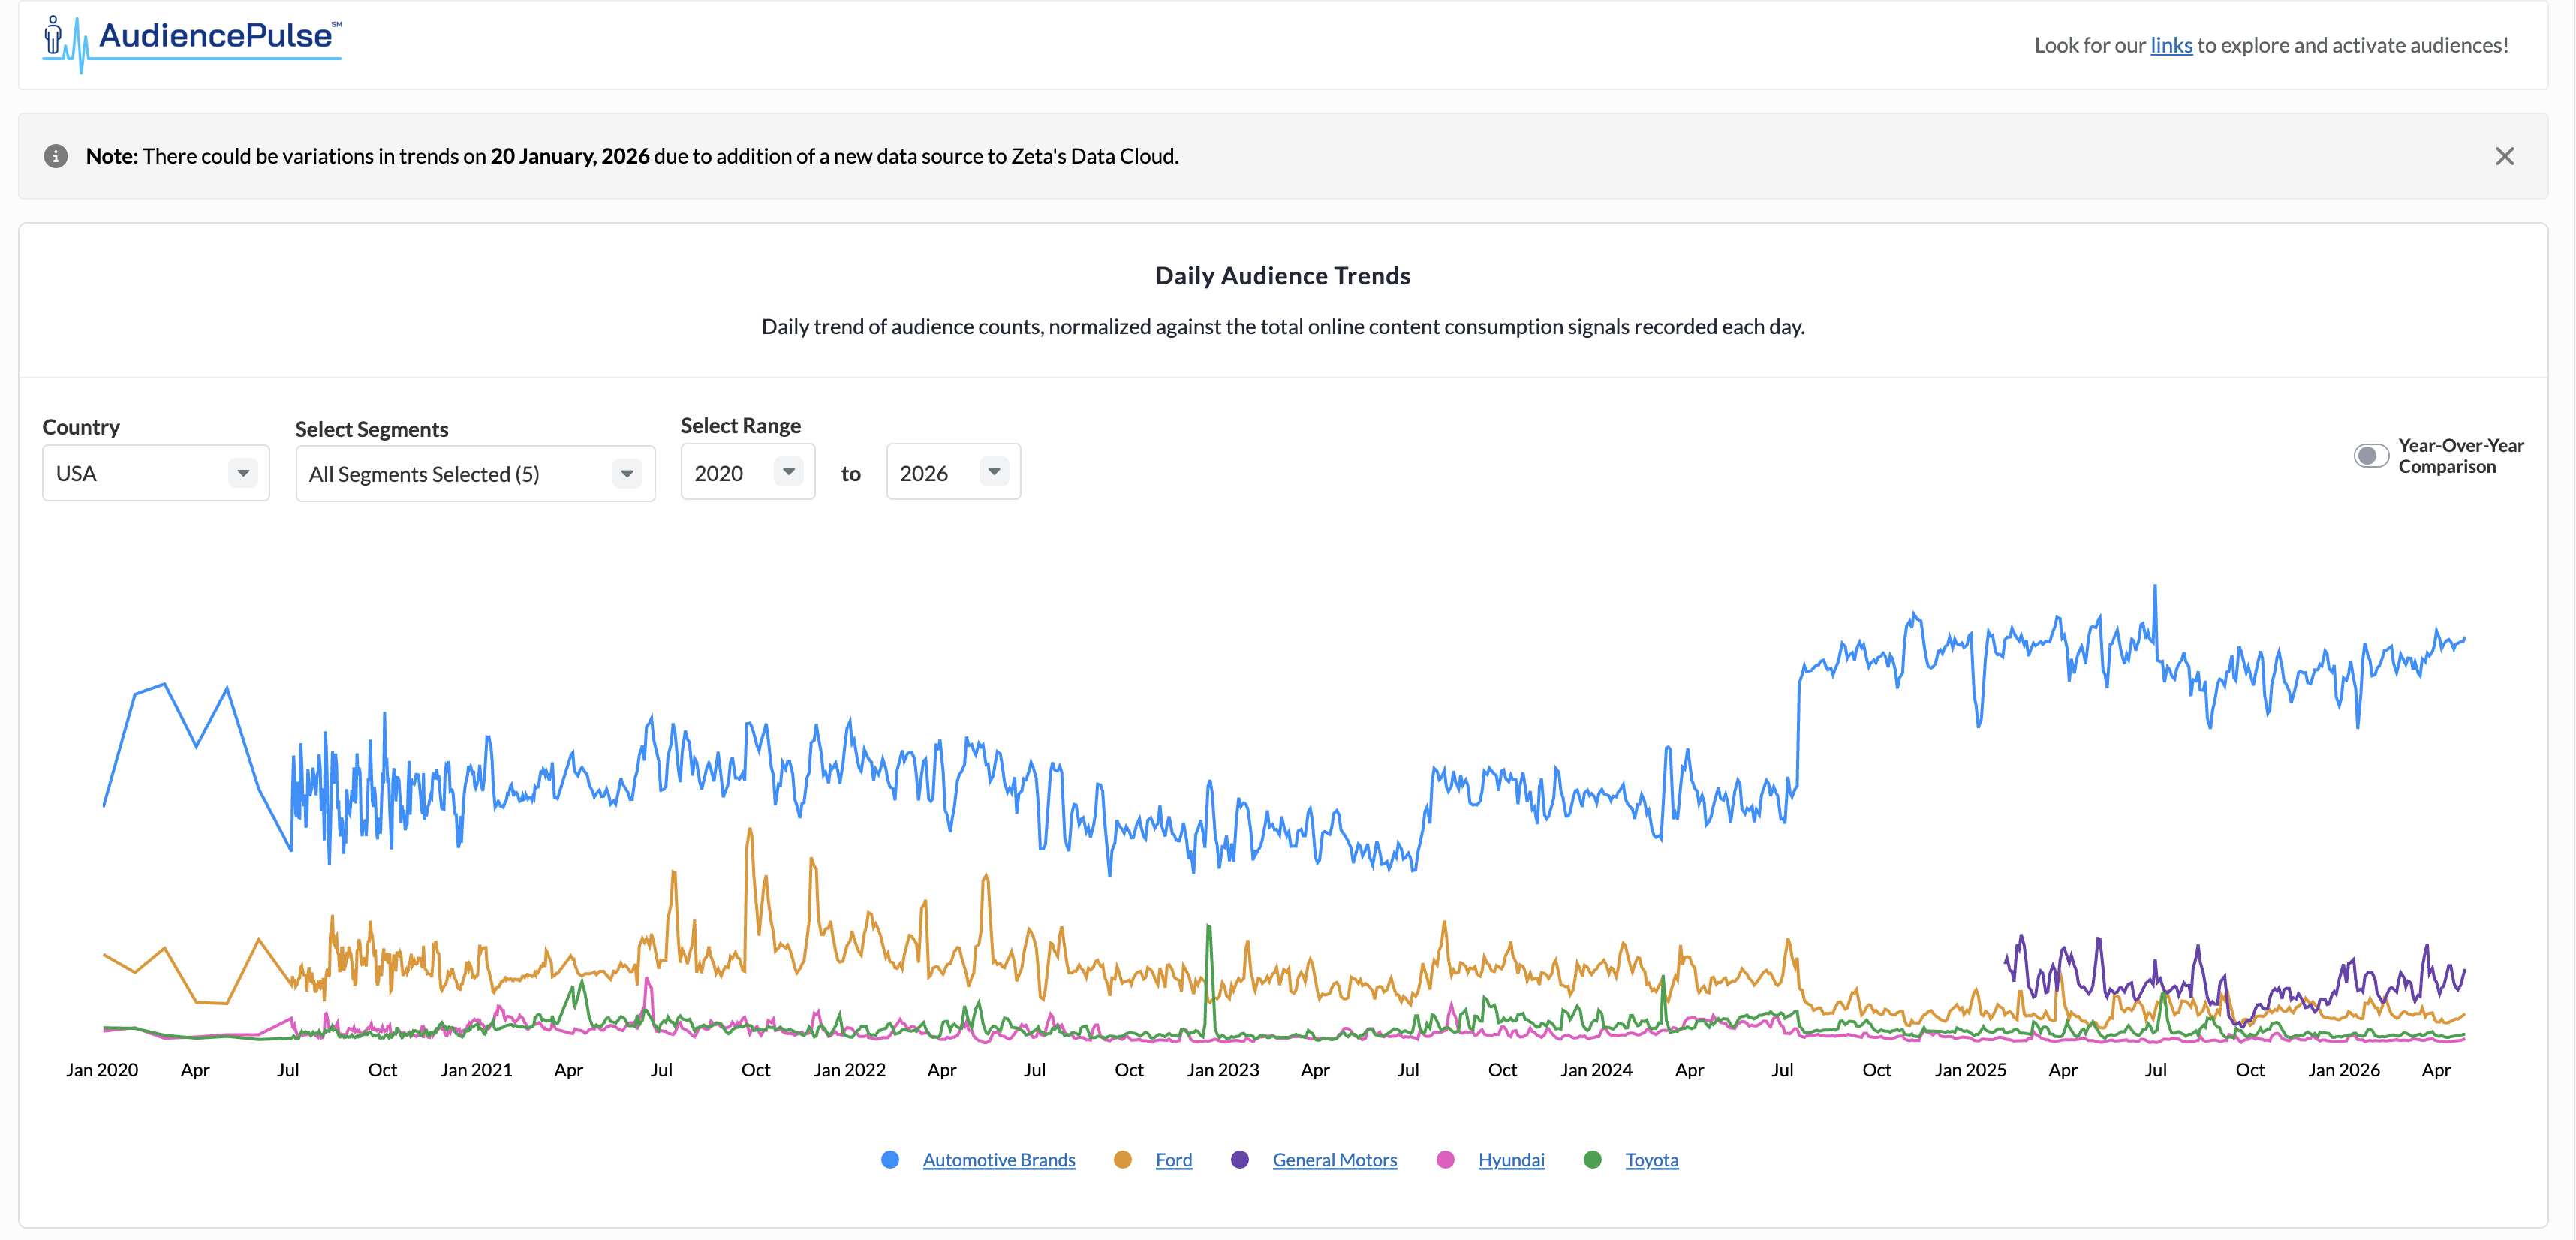
AudiencePulse℠
View daily trends in both Online Content Consumption and Visitation audiences over time. Click Explore Full Report to see week-over-week or month-over-month change.
-
Click Explore Full Report to see additional views.
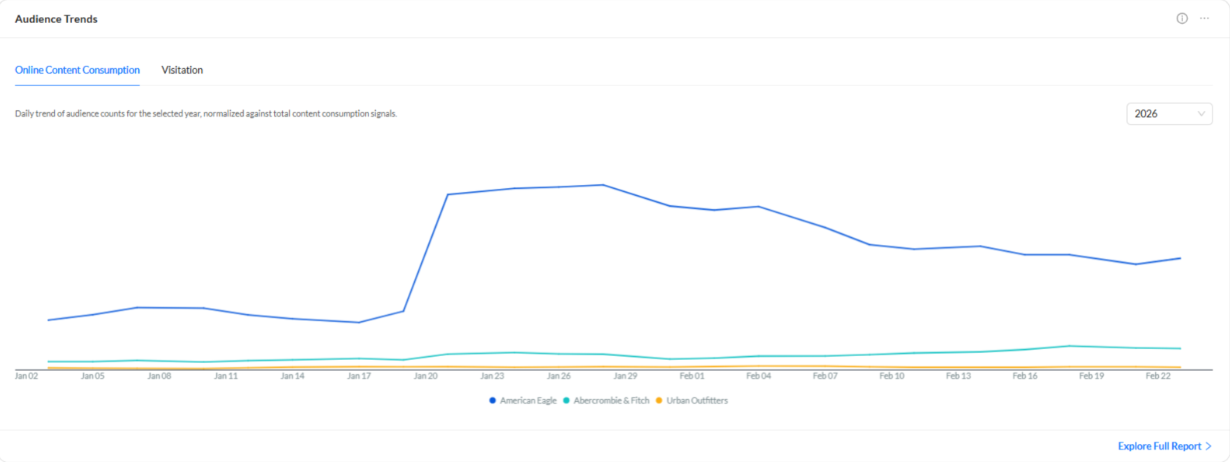
Audience Trends: Online Content Consumption
The following filters are pre-filled from the OE v2 configurations and apply to the entire Audience Trends: Online Content Consumption section:
-
Country: Pre-filled from homepage; can be changed.
-
Topics: Pre-filled from homepage; edit to remove topics.
Daily
The daily audience trends show the daily normalized audience index values.
-
Filters displayed above the chart:
-
Year Range: Defaults to the earliest-to-latest years with data across the selected topics; can be narrowed or extended where data exists.
-
Year-on-Year Toggle: When enabled, it renders a separate graph for each topic showing overlapping lines for different years to compare seasonal or temporal patterns.
-
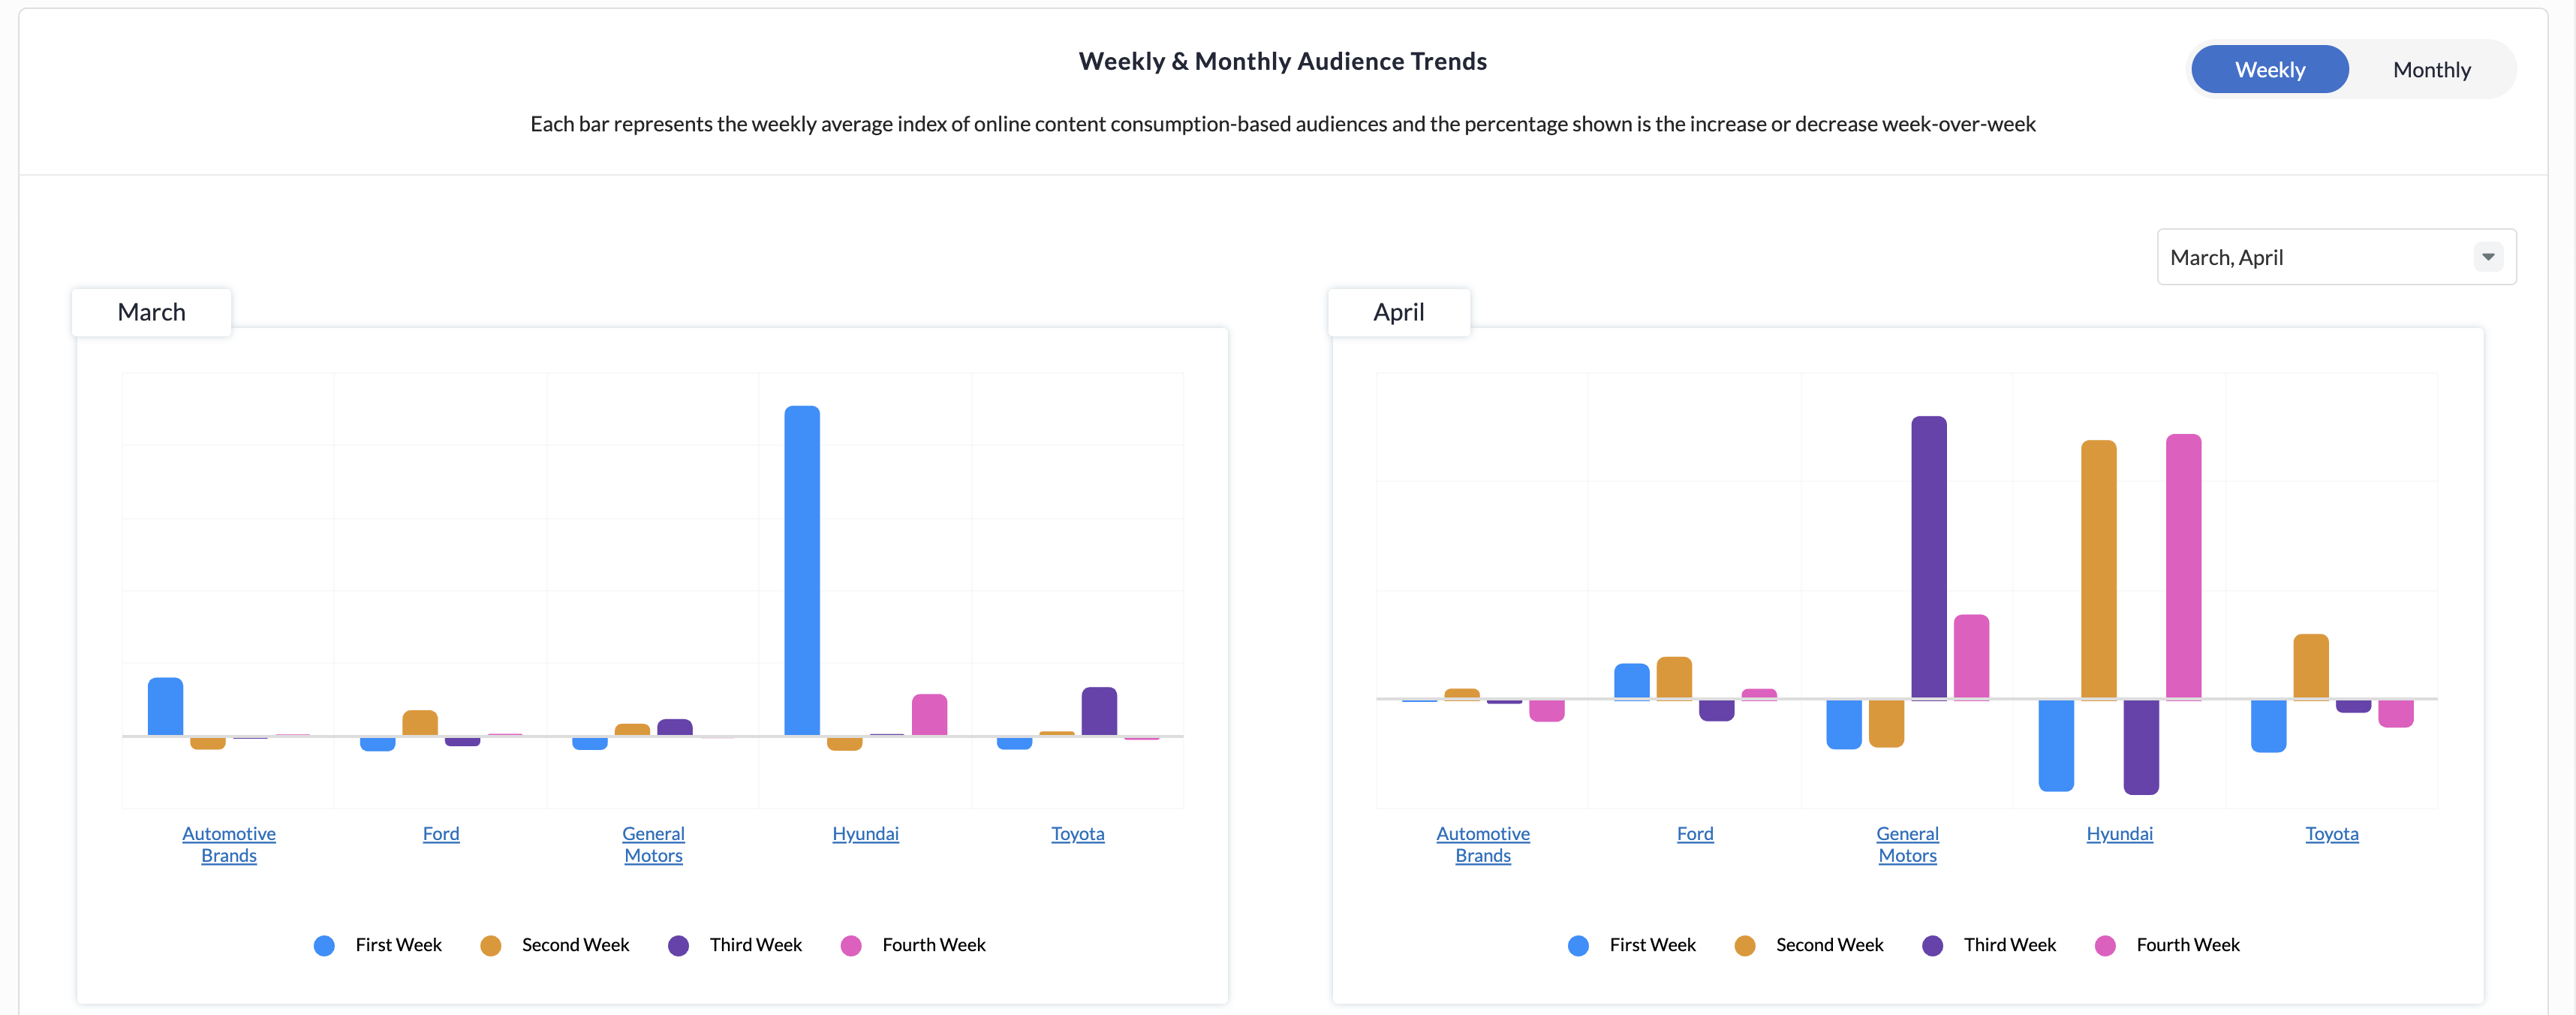
Weekly
Allows you to compare weekly trends across recent months, with hover tooltips showing week-over-week percentage changes. It helps identify campaign lift, intra-month shifts, and weekly cadence patterns.
-
Choose up to two of the latest four months for analysis.
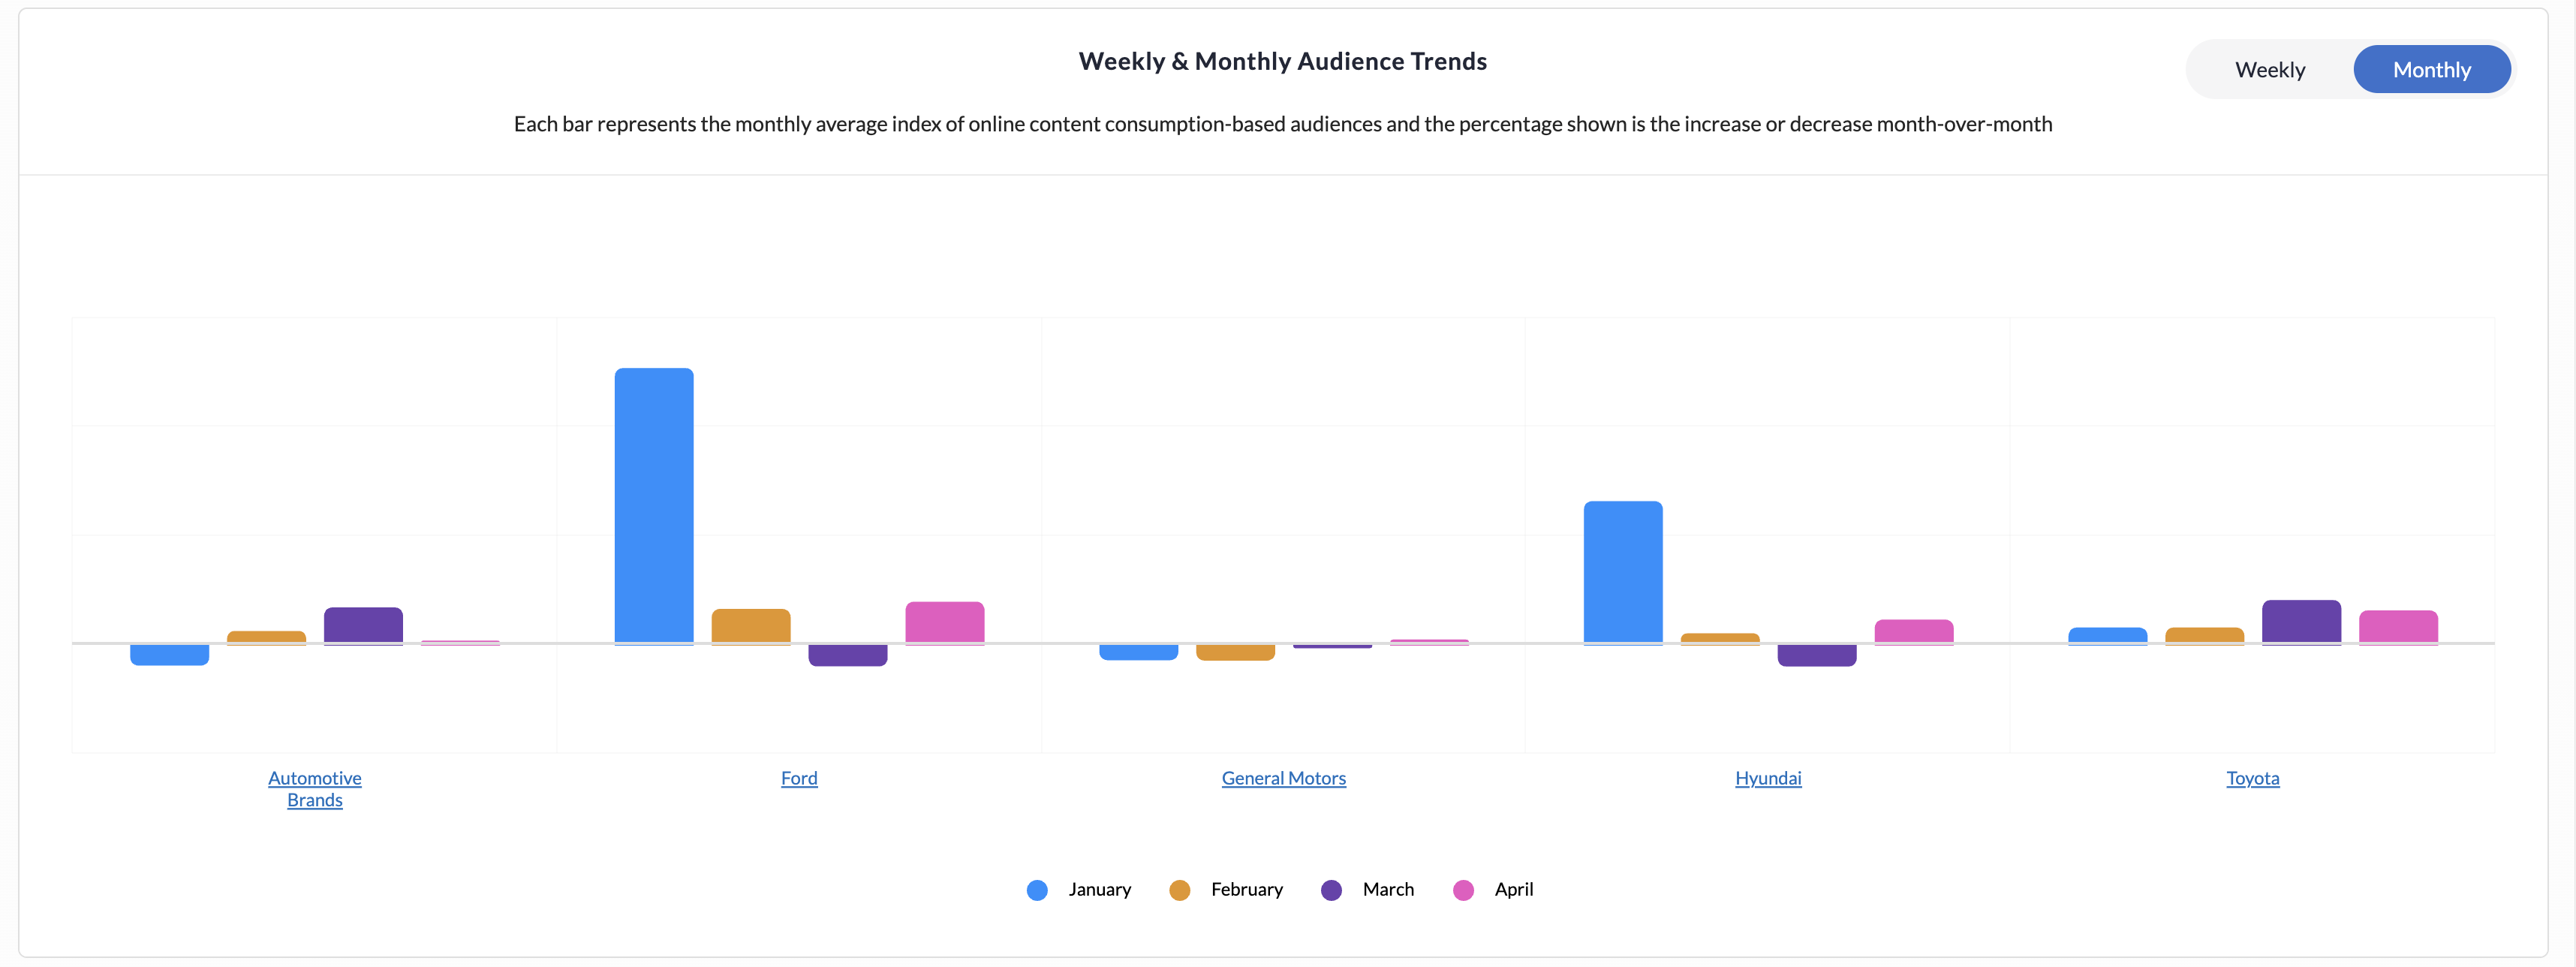
Monthly
Provides a four-month default view with hover tooltips showing month-over-month percentage changes in indices. It helps track long-term trends, identify steady growth or decline, and measure the sustained impact of brand or content strategies.
-
The last four months with available data are selected by default.
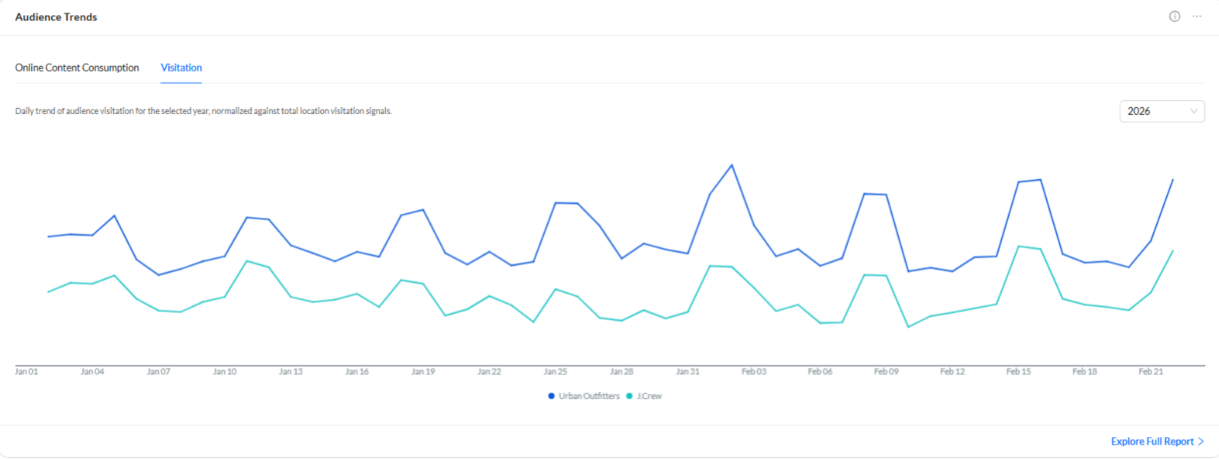
Audience Trends: Visitation
On the homepage, a country dropdown at the top sets the locale for visitation analysis.
-
Once a country is selected, you can explore a hierarchical view of brand visitation audiences organized by category and subcategory.
-
You can select up to 8 nodes from the hierarchy tree, while a summary panel on the right displays all selected brands and allows individual selections to be removed easily.
The following filters are pre-filled from the OE v2 configurations and apply to the entire Audience Trends: Visitation section:
-
Topics: Pre-filled from homepage; edit to remove topics.
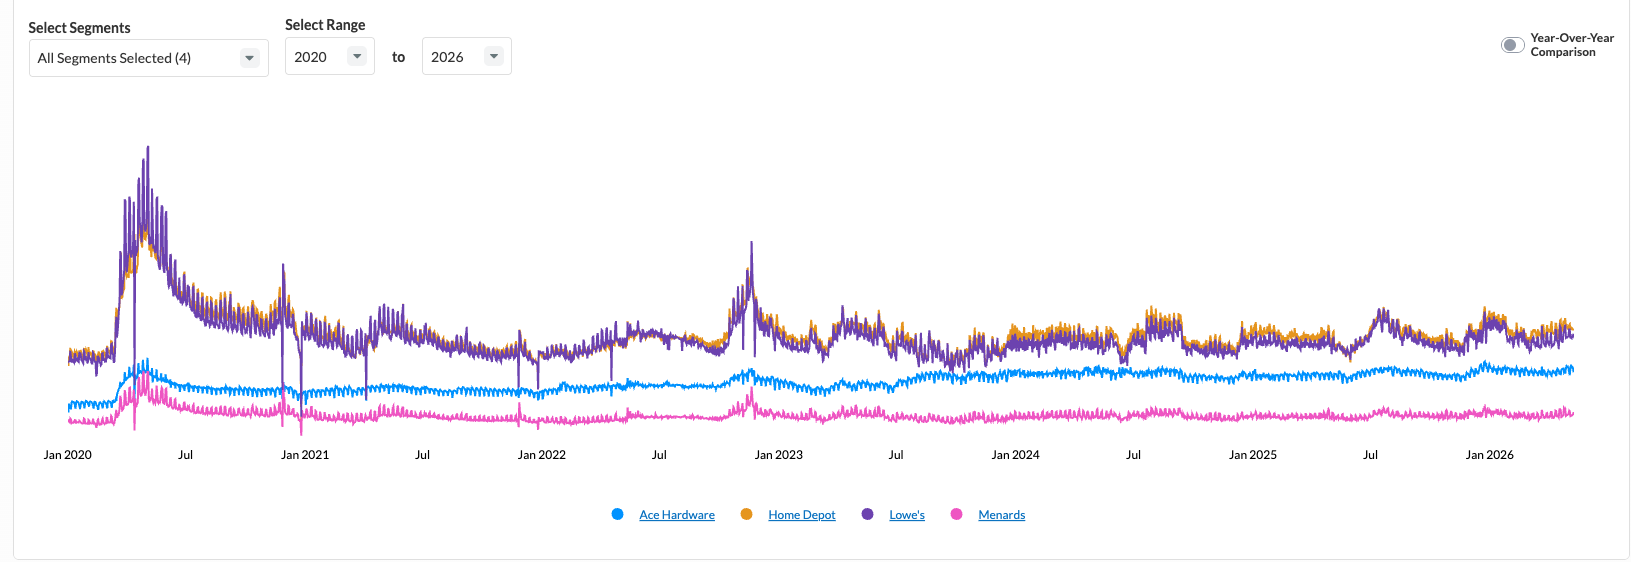
Daily
The daily visitation trend shows high-frequency, normalized daily indices by brand. Optional YoY toggle is present for longitudinal comparison.
-
Filters displayed above the chart:
-
Year Range: Defaults to earliest-to-latest years with data for selected segments; adjustable.
-
Year-on-Year Toggle: Renders a separate graph per segment with overlapping lines for different years.
-
Weekly
Allows you to compare weekly trends across up to two of the latest four months, with separate graphs for each selected month. Weekly segment comparisons and hover tooltips showing week-over-week percentage changes help identify intra-month shifts and analyze cadence patterns across recent months.
.png?cb=a5c978673c668125db00f093f129f350)
-
Choose up to two of the latest four months.
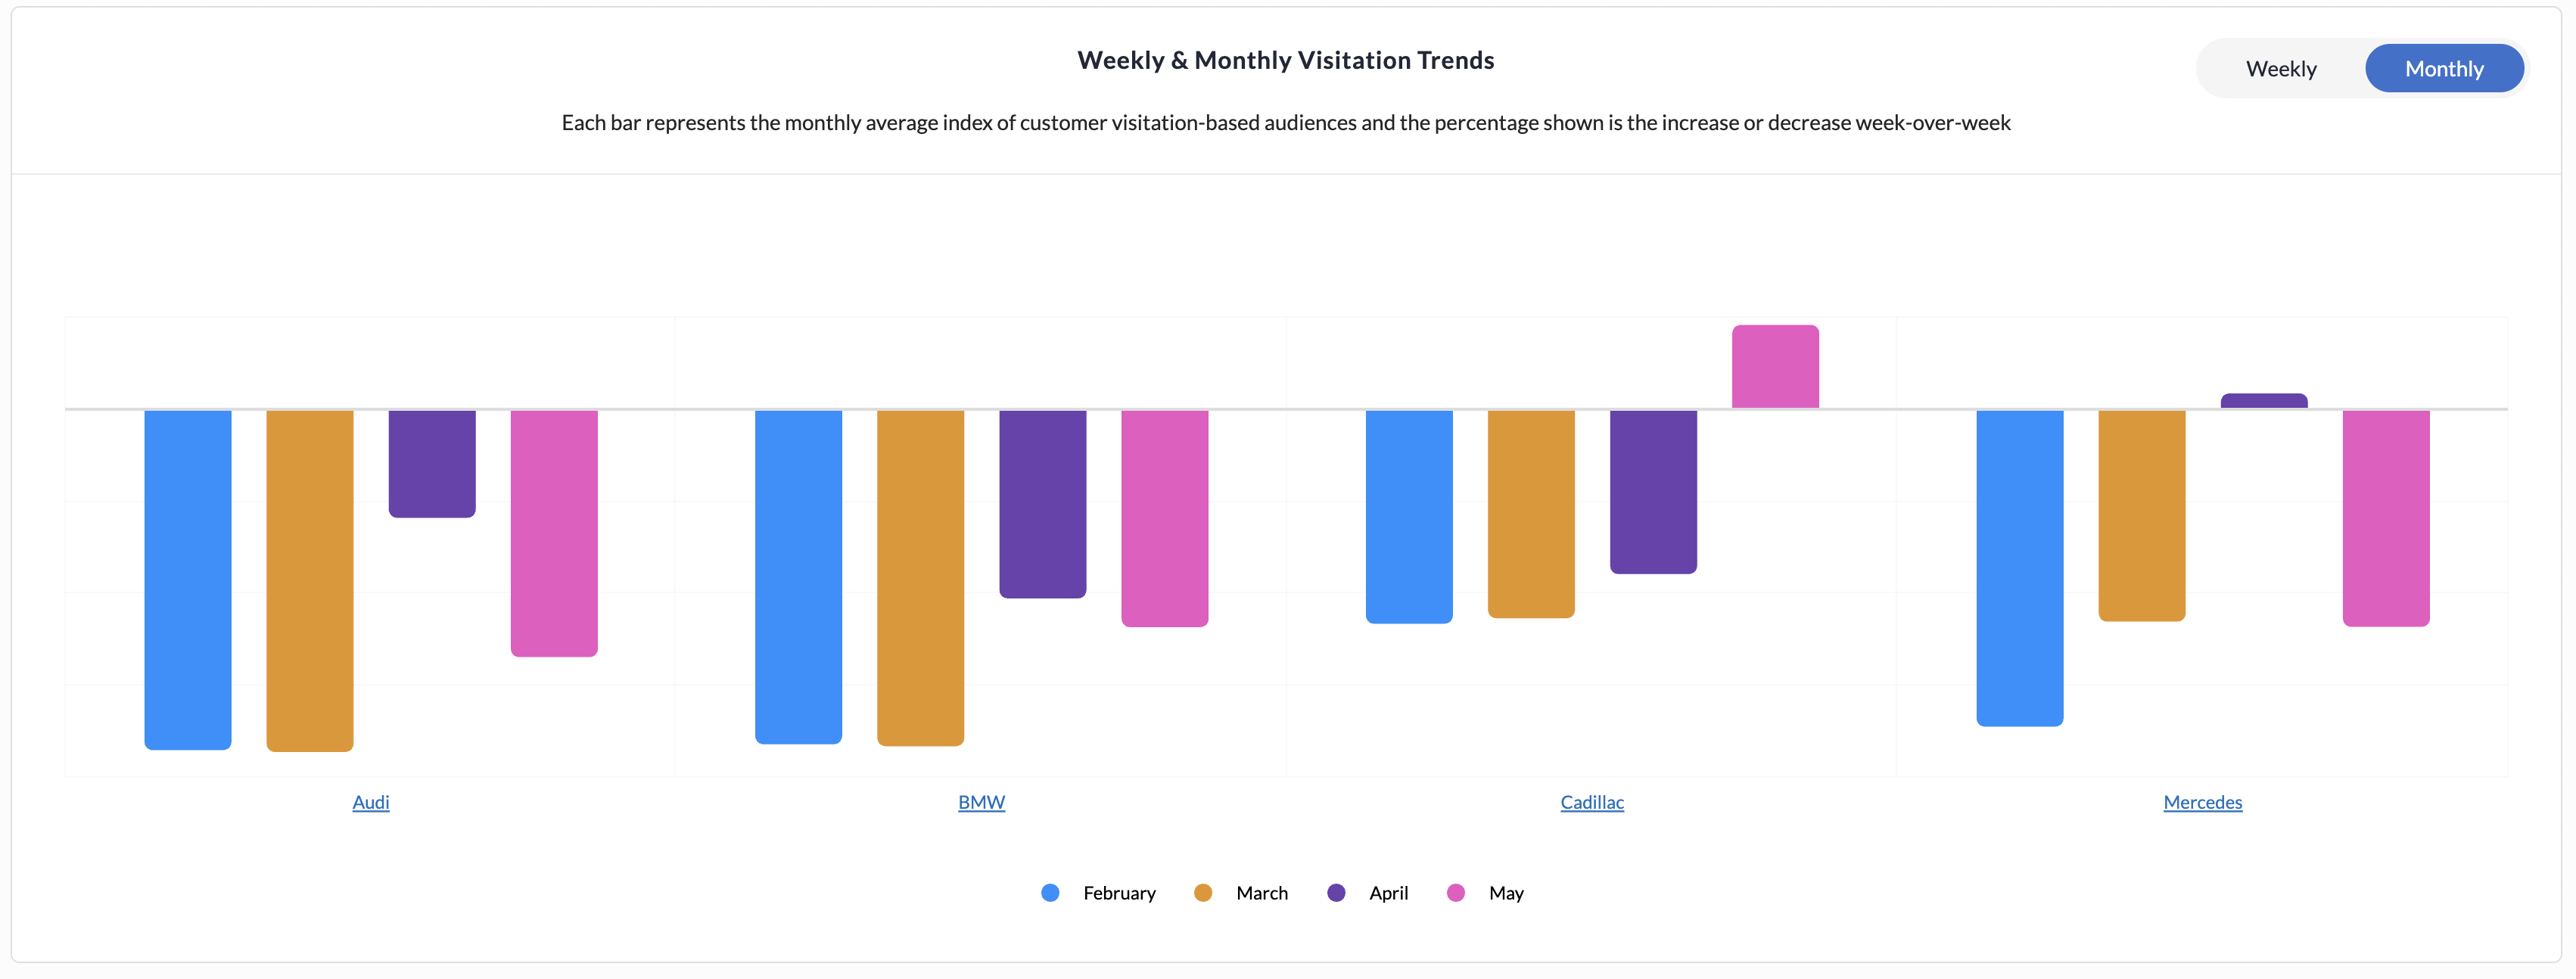
Monthly
Provides a month-over-month comparison across the most recent four months, with one graph per segment and interactive hover insights showing percentage changes. It helps users identify long-term growth or decline trends and evaluate the sustained impact of strategies over time.
-
The last four months with available data, pre-selected by default.
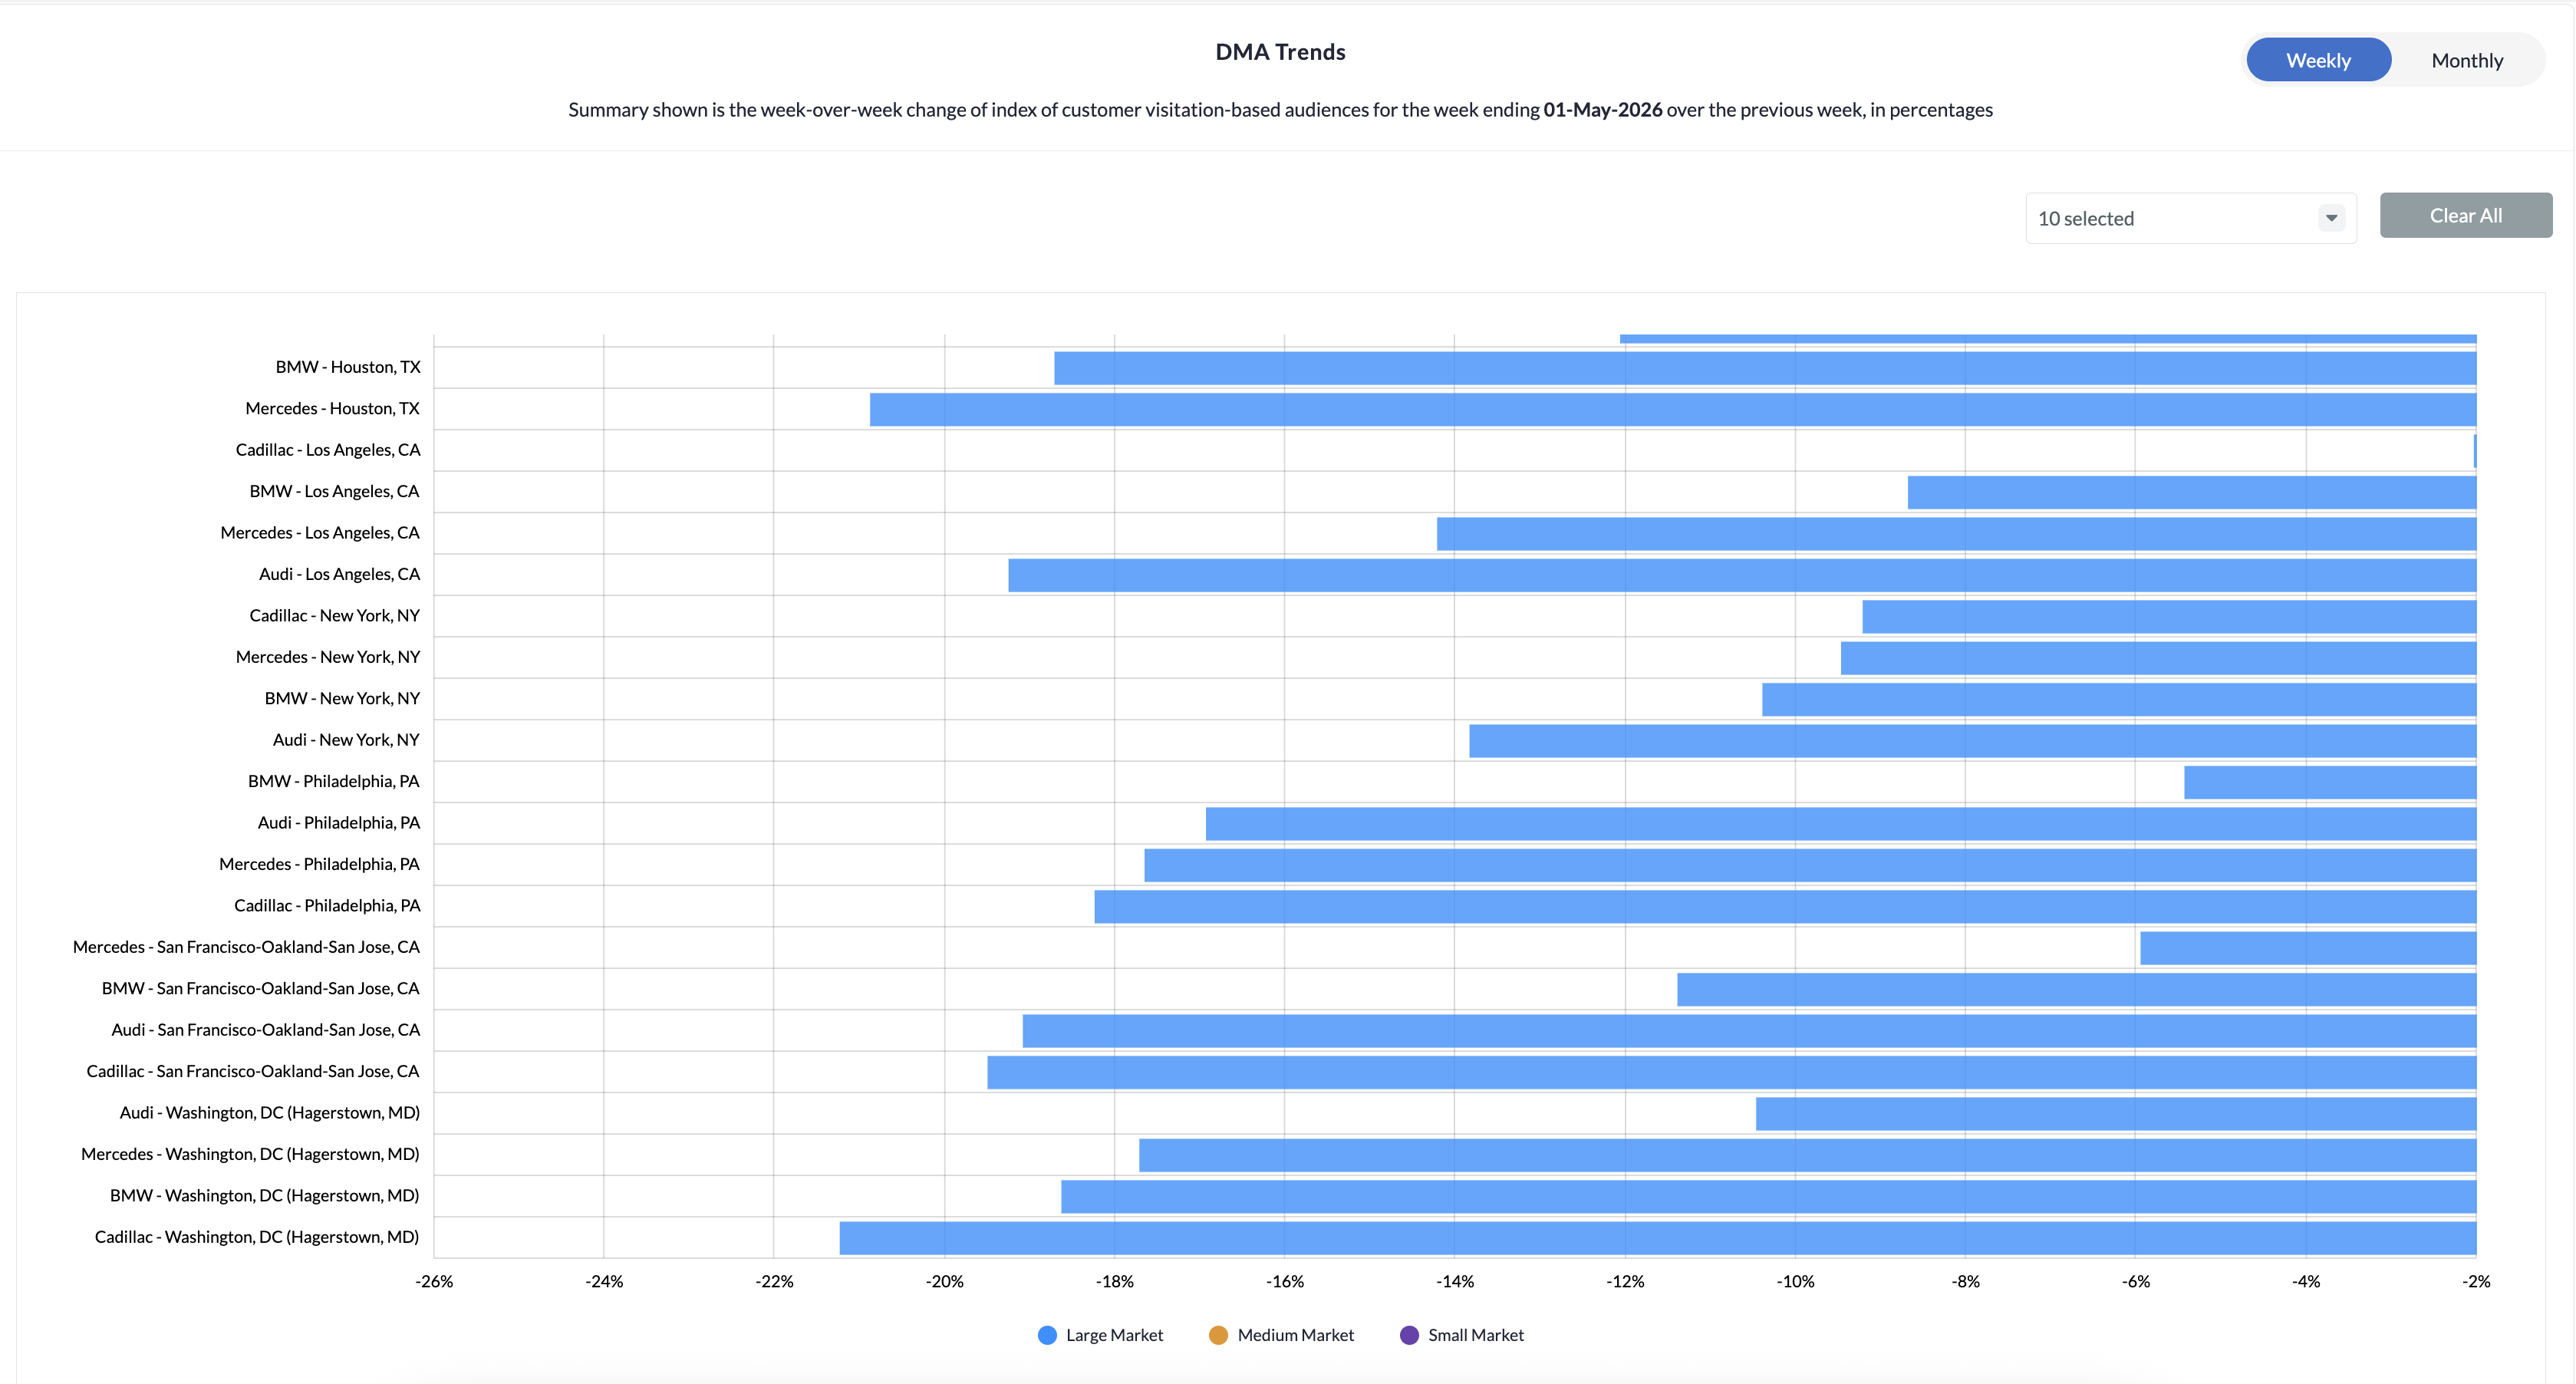
DMA
Scroll down to view the weekly and monthly visitation trends by DMA to identify which markets are prime for conquesting.
-
Shows the week-over-week or month-over-month change of the visitation index for the latest week/month vs. the previous week/month.
-
Displayed in percentages for different DMAs, segmented by market size: Small, Medium, Large.
The top 10 largest US DMAs are shown by default; more can be added manually.
Discussion Index
Discussion Index is used to find inspiration for messaging opportunities based on trending topics in which customers are engaging.
Change the selections in the dropdown to see trending topics for different demographic groups.
-
Click Explore Full Report to see additional views.
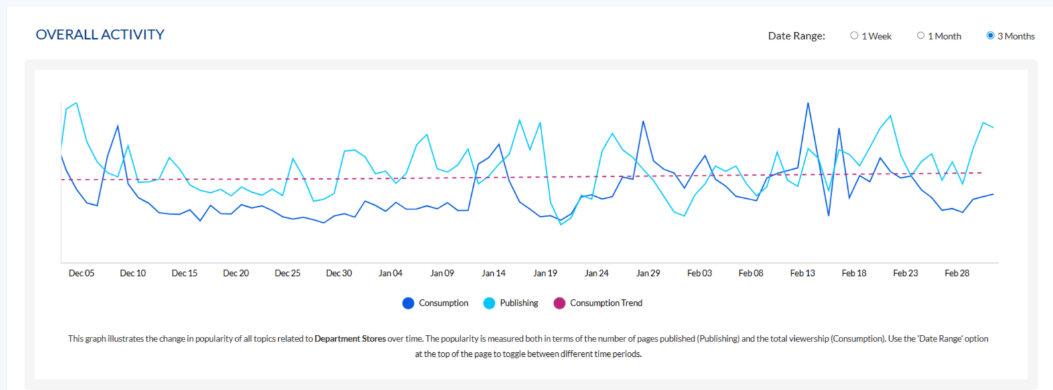
Overall Activity
The overall activity graph illustrates the change in popularity of all topics related to the selected vertical over time. The popularity is measured both in terms of the number of pages published (Publishing) and the total viewership (Consumption).
-
Use the Date Range option at the top of the page to toggle between different time periods amid 1 week, 1 month, and 3 months.
Key Insights
Click on the Key Insights button at the top right to reveal the following:
-20241015-091715.gif?cb=9acadc647868e58539d7134e2e7f8a4f)
-
The Most Popular tab displays the topics with the most viewership determined by the selected date range.
-
The Least Popular tab displays the topics with the least viewership, determined by the selected date range.
-
The Upward Trending tab displays the topics with the largest increase in popularity, determined by the selected date range.
-
The Downward Trending tab displays the topics with the largest decline in popularity, determined by the selected date range.
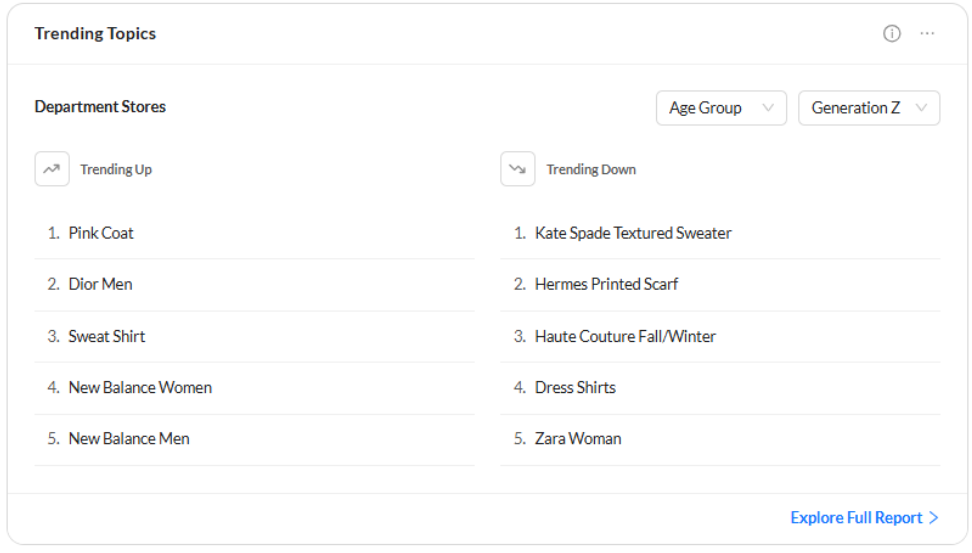
Key Trends
Scroll down to the Key Trends section to view the top 5 upward/downward trending topics. You can select the desired segments to compare.
-20241015-092010.gif?cb=5ace07a237883b7dd97cf341eb435b31)
-
View the top 5 upward-trending topics that exhibit the largest increase in popularity over the selected duration.
-
View the top 5 downward-trending topics that exhibit the largest decline in popularity over the selected duration.
You can further select Audience Segments to compare the topic consumption trends between the specified demographic groups (Age, Gender, & Ethnicity).
-20241015-092236.gif)