
Discussion Index

Discussion Index by Vertical
The Zeta Discussion Index (ZDI) by Vertical is used to find inspiration for messaging opportunities based on trending topics in which customers are engaging.
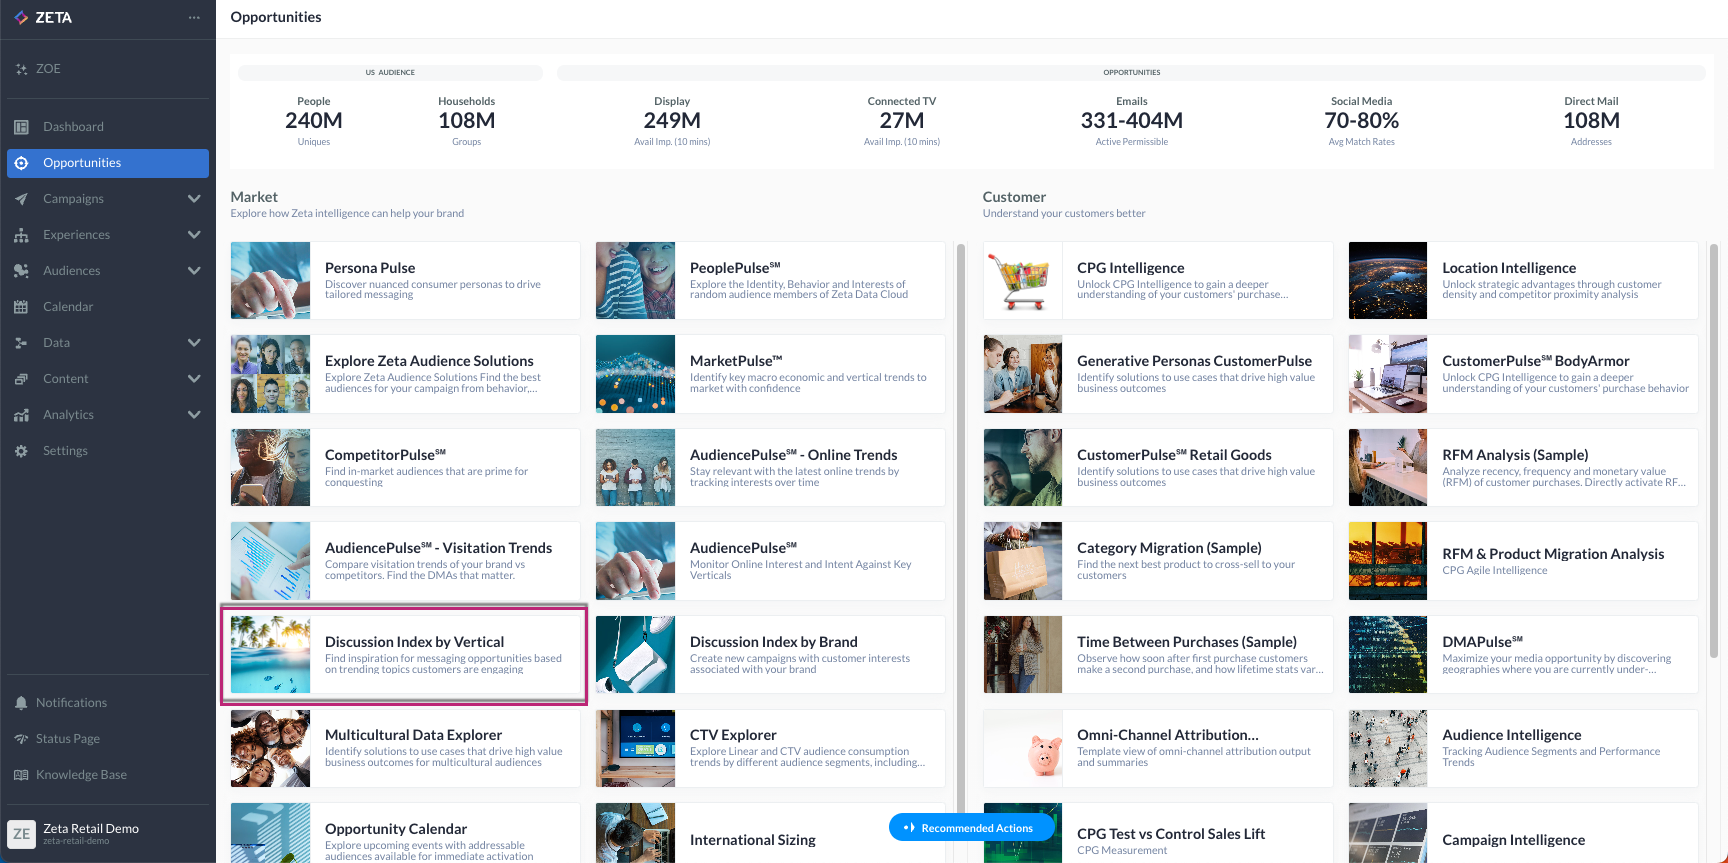
From the Opportunities page, navigate to the Discussion Index by Vertical tab under Market insights.
-20241015-091401.gif?inst-v=ee32691c-66ac-46c7-afdb-dc8f6e6bf200)
Overall Activity
The overall activity graph illustrates the change in popularity of all topics related to the selected vertical over time. The popularity is measured both in terms of the number of pages published (Publishing) and the total viewership (Consumption).
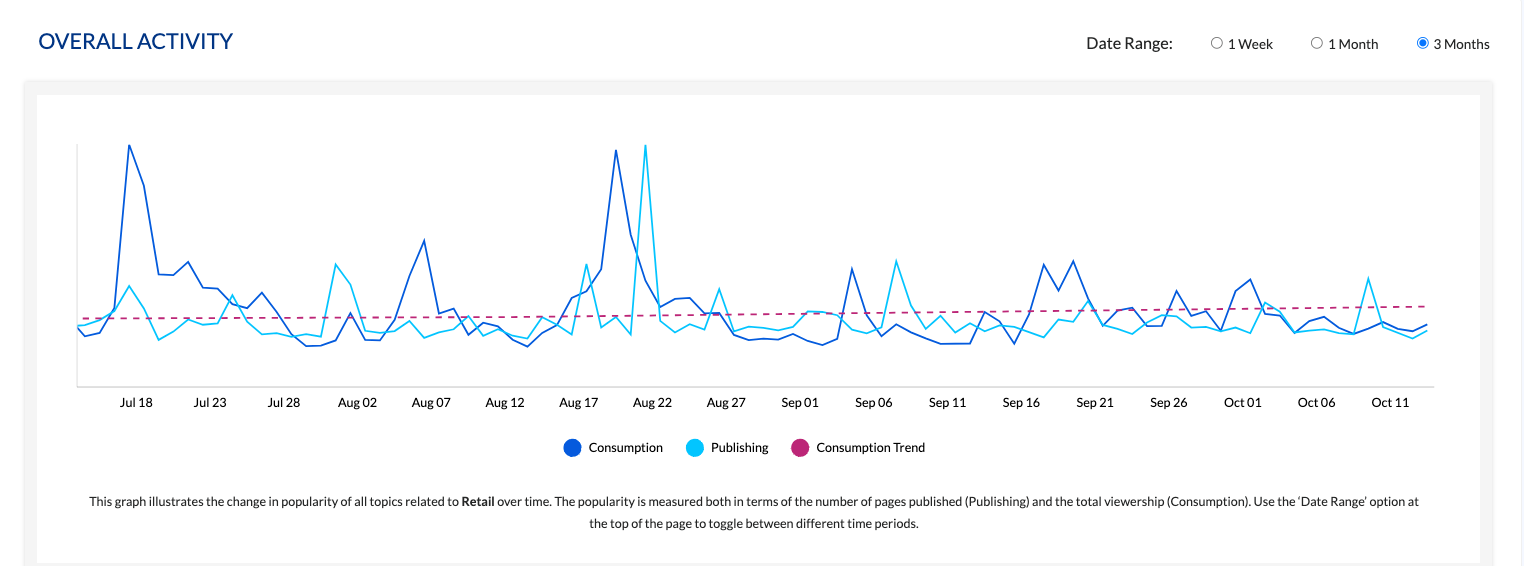
Use the Date Range option at the top of the page to toggle between different time periods amid 1 week, 1 month, and 3 months.
Key Insights
Click on the Key Insights button at the top right to reveal the following:
-20241015-091715.gif?inst-v=ee32691c-66ac-46c7-afdb-dc8f6e6bf200)
The Most Popular tab displays the topics with the most viewership determined by the selected date range.
The Least Popular tab displays the topics with the least viewership determined by the selected date range.
The Upward Trending tab displays the topics with the largest increase in popularity determined by the selected date range.
The Downward Trending tab displays the topics with the largest decline in popularity determined by the selected date range.
Key Trends
Scroll down to the Key Trends section to view the top 5 upward/downward trending topics. You can select the desired segments to compare.
-20241015-092010.gif?inst-v=ee32691c-66ac-46c7-afdb-dc8f6e6bf200)
View the top 5 upward trending topics that exhibit the largest increase in popularity over the selected duration.
View the top 5 downward trending topics that exhibit the largest decline in popularity over the selected duration.
You can further select Audience Segments to compare the topic consumption trends between the specified demographic groups (Age, Gender, & Ethnicity).
-20241015-092236.gif?inst-v=ee32691c-66ac-46c7-afdb-dc8f6e6bf200)
Discussion Index by Brand
The Zeta Discussion Index (ZDI) by Brand identifies brand-level trending topics that resonate with different demographic groups. Marketers use ZDI to pinpoint trends for products, lines of business, and features related to their brand, and to gain insights into a creative direction, campaign penetration measurement and benchmarks against competitors.
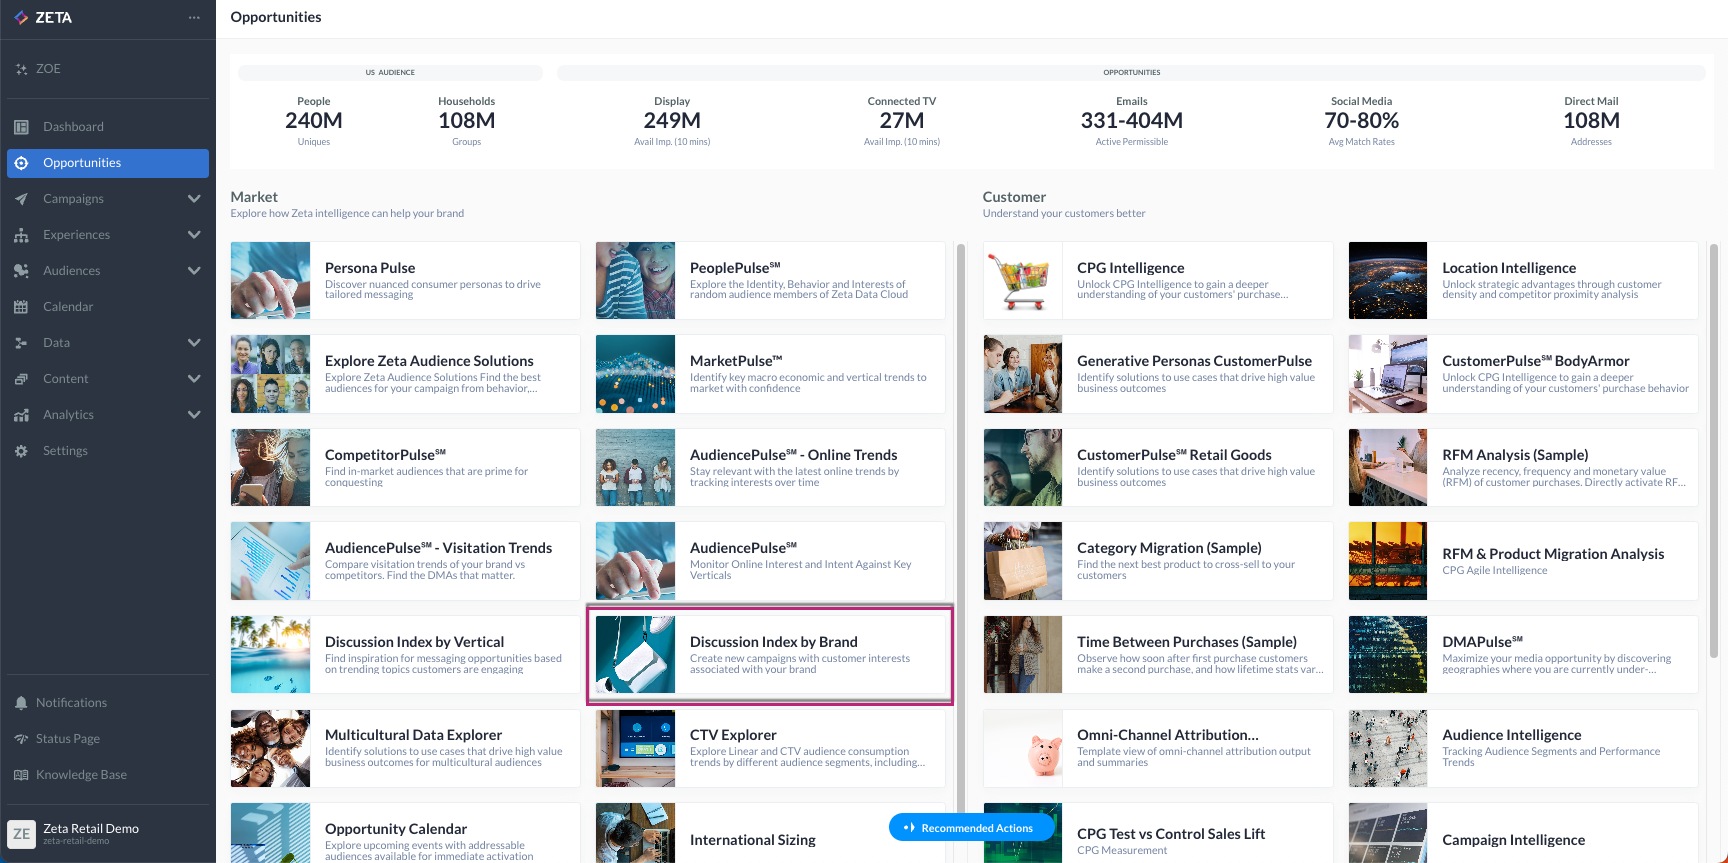
From the Opportunities page, navigate to the Discussion Index by Brand tab under Market insights.
Overall Activity
The overall activity graph illustrates the change in popularity of all topics related to the selected brand over time. The popularity is measured both in terms of the number of pages published (Publishing) and the total viewership (Consumption).
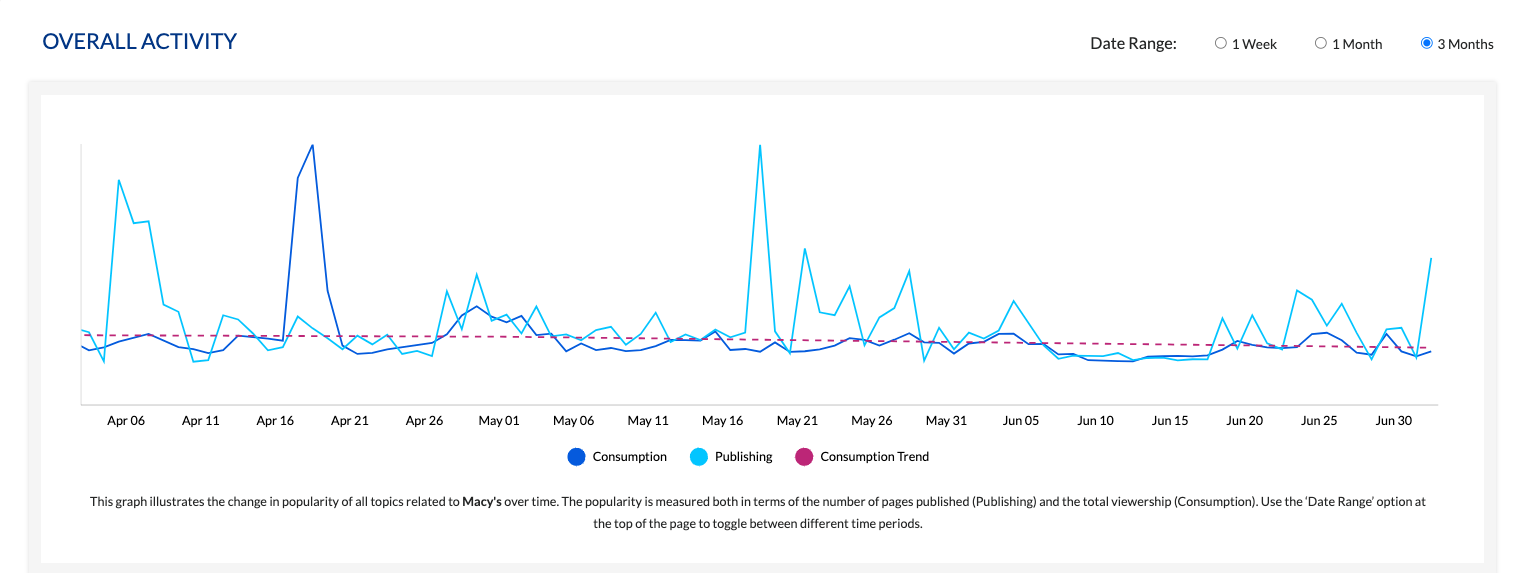
Use the Date Range option at the top of the page to toggle between different time periods.
Key Insights
Click on the Key Insights button at the top right to reveal the following:
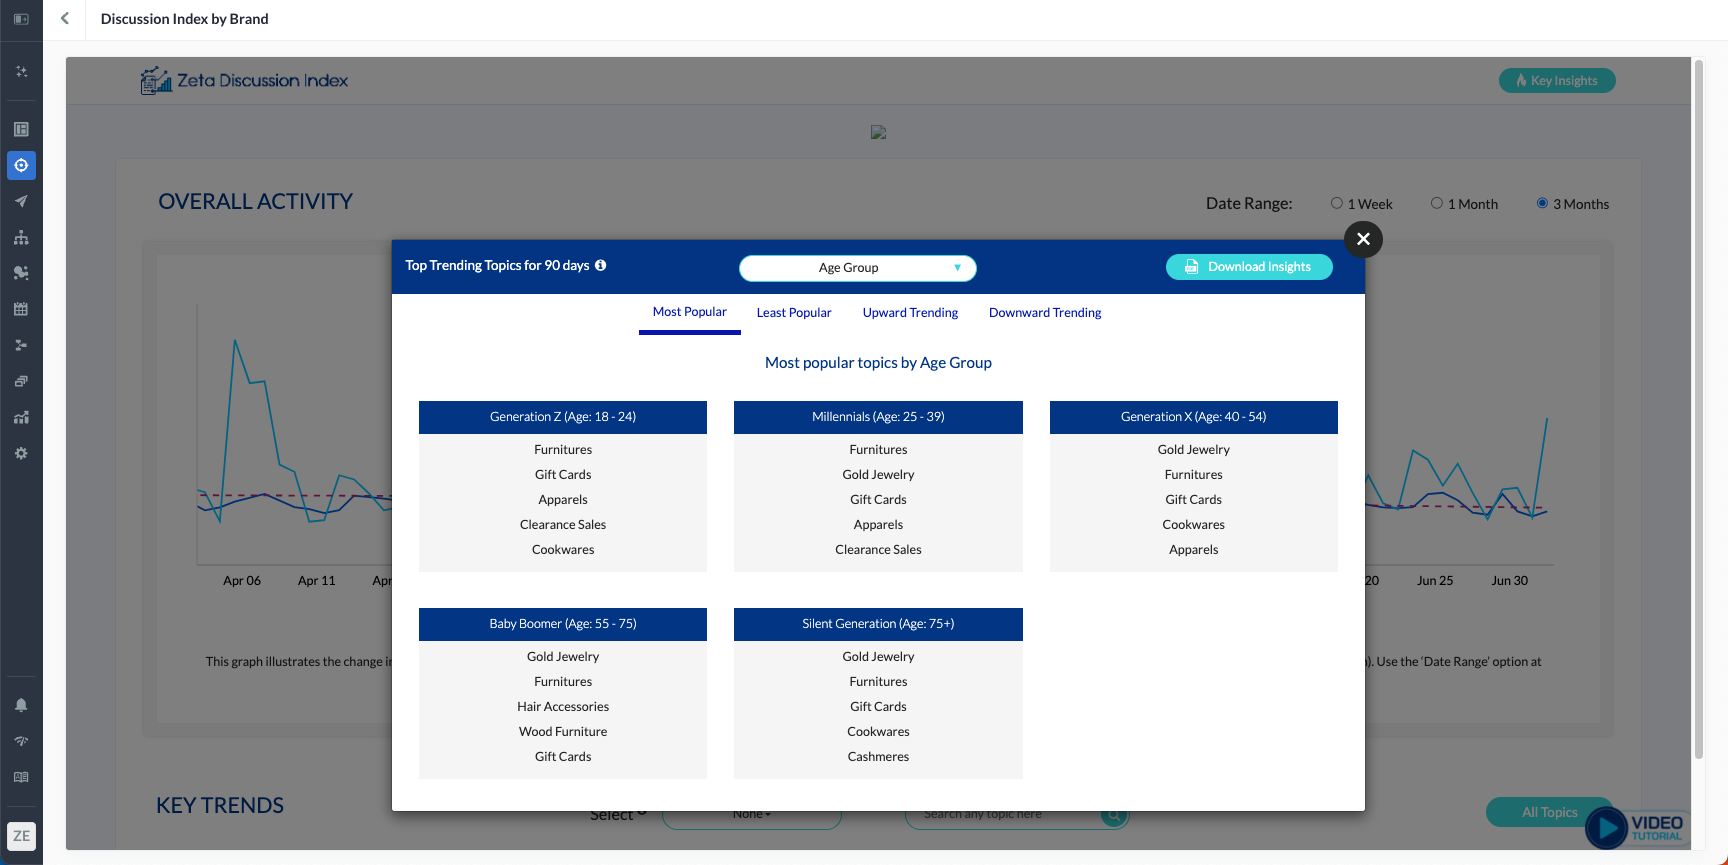
The Most Popular tab displays the topics with the most viewership determined by the selected date range.
The Least Popular tab displays the topics with the least viewership determined by the selected date range.
The Upward Trending tab displays the topics with the largest increase in popularity determined by the selected date range.
The Downward Trending tab displays the topics with the largest decline in popularity determined by the selected date range.
Key Trends
Scroll down to the Key Trends section to view the top 5 upward/downward trending topics. You can select the desired segments to compare.
-20241015-093047.gif?inst-v=ee32691c-66ac-46c7-afdb-dc8f6e6bf200)
View the top 5 upward trending topics that exhibit the largest increase in popularity over the selected duration.
View the top 5 downward trending topics that exhibit the largest decline in popularity over the selected duration.
Clicking on All Topics will reveal the available topics for you to view and select from.
-20241015-093246.gif?inst-v=ee32691c-66ac-46c7-afdb-dc8f6e6bf200)
You can further click on the tiles to compare the topic consumption trends between the specified demographic groups (Age, Gender, & Ethnicity).
-20241015-093456.gif?inst-v=ee32691c-66ac-46c7-afdb-dc8f6e6bf200)