

Zeta CPG Intelligence is a powerful analytics and activation suite designed to help Consumer Packaged Goods (CPG) brands uncover, understand, and act on their customers' purchasing behaviors with unprecedented precision. Leveraging transactional data across 1,000+ retailers and 10,000+ CPG brands, this solution provides deep insights into who is buying, what they’re buying, and where and how often they buy it.
Through closed-loop attribution, SKU-level data matching, and granular behavioral metrics, brands can:
-
Compare performance across sub-brands and competitors,
-
Identify high-value audiences using RFM segmentation,
-
Unlock strategic opportunities for product launches,
-
Optimize media investments based on actual purchase behavior,
-
And ultimately, increase customer loyalty, LTV, and frequency of purchase.
Whether you’re planning your next product launch, refining trade promotions, or protecting your market share, Zeta CPG Intelligence turns real-time shopper data into actionable strategies to grow your brand.
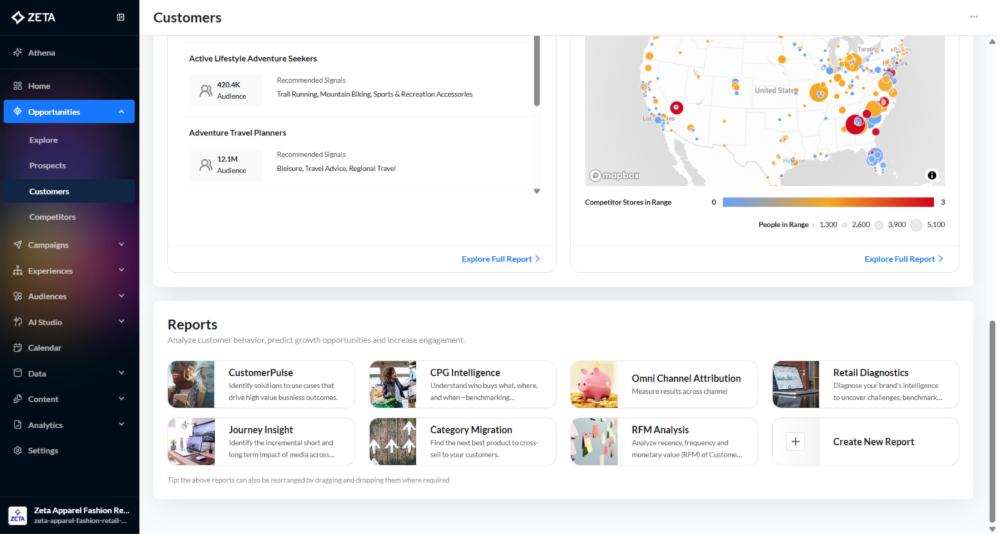
In the Opportunities menu, navigate to Customers, then scroll to the reports section.
Who
(Understanding the Customer)
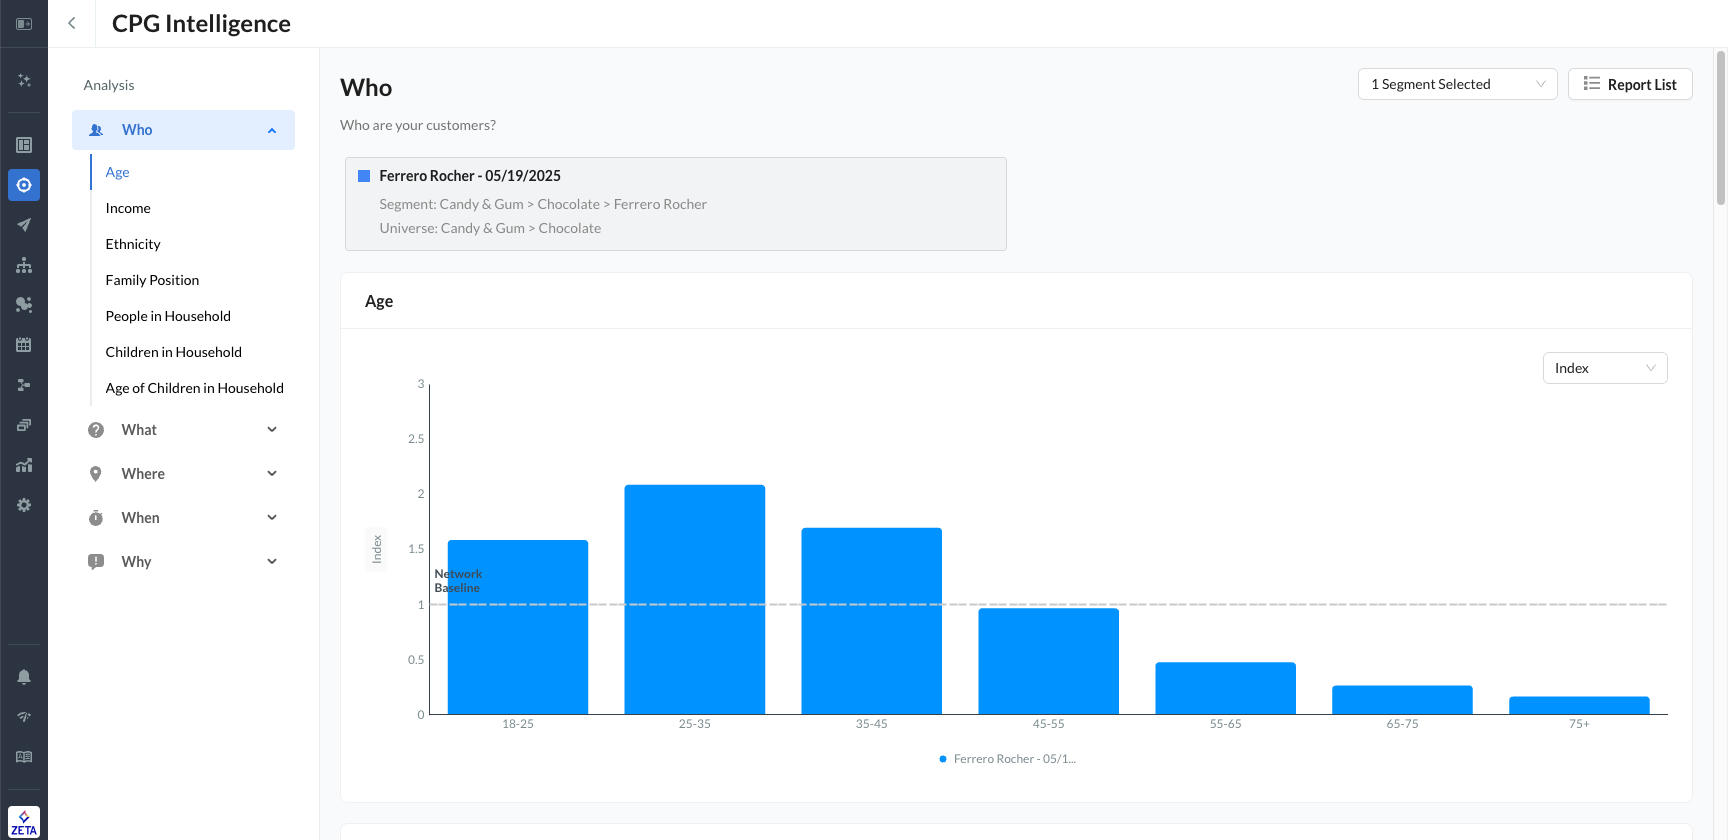
This section helps brands answer the fundamental question: Who is buying my products?
Zeta CPG Intelligence segments and profiles audiences using demographic and household data such as:
-
Age: Discover which age groups are over- or under-indexed for your brand. For example, Ferrero Rocher skews toward the 25–35 segment, which indexes significantly above the network baseline.
-
Income & Ethnicity: Identify how income tiers and ethnic backgrounds influence brand affinity.
-
Household Composition: Breakdown includes number of people, presence of children, and ages of children, enabling nuanced targeting for family-oriented products.
-
Family Position: Understand whether customers are single, married, or in other household roles that may affect purchasing behavior.
-
People in Household: Understand household size to tailor messaging — whether your product is favored by individuals, couples, or larger families.
-
Children in Household: Determine whether your customer base includes children, which can influence product type, packaging, or promotions.
-
Age of Children in Household: Breaks down whether children are toddlers, school-aged, or teens, helping fine-tune targeting based on life stage.
-20250626-070428.gif?cb=b00dbdbb75820d0218fc155751046bb6)
-
Each attribute is visualized using Index-based charts that compare your segment to the market baseline. You can also switch to Percentage view via a dropdown for flexible interpretation based on your use case.
What
(Analyzing Product Preference & Market Dynamics)
This section highlights what your customers are buying and how your brand stacks up against competitors.
Key components include:
-
Market Share: A multicolored donut chart visually presents how your brand compares with others like Hershey’s, Cadbury, Lindt, and M&M’s. This helps benchmark performance.
-
Brand Loyalty: Visuals and metrics on repeat purchases identify how sticky your brand is, and where loyalty drops.
-
Competitive Conquesting: Track if customers are switching from competitors to your brand or vice versa.
-
Share of Basket: Discover what percentage of a shopper’s total spend your brand captures.
-
First/Top Product Purchased: Understand entry points and top-performing SKUs.
-
Brand vs Private Label: Analyze how your branded products compete with private-label alternatives in the same category.
-20250626-071428.gif?cb=a1229504933dabdf5e24341afa4d843c)
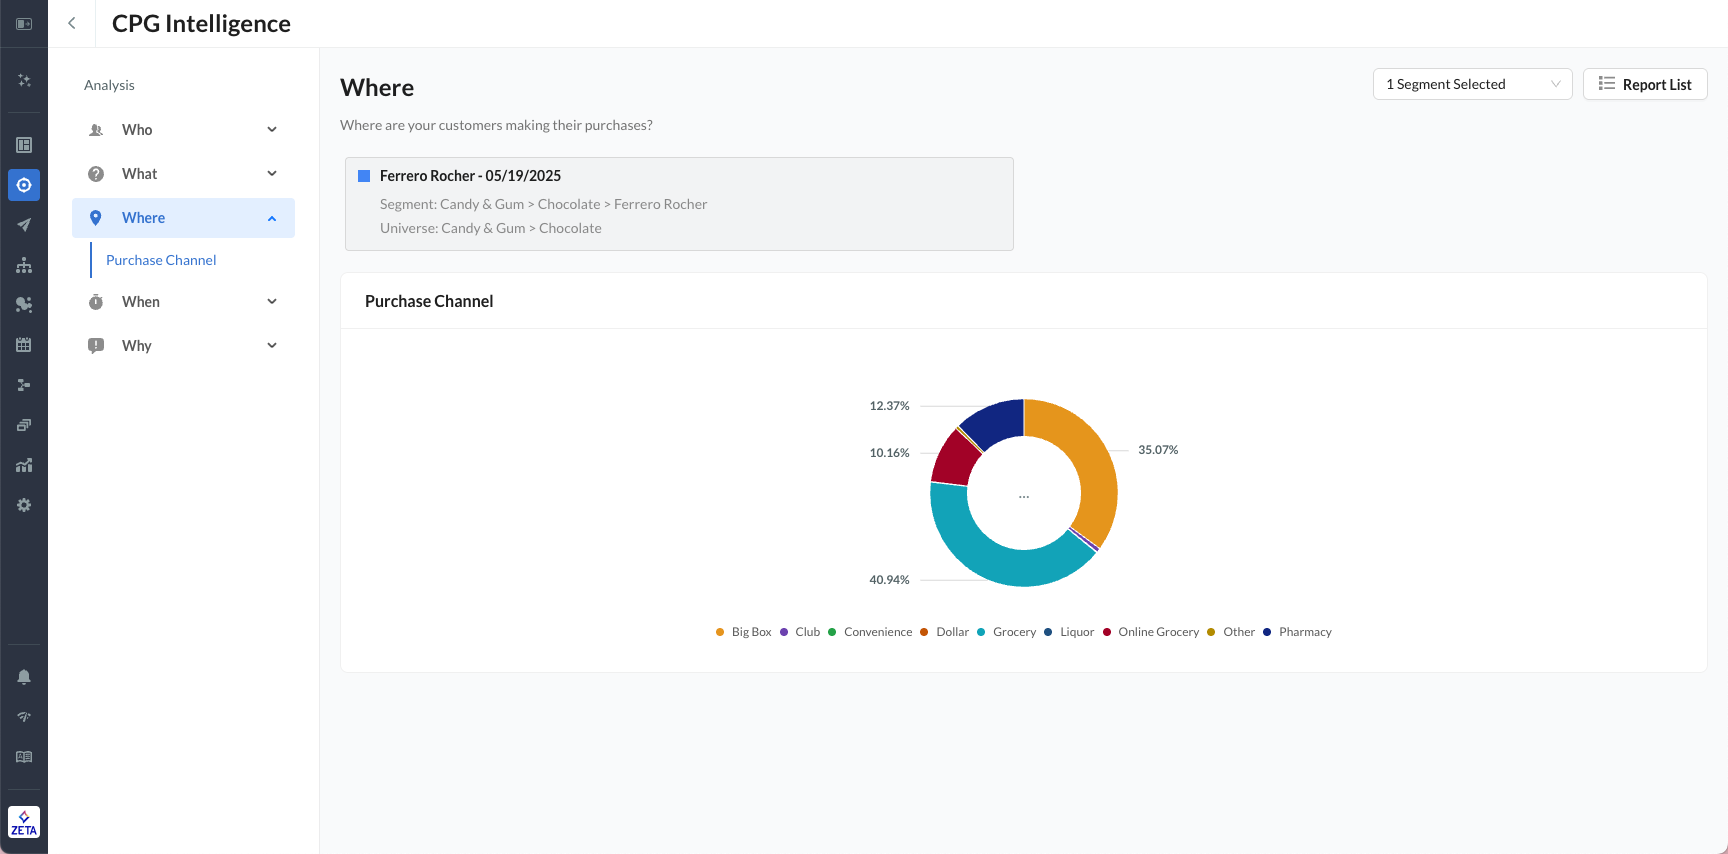
Where
(Locating the Purchase Activity)
Understand where your customers are shopping across both online and offline environments.
-
Purchase Channel Distribution: Pie charts show the breakdown by retail environment: Grocery, Club, Big Box, Online Grocery, Convenience, Dollar stores, etc. For instance, Ferrero Rocher customers are heavily represented in Grocery and big-box channels.
When
(Timing the Purchase Journey)
This section answers when consumers are buying, helping optimize campaign timing and inventory planning.
-
Purchase Time Trends: A detailed hourly bar chart shows when transactions are most likely to occur, highlighting peaks during late evening hours (e.g., 8 PM–10 PM for Ferrero Rocher).
-
Purchase Frequency: Helps identify loyalists vs one-time buyers by measuring how often purchases are repeated within specific time frames (weekly, monthly, quarterly).
-20250626-071935.gif?cb=94d6c02e20748212995128a3c5a0f9da)
Why
(Decoding the Motivation Behind Purchases)
Go deeper to understand why customers choose your brand with psychographic and behavioral signals.
-
Psychographic Traits: Charts measure customer perception with traits like Real, Cool, Wholesome, Imaginative, and Sincere, relative to a network baseline. For Ferrero Rocher, “Real” scores the highest, suggesting authenticity resonates.
-
Online Content Consumption: Tracks what kind of online content your customers consume, from recipe videos to reviews.
-
Visitation & Transactional Patterns: Identifies frequent visits to food and pharmacy outlets, and their purchase history — providing cues for cross-selling or bundling.
-20250626-072455.gif?cb=de4e5ea8462d81f3542bd7ad4869316f)
-
Each attribute is visualized using Index-based charts that compare your segment to the market baseline. You can also switch to Percentage view via a dropdown for flexible interpretation based on your use case.