Connectivity

While data sources are intended to help users and applications connect to and move data to where it needs to be, most platforms keep this connection information hidden and it isn’t even accessible when necessary.
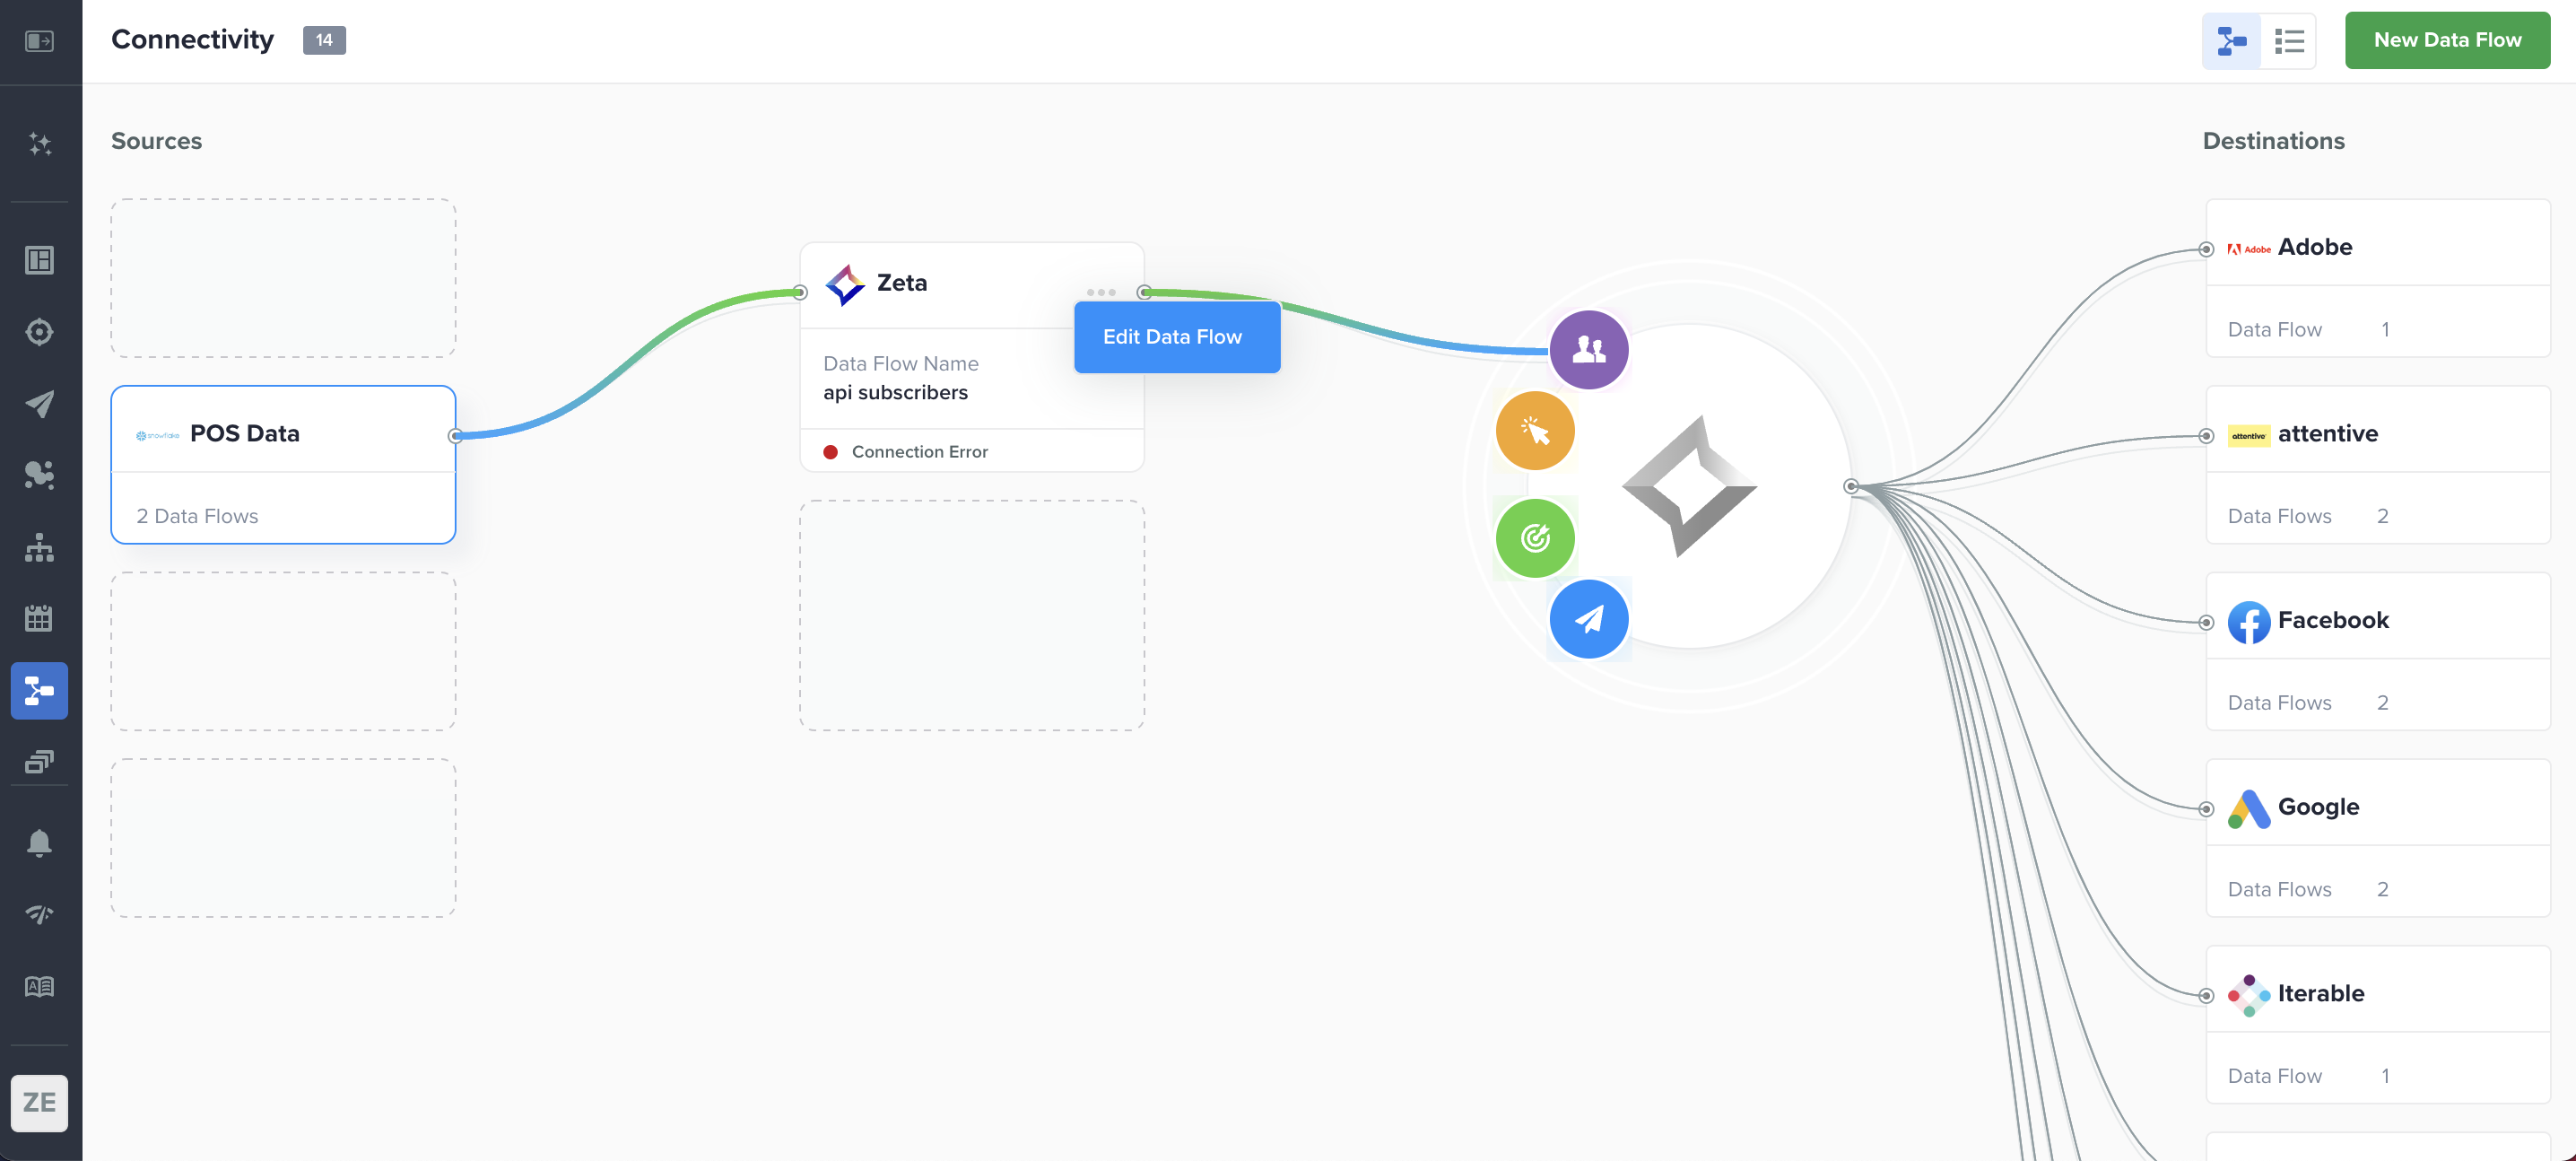
As a first step in providing transparency for data sources and destinations to our users, we provide a full system view of all entities that are bringing in data to the ZMP and carrying out data from the ZMP. Be it data sources and destinations to and from the ZMP through various places within the platform - Integrations, Channel Manager, Connections, Data Flows, Campaigns, and more; or native email/SMS/Push channels, file drops, and ETL data flows; every incoming data flow and outgoing channels will be shown in the form of a butterfly diagram.
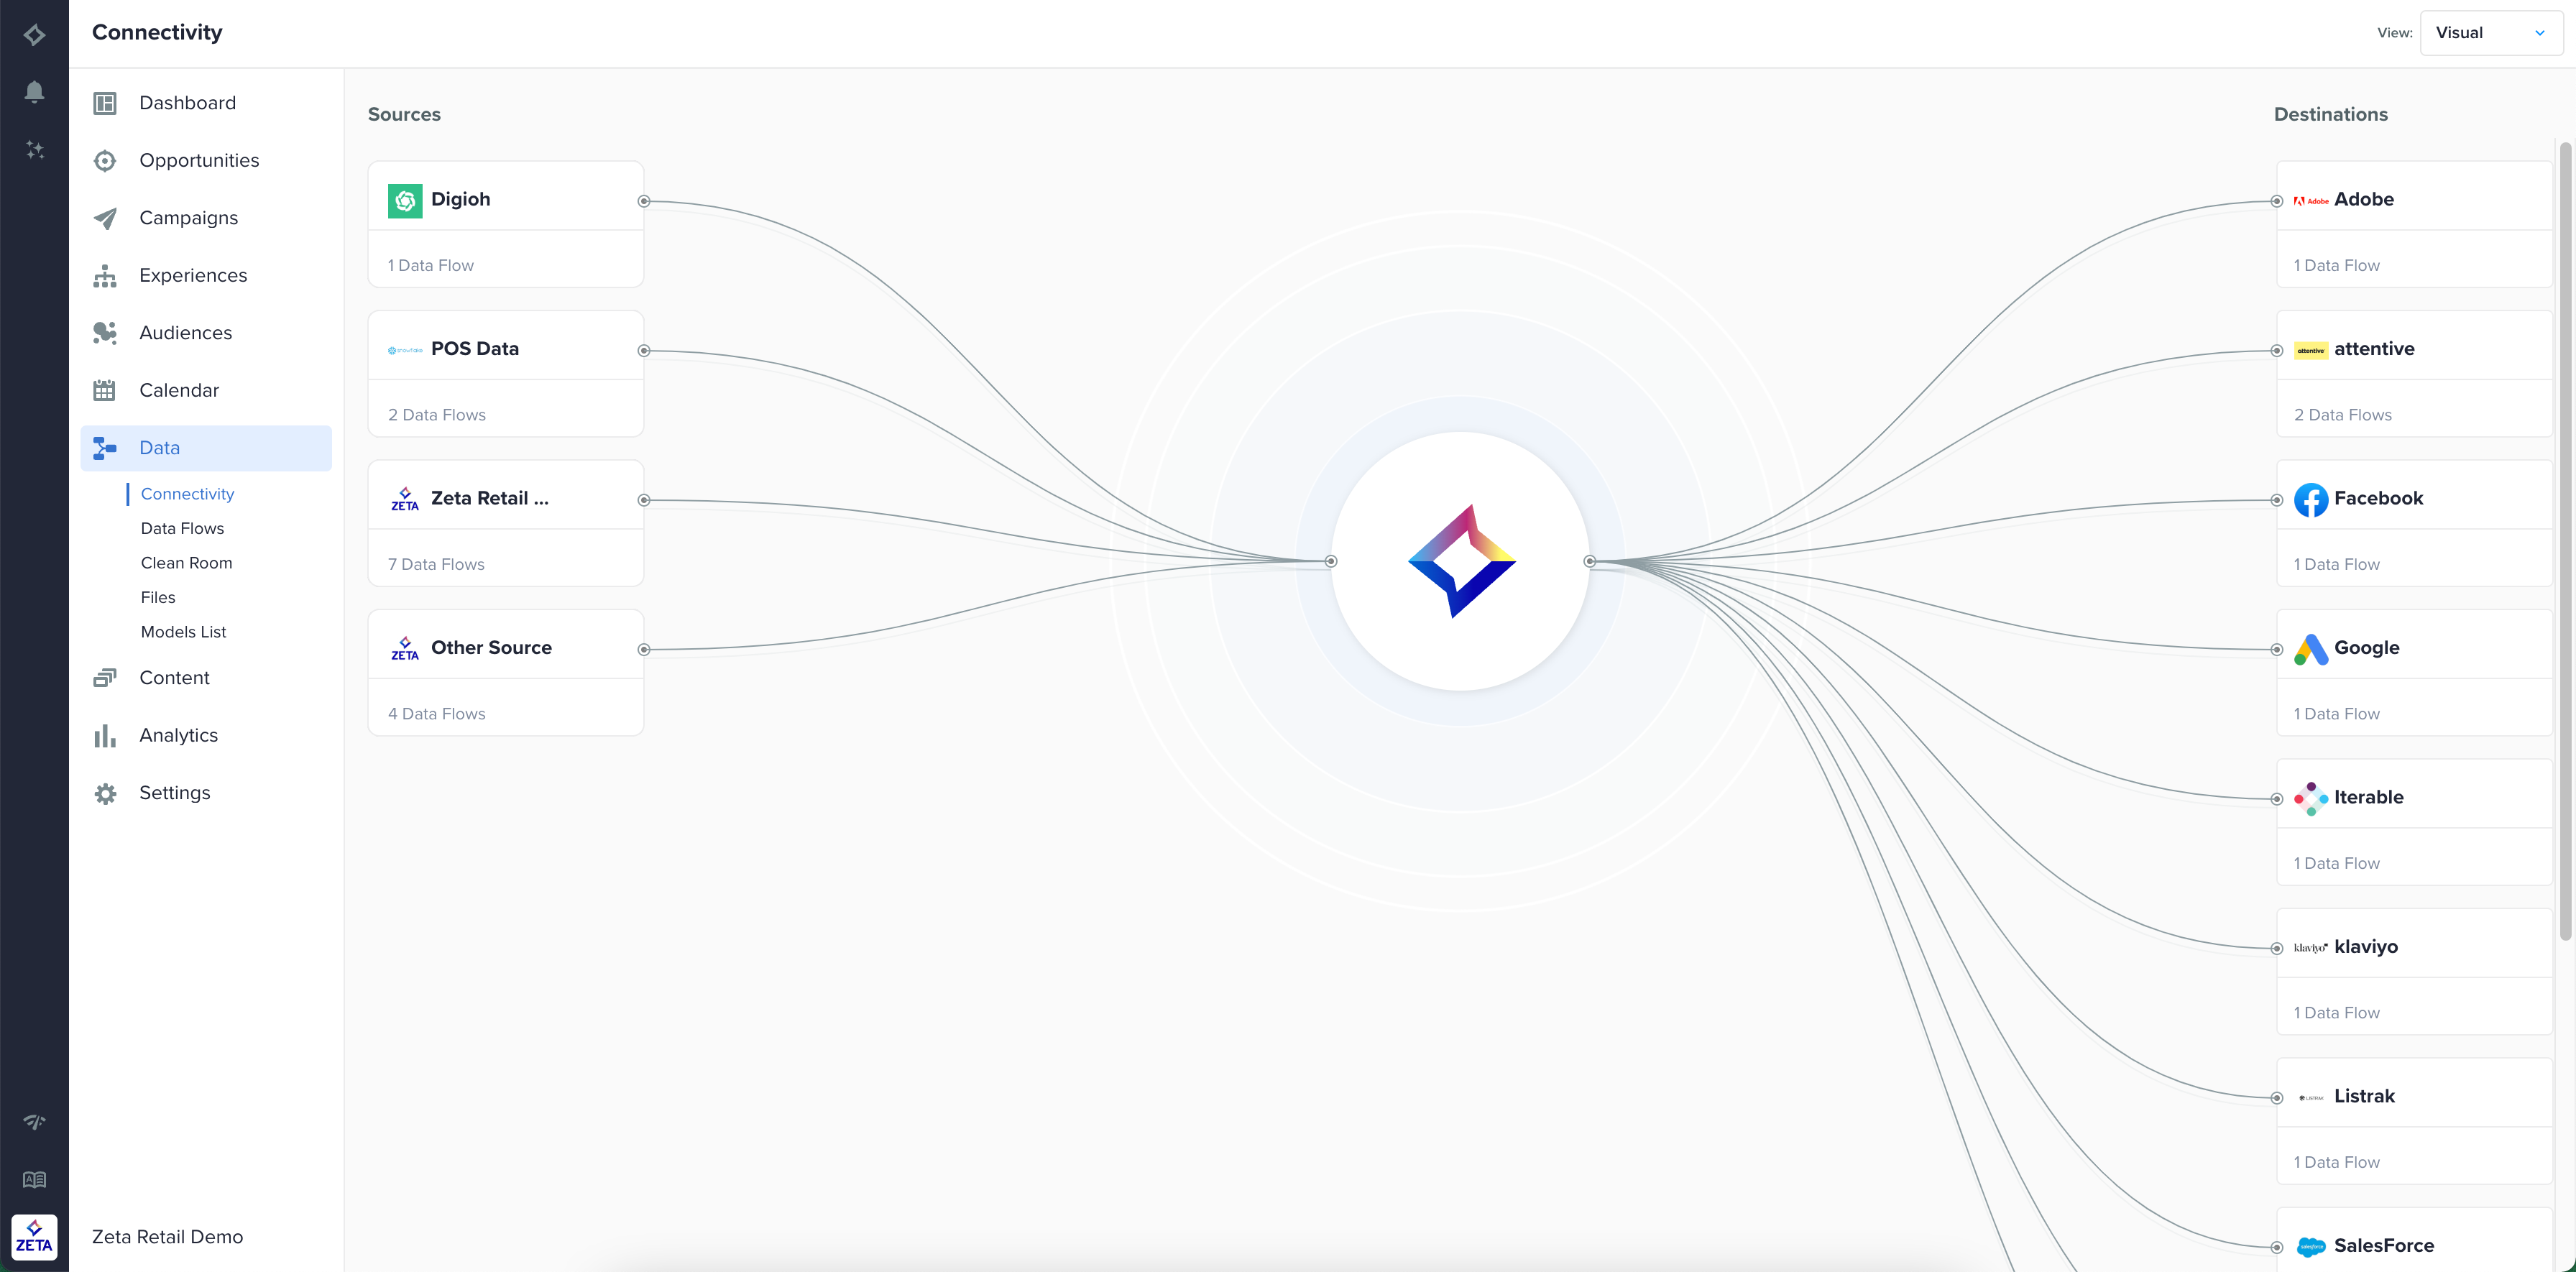
This single canvas is where all current and future connectivity resides so that it appears unified and that data flows are easier to manage for you all. Additionally, you can see what kind of data you are bringing in based on Audiences, Events, Resources, and Campaign Data. You can also see where the ZMP data is being sent to i.e. which channels they are using (email, SMS), webhooks, etc. The type of each channel will also be displayed.
Only active inbound and outbound channels are displayed.
Inbound Side
Click on any of the sources to see how that data is coming in and what connection types we are using from that source.
The imported data goes through one of the four bubbles:
Audiences |  |
Events |  |
Resources |  |
Campaigns |  |
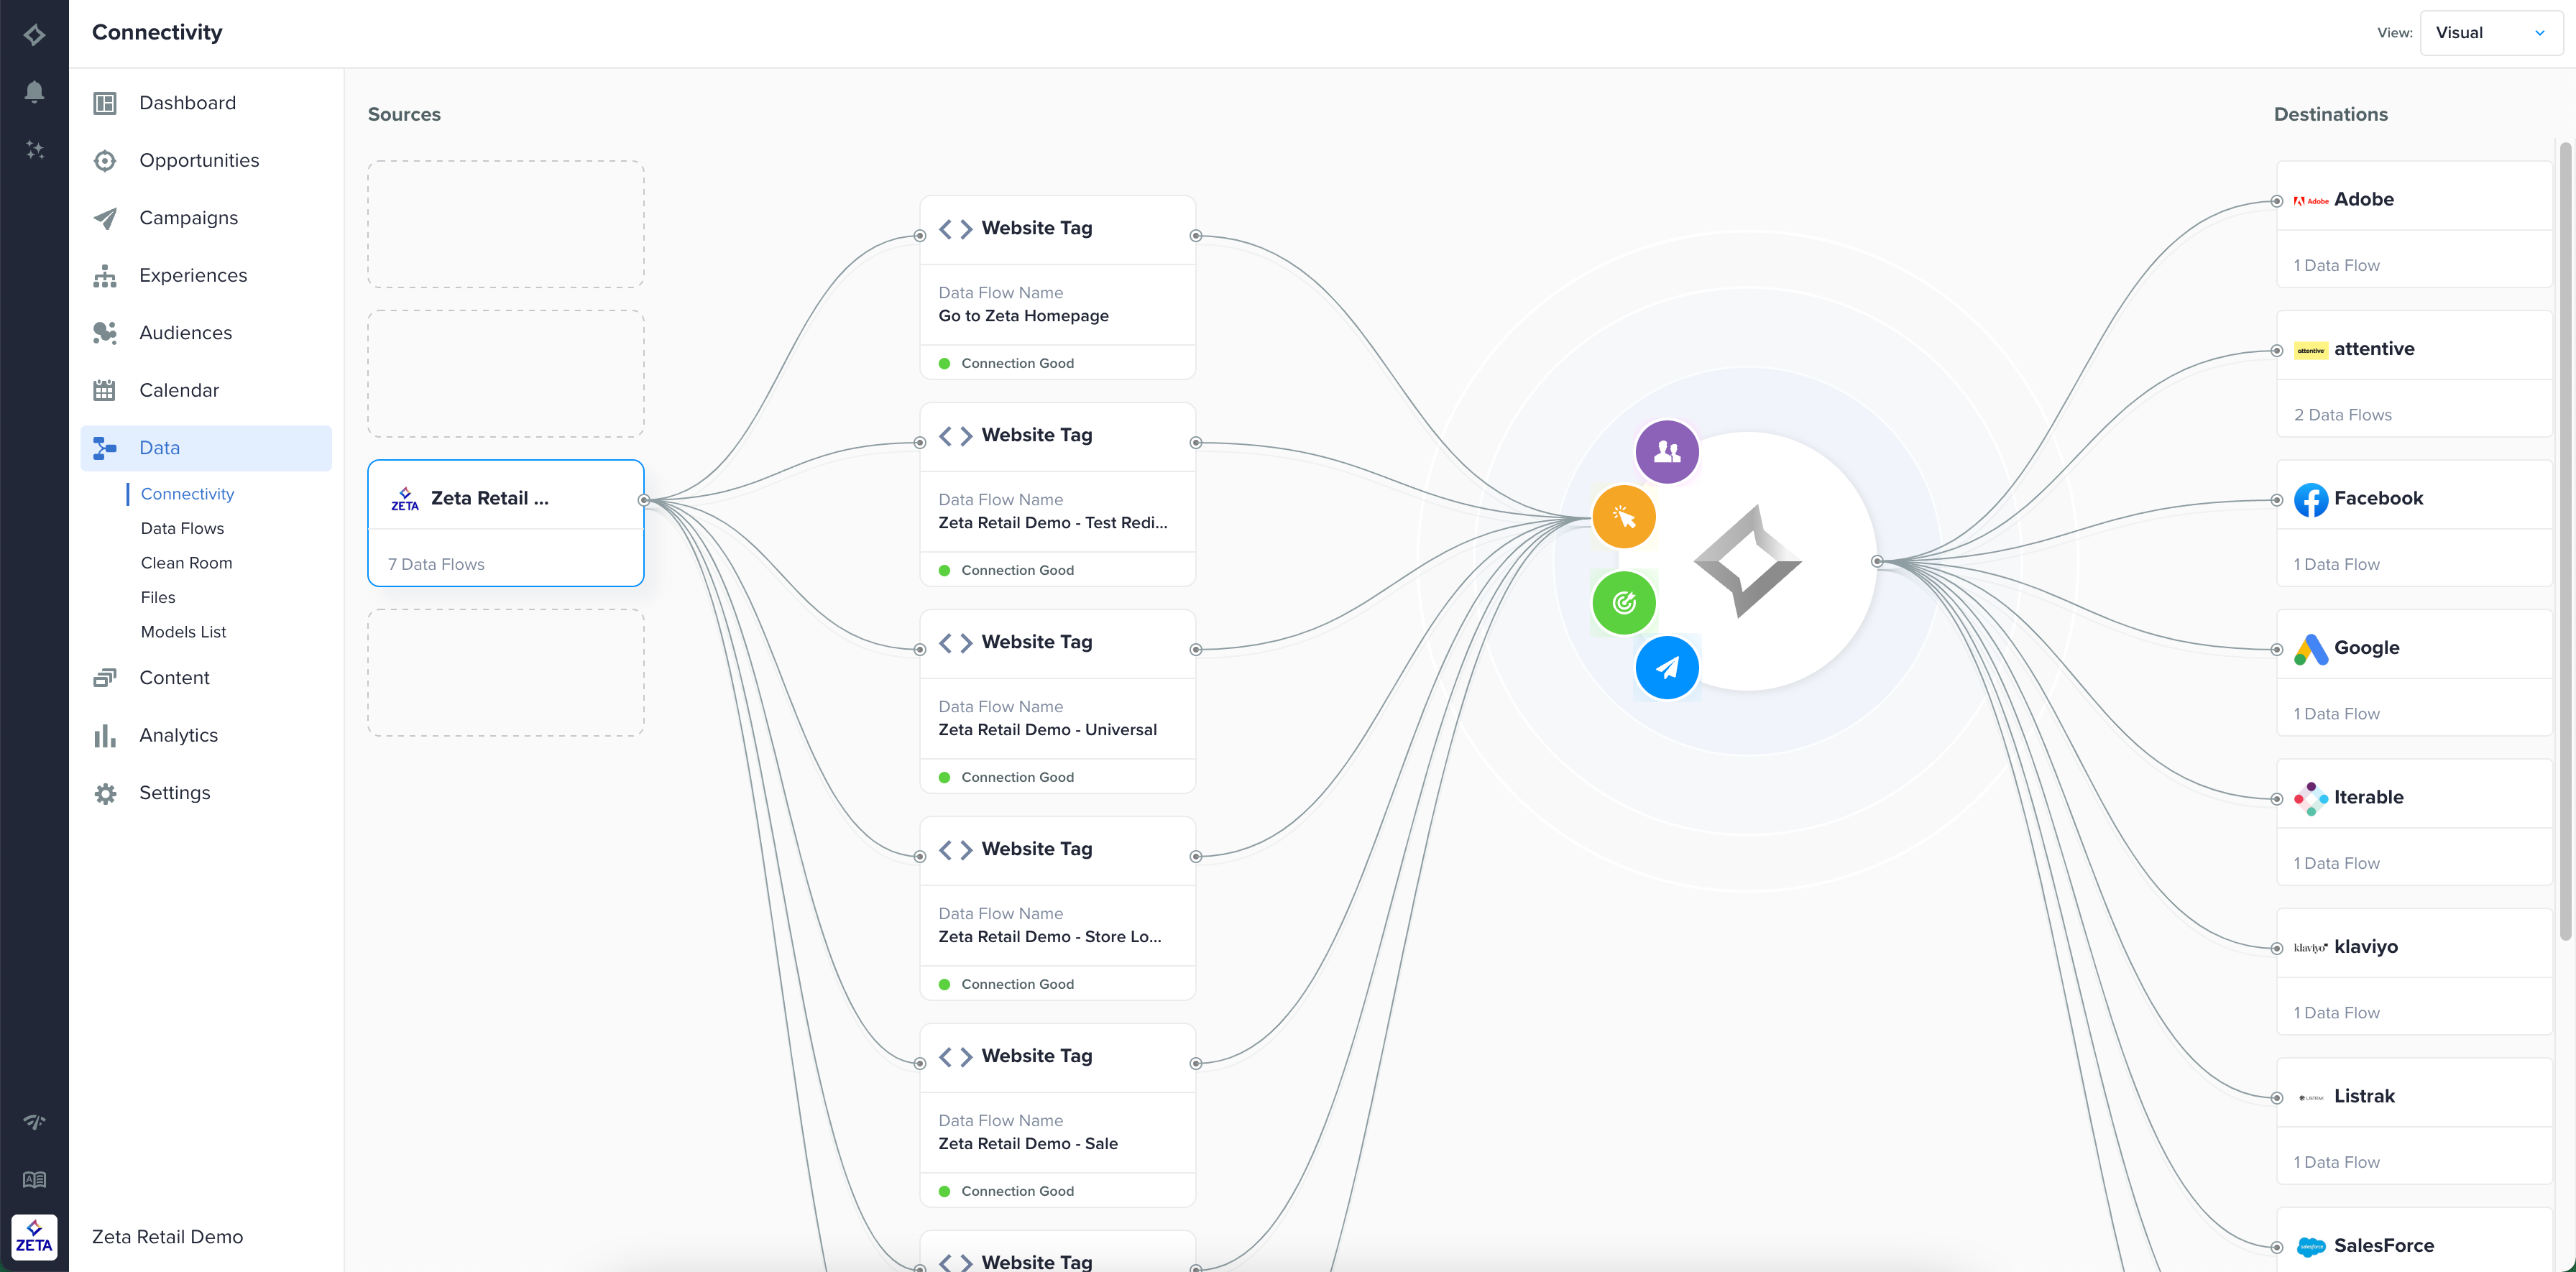
What’s shown on the Inbound Side
1. Data mappings:
While creating a mapping under Data Mappings sub-menu item, choose a company name and logo representing your vendor and the mapping will be displayed as shown below.
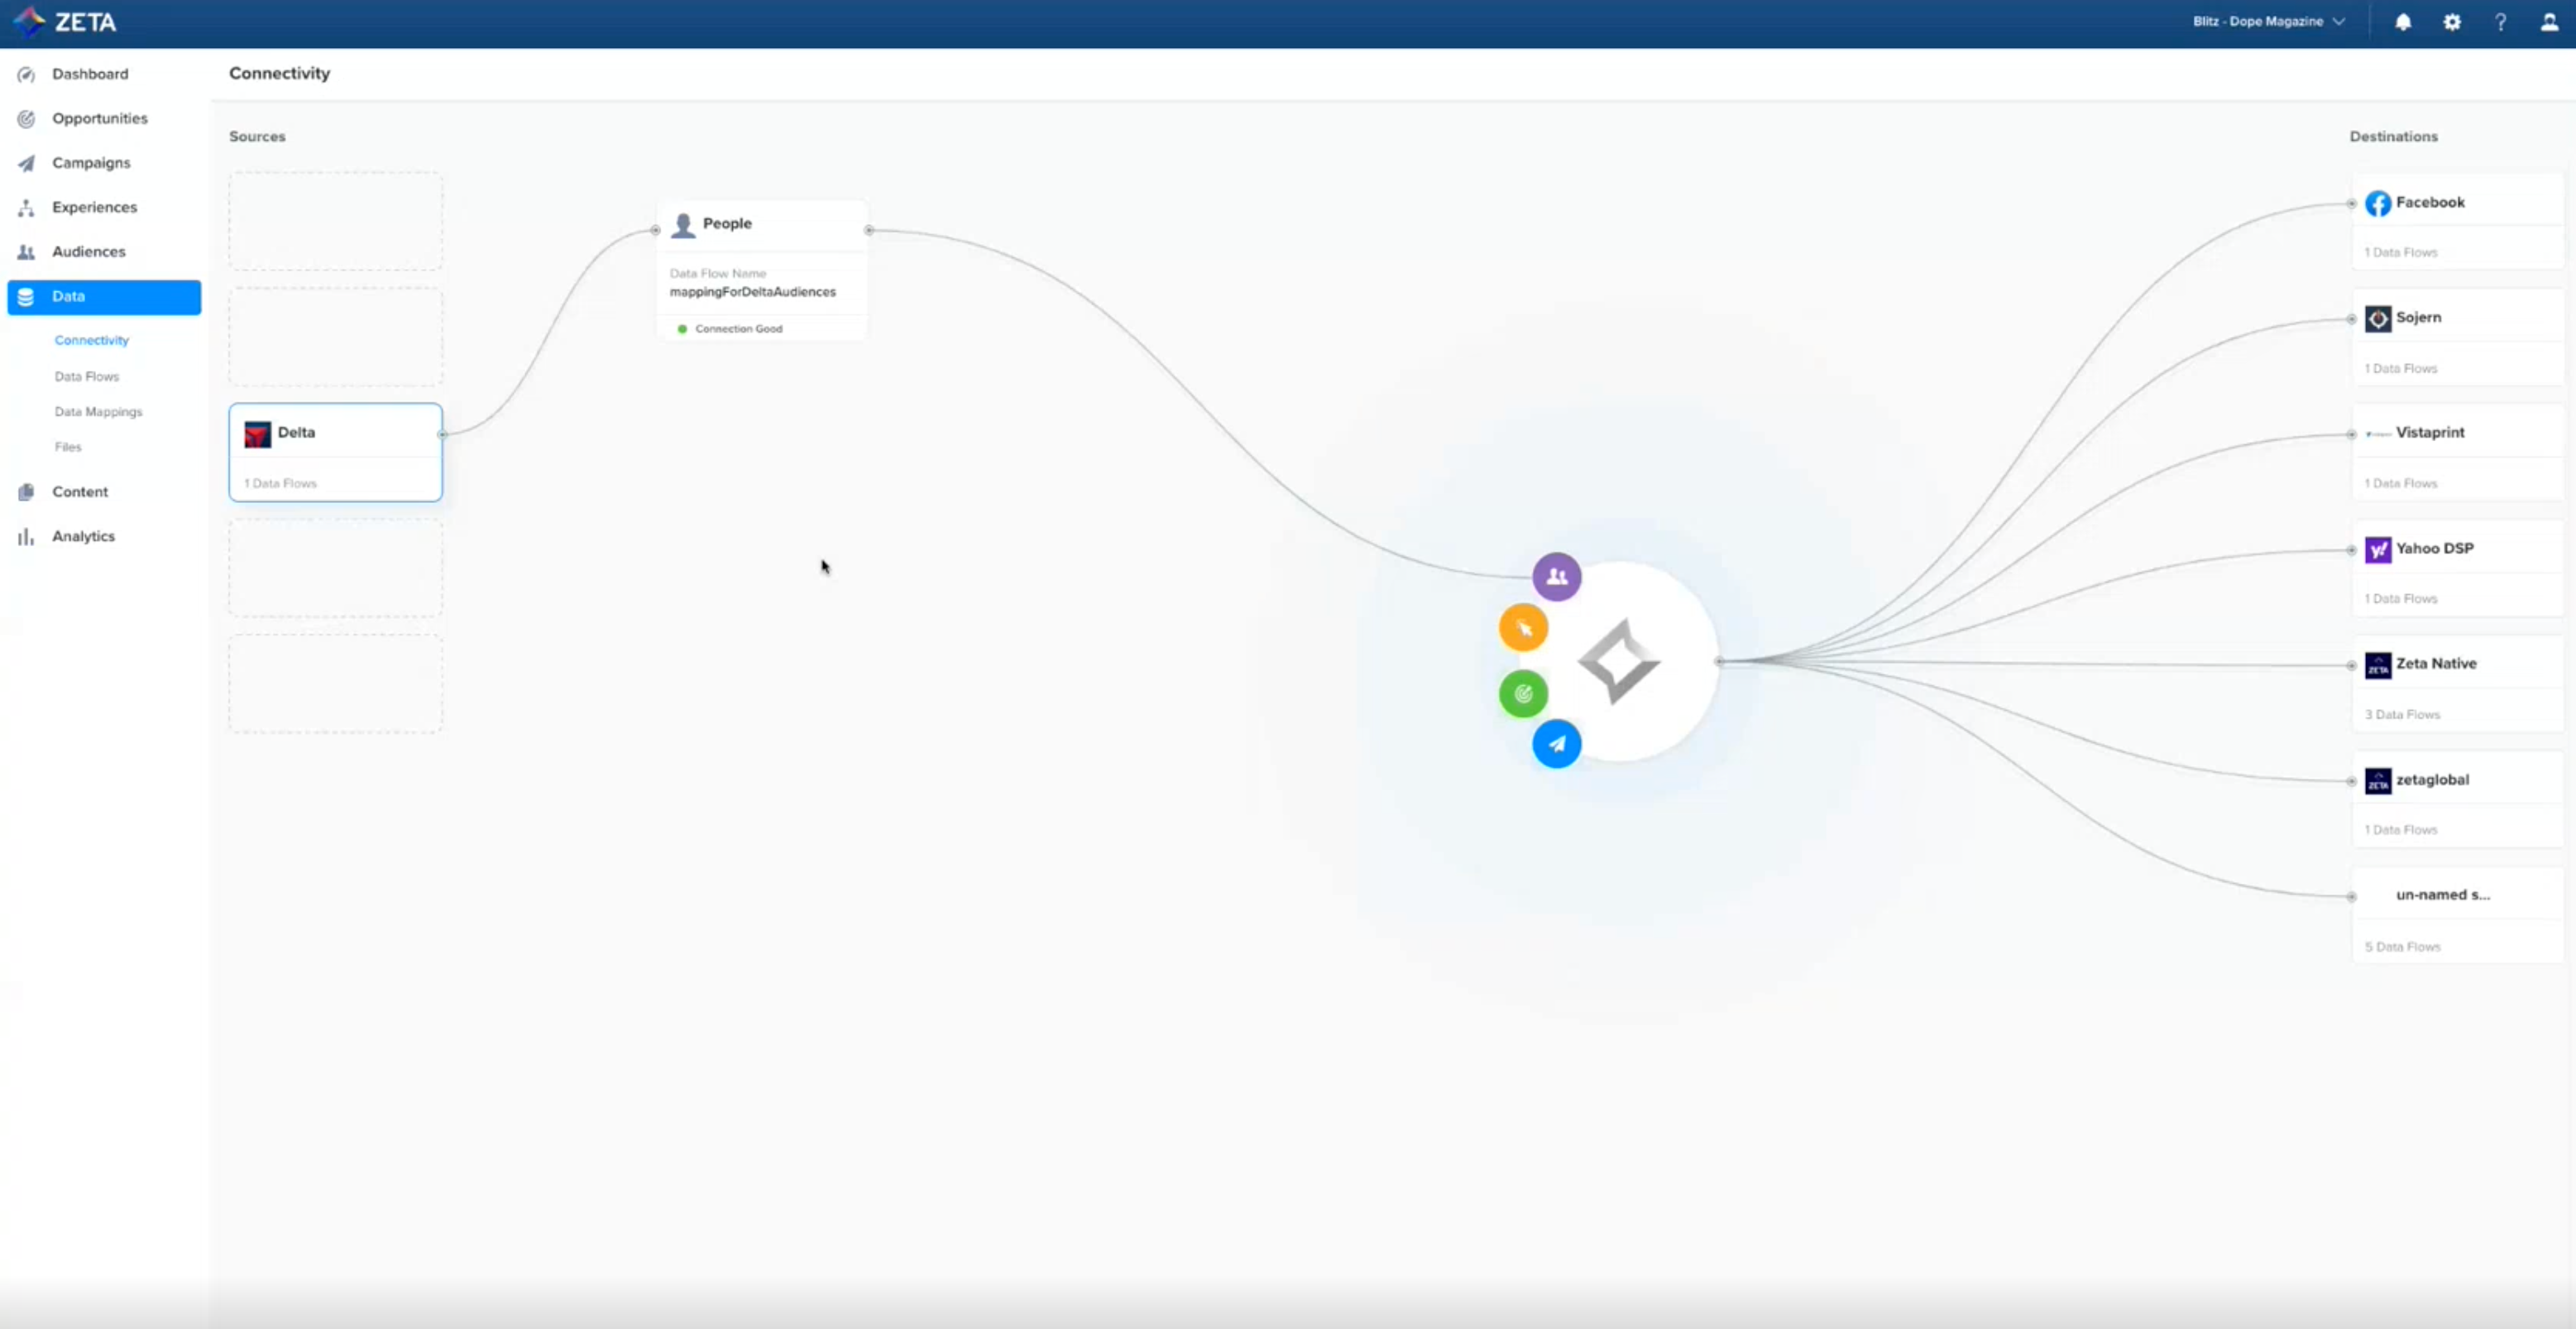
-20230503-073332.gif?inst-v=403c697a-5dae-4ce6-a0cd-6e81686fe8e7)
2. Data Flows
Select the company name and logo representing your vendor in the connection used in the Data Flow.
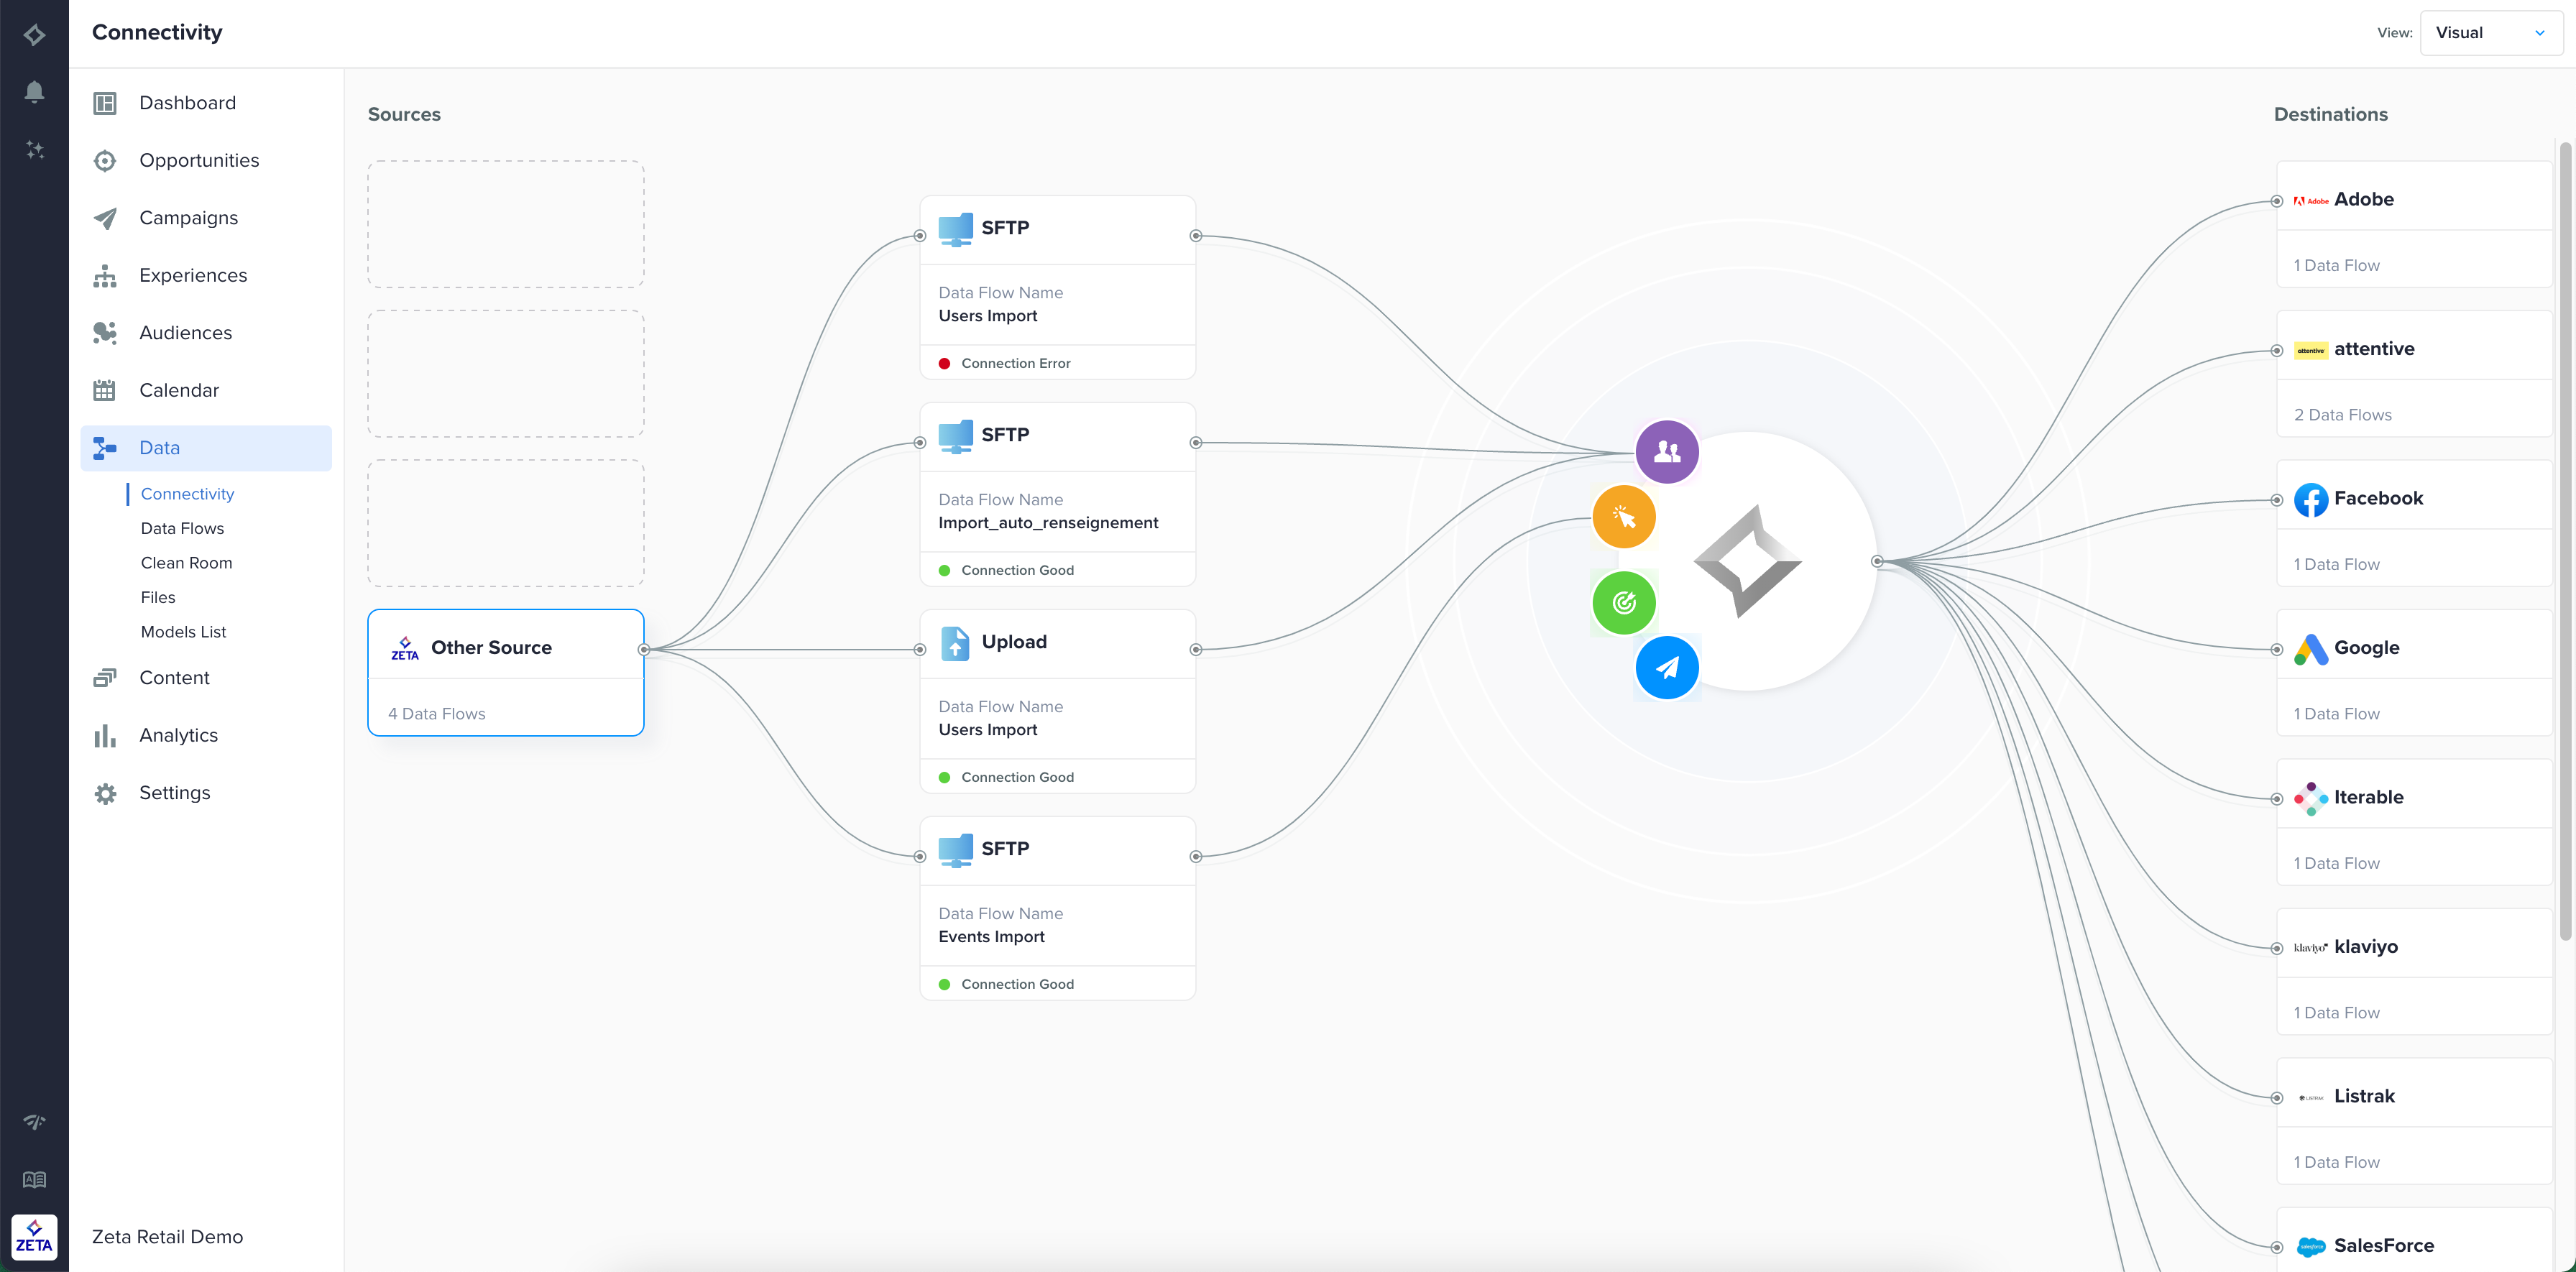
You can check the established connection of the data flows in 2 ways:
Data > Data Flows
-20231107-103551.gif?inst-v=403c697a-5dae-4ce6-a0cd-6e81686fe8e7)
Settings > Connections
-20231107-103846.gif?inst-v=403c697a-5dae-4ce6-a0cd-6e81686fe8e7)
3. APIs
Select the company name and logo representing your source vendor in the API connection as shown below.
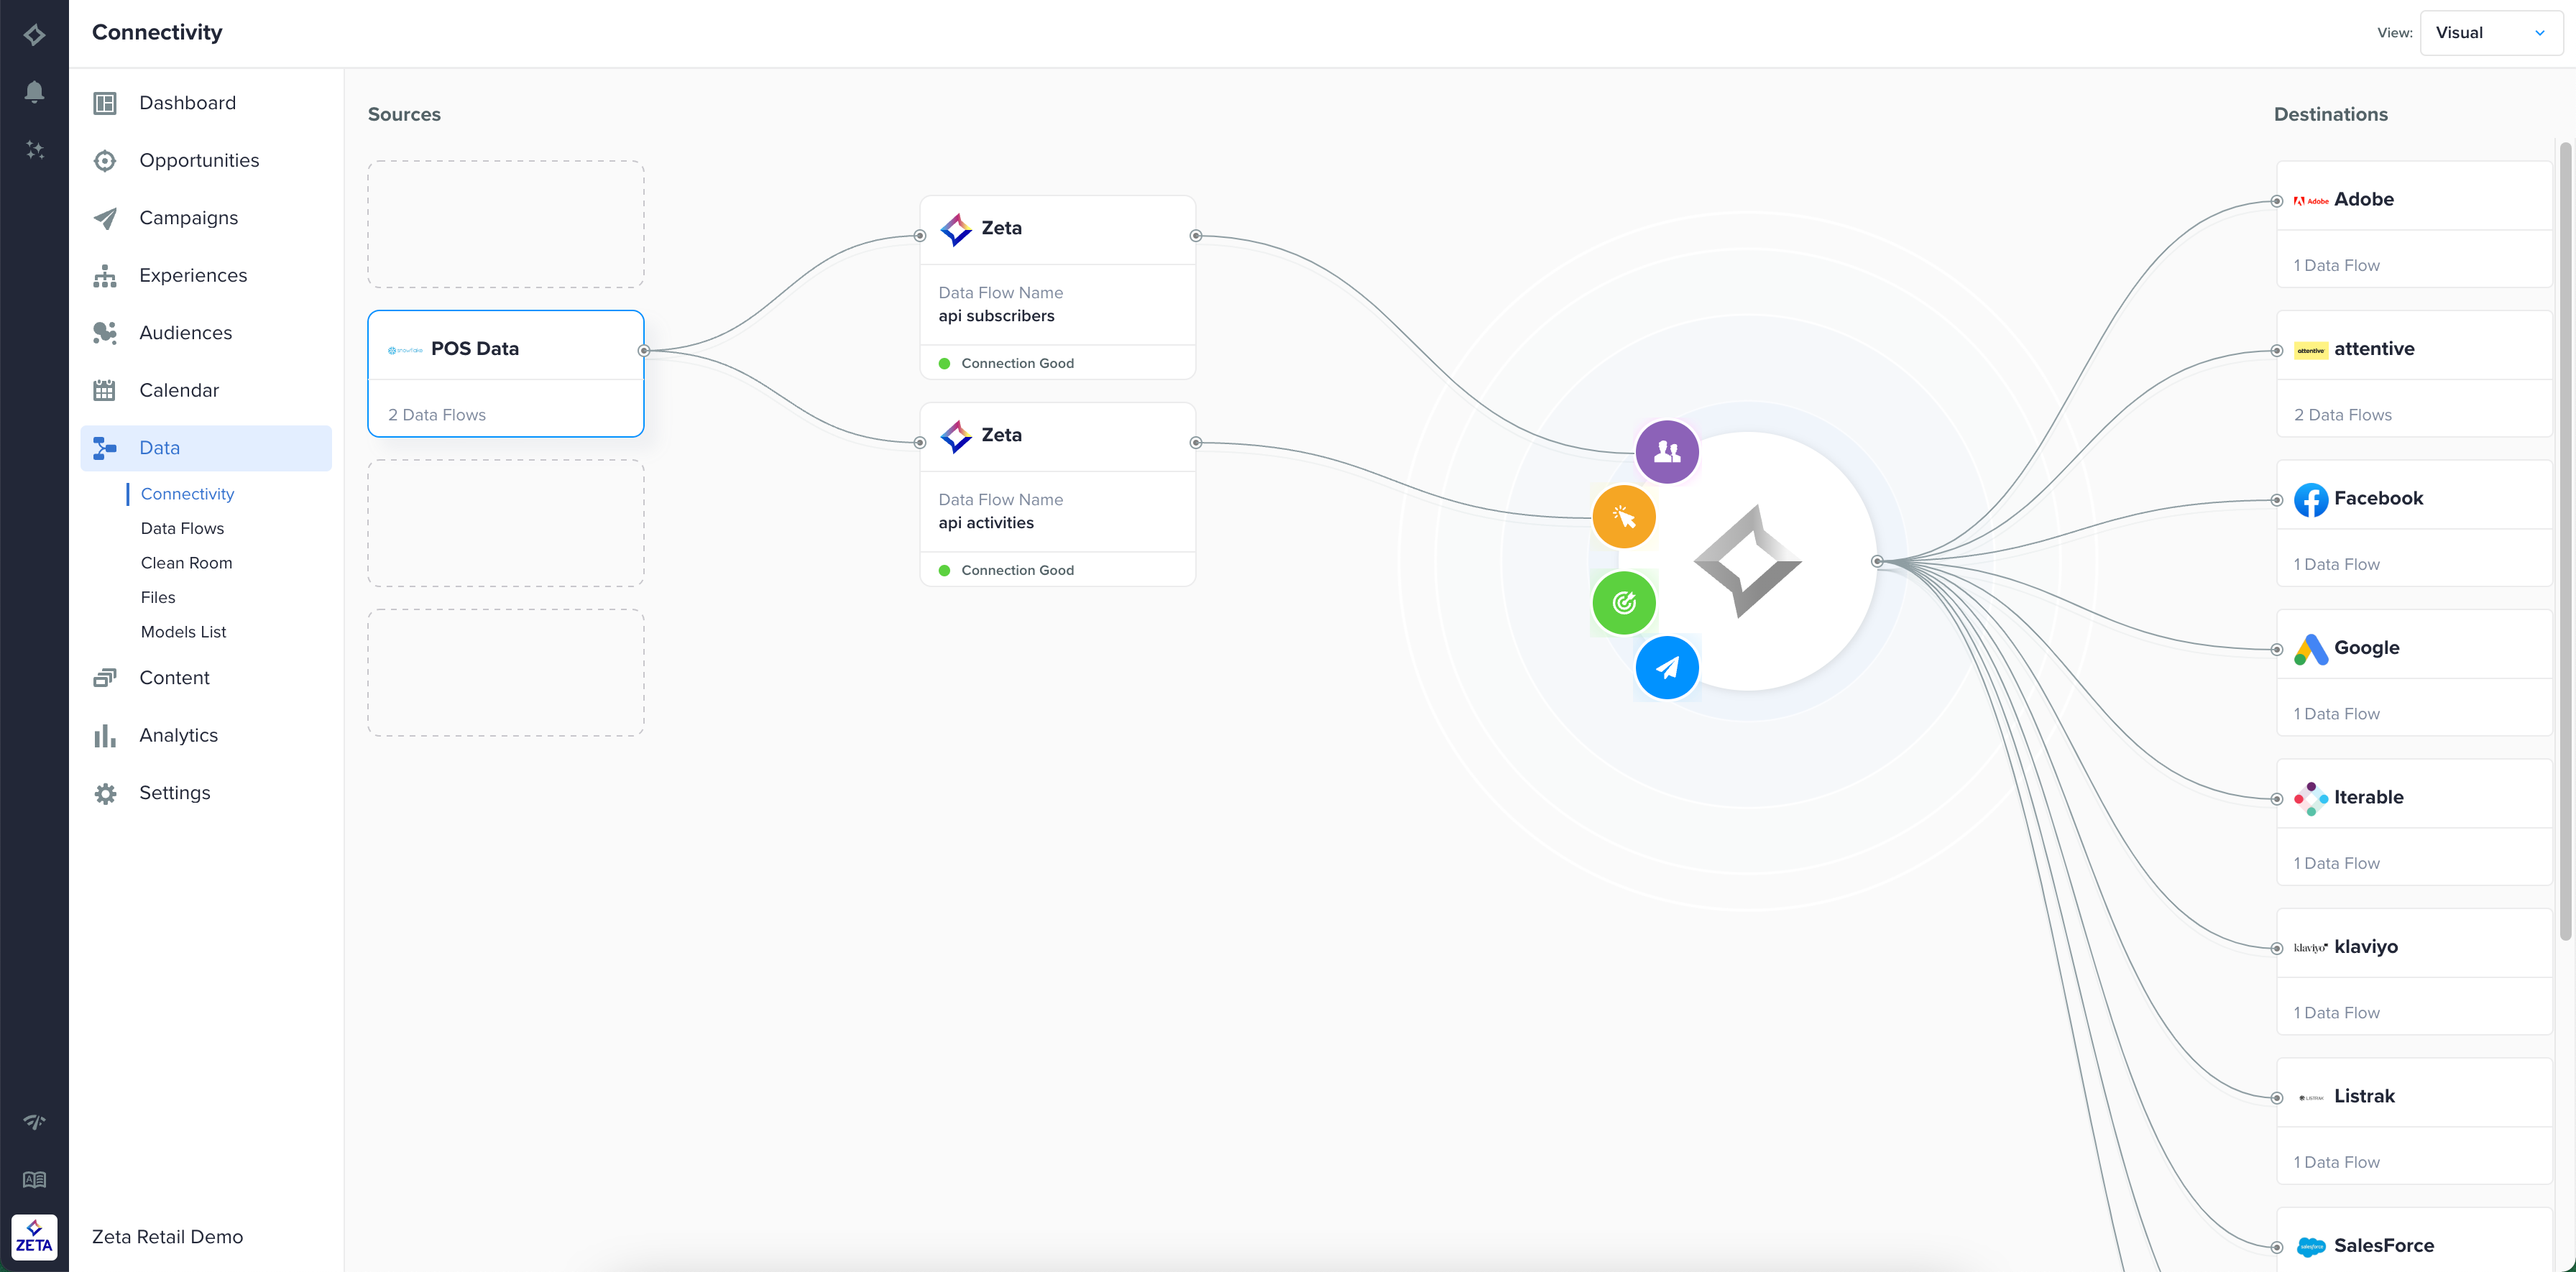
-20230503-115734.gif?inst-v=403c697a-5dae-4ce6-a0cd-6e81686fe8e7)
4. Website Tags
Website Tags that are active in your account can be conveniently viewable in the Visual diagram as shown below:
5. File Imports
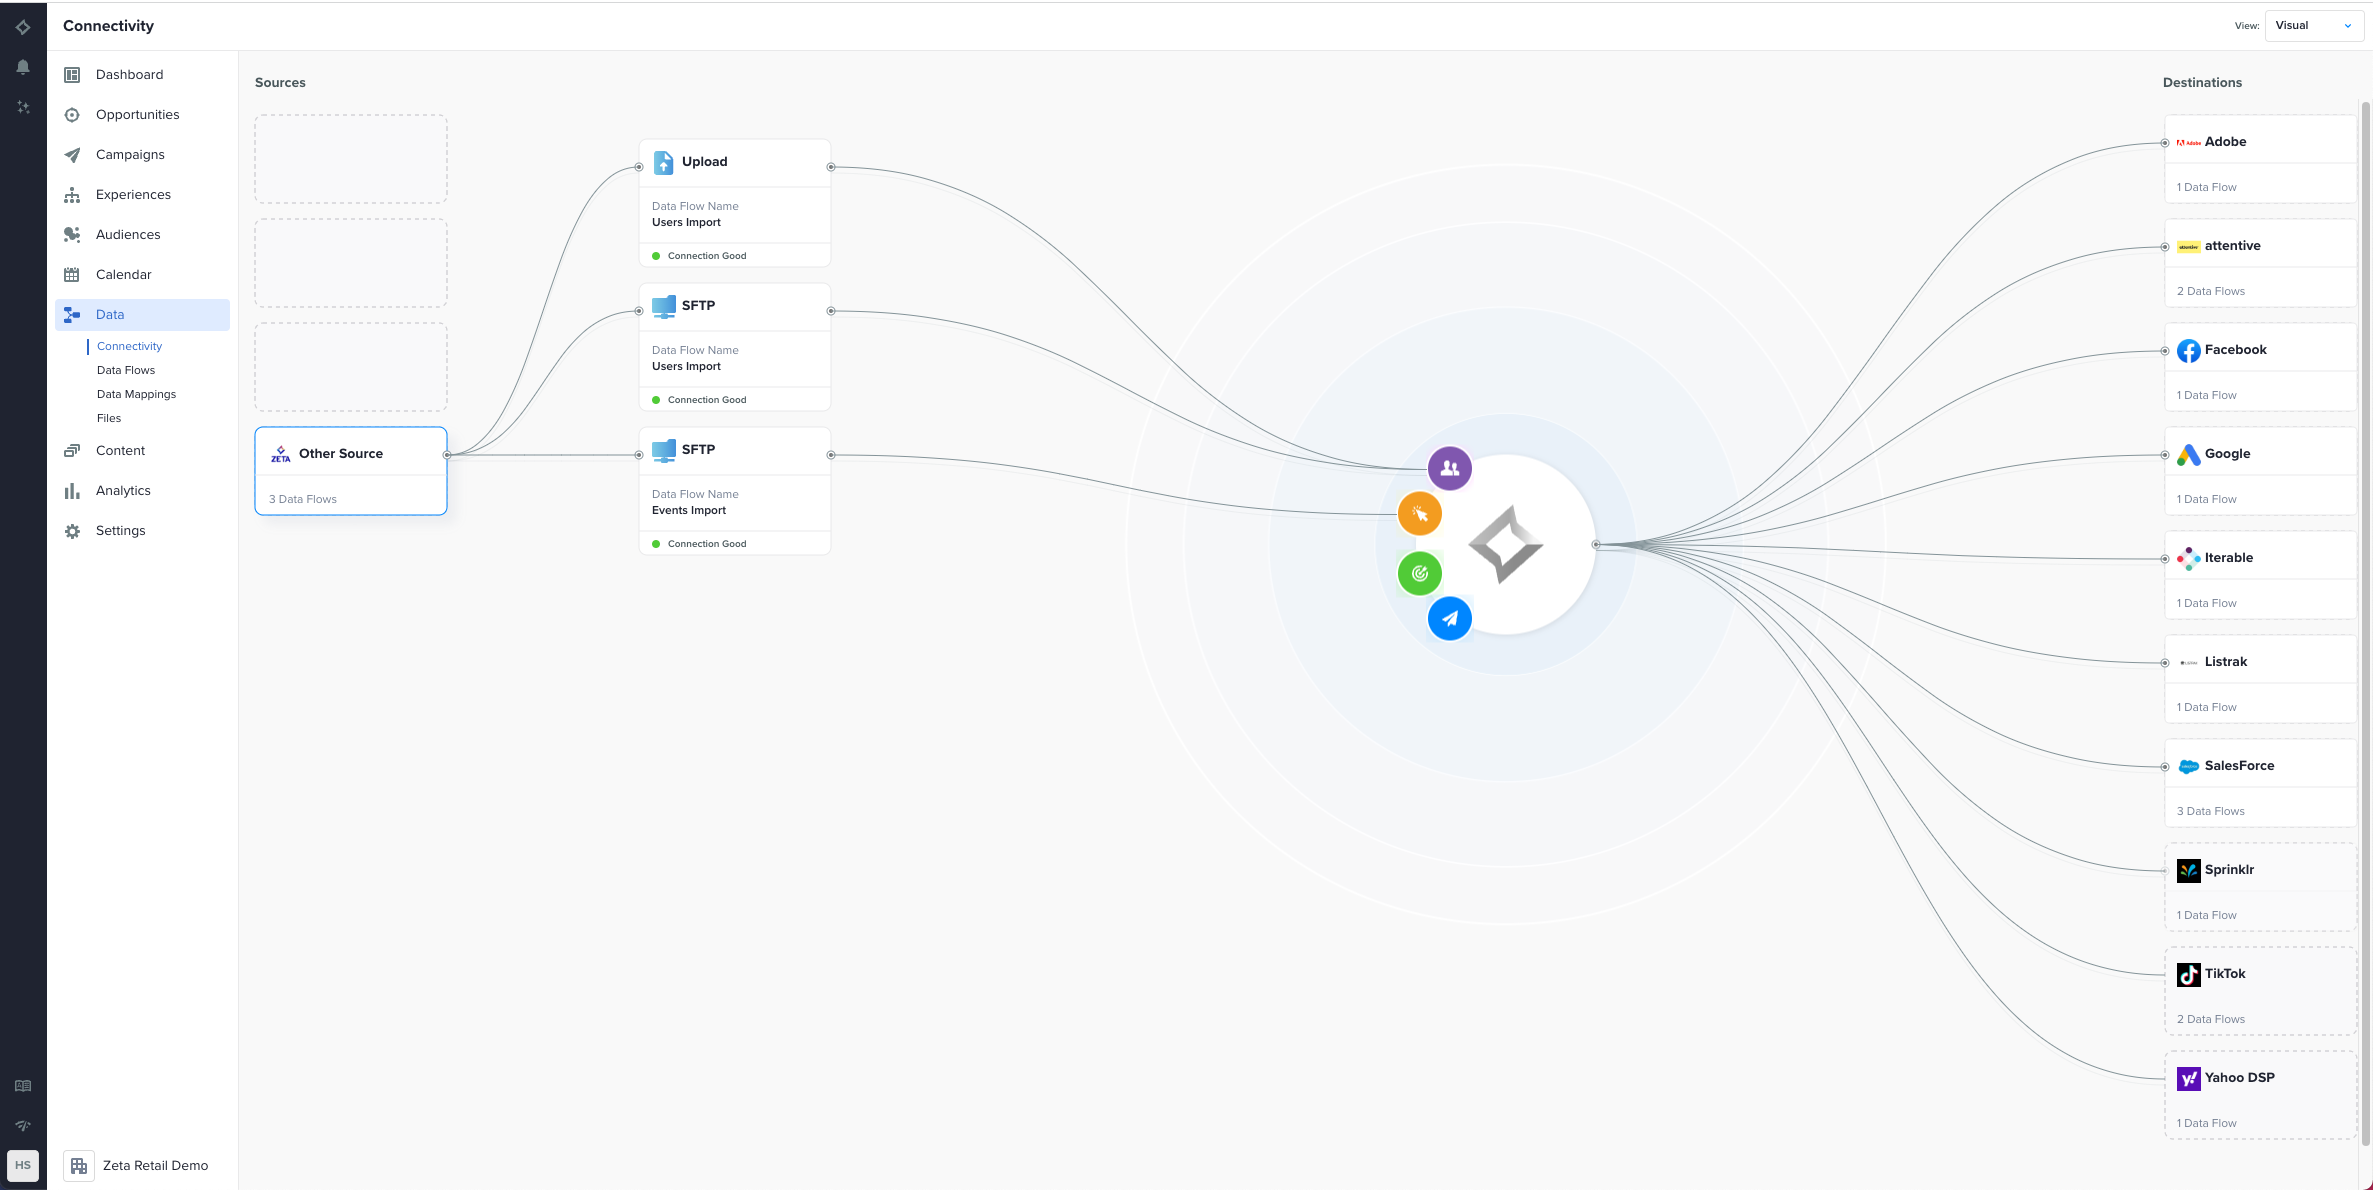
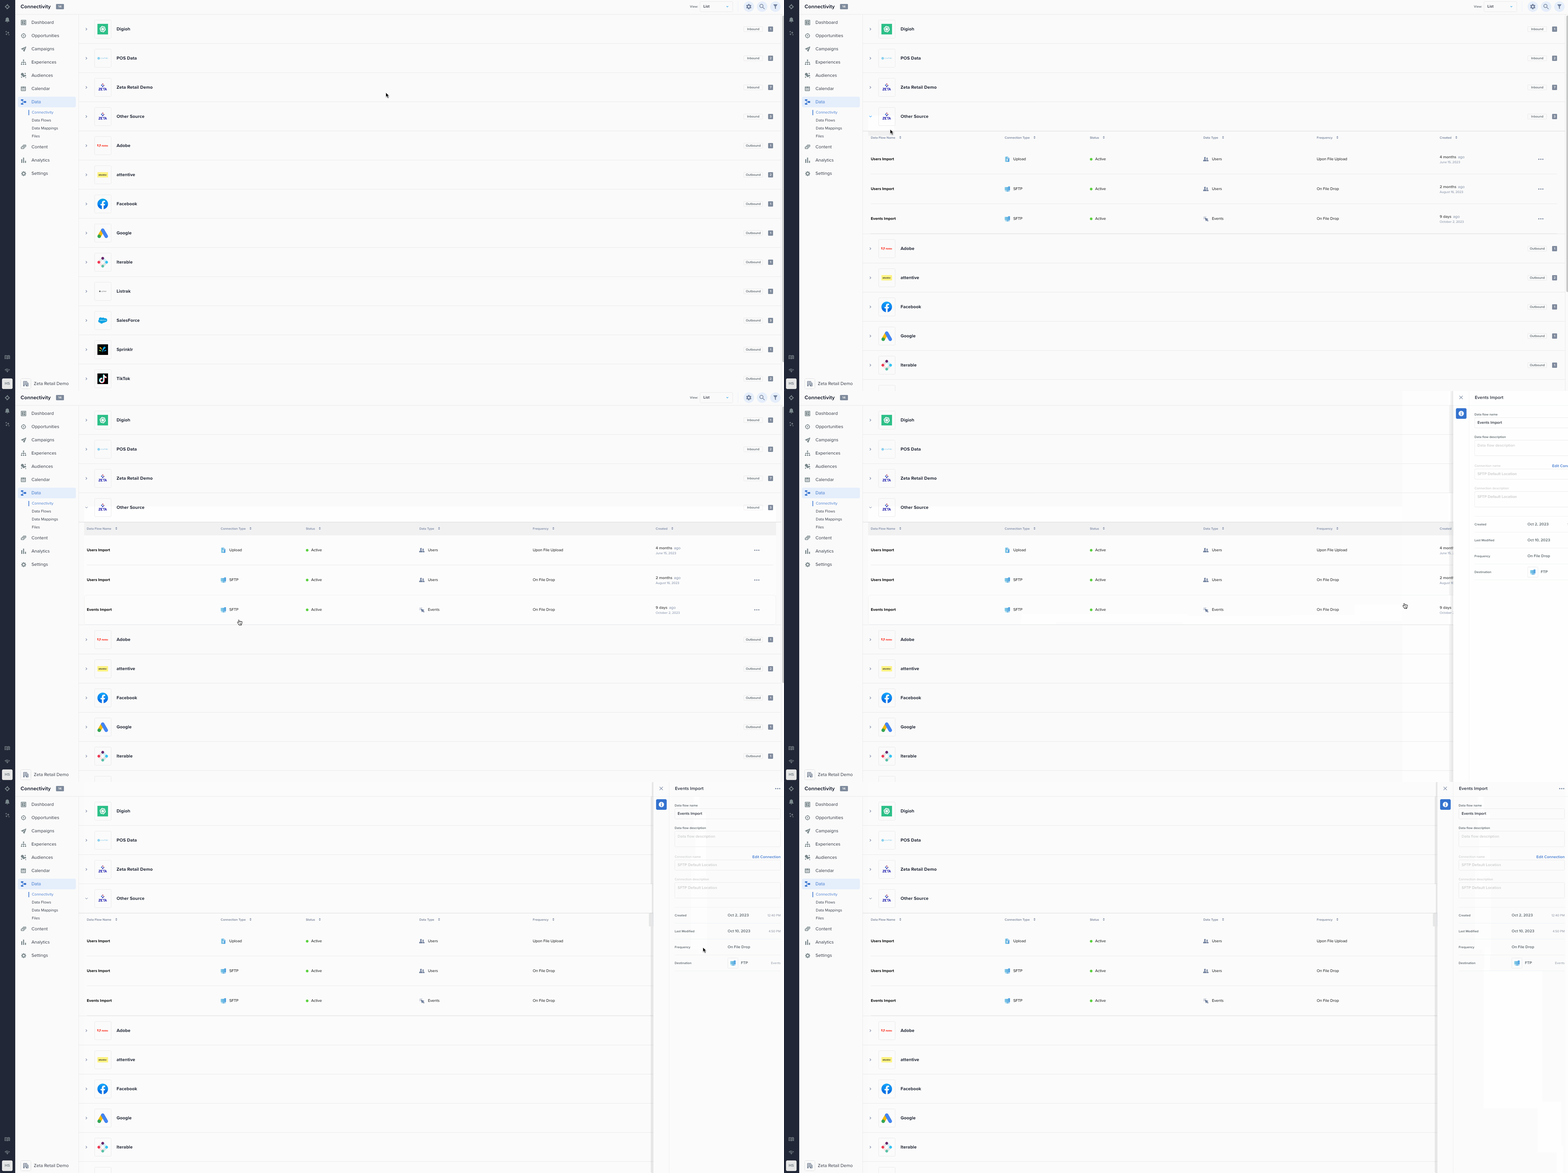
File Imports that occur using the ‘Import File’ button under Data>Files are now visible in the ‘Visual’ view as well as the ‘List’ view. The data types that are shown in these views are Users and Resources.
In addition, file imports that happen outside the platform through the ZMP account’s SFTP location are also displayed in the ‘Visual’ as well as ‘List’ view. The data types that are shown in these views are Users, Events, and Resources.
Visual view | ||
|---|---|---|
Description | A card will be displayed for each unique (data type, import style) pair signifying a representation of all imports that have happened of these types. In essence, an account will see a maximum of 5 cards - (Users, ‘Import File’), (Resources, ‘Import File’), (Users, SFTP upload), (Resources, SFTP upload), and (Events, SFTP upload). | |
Connection Status on each card | The connection status on the card is a Logical AND of the last 5 imports that occurred for that data type and import style. A logical AND of at most five | |
|
| |
|
| |
 | ||
List View | ||
|---|---|---|
Description | Each row will be represented for each of these 5 key-value pairs (data type, import style). | |
Column Names |
| |
Data Flow Name |
| |
Connection Type |
| |
Frequency |
| |
Created | The oldest | |
Side Panel |
|
|
| ||
|
| |
|
| |
| The oldest | |
| The newest | |
|
| |
|
| |
 | ||
Outbound Side
What’s shown on the Outbound Side
1. Native Channels: Email/SMS/Push
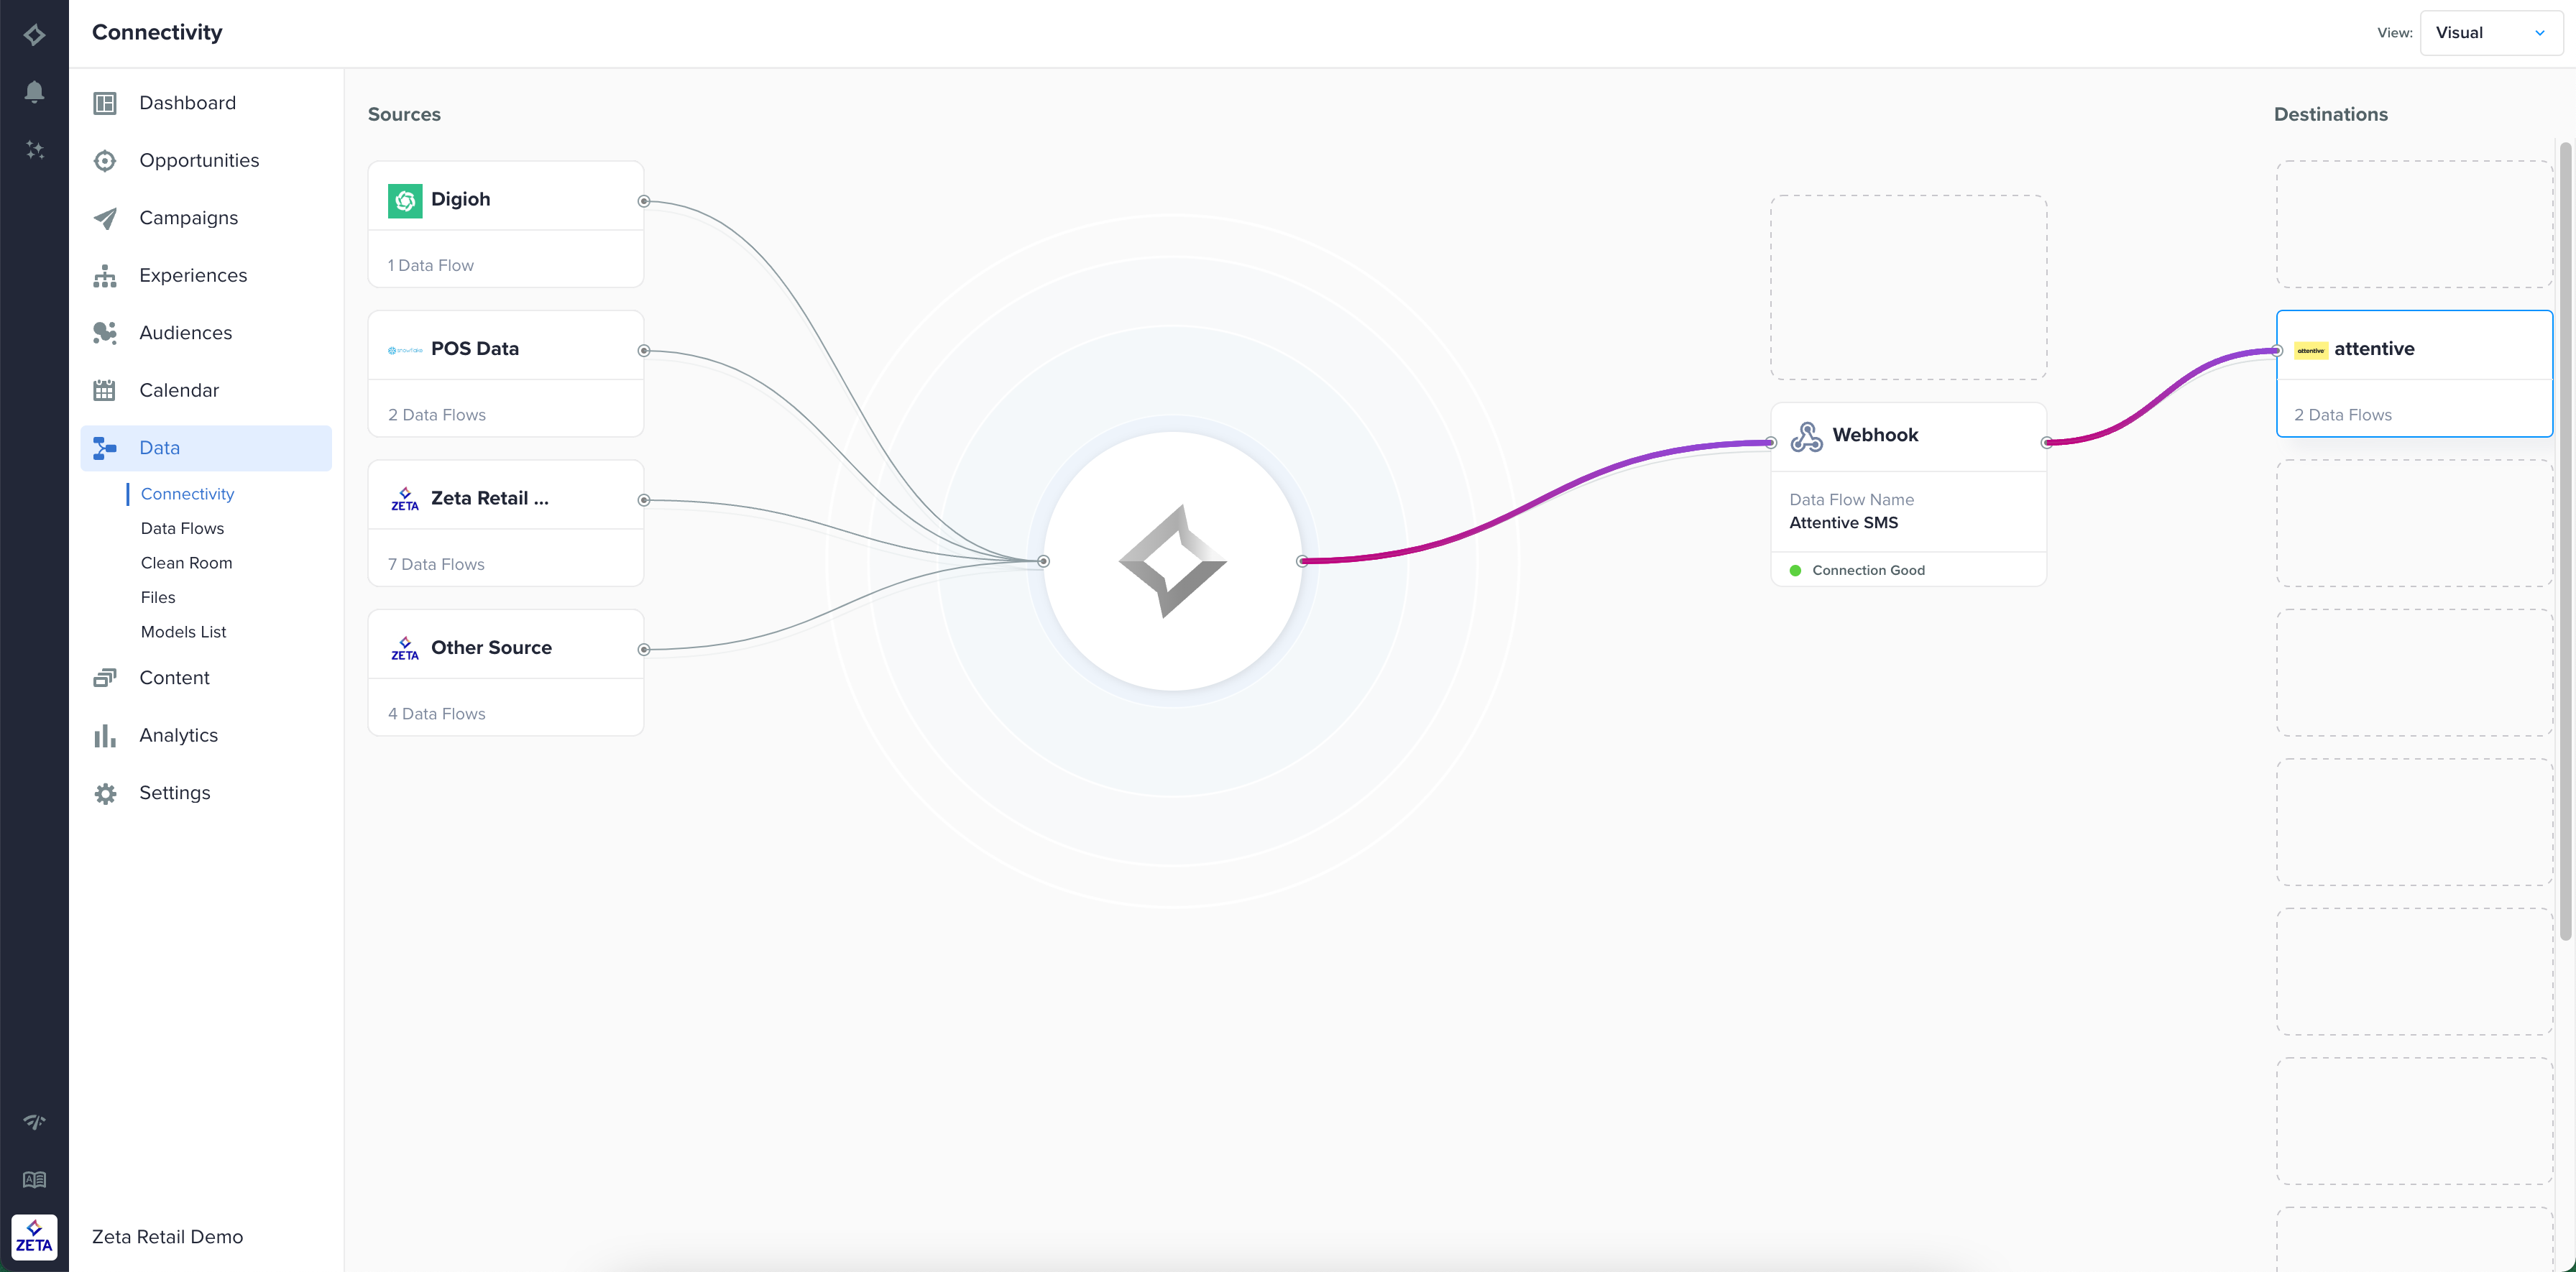
2. Third-party ad accounts: Facebook, Yahoo DSP
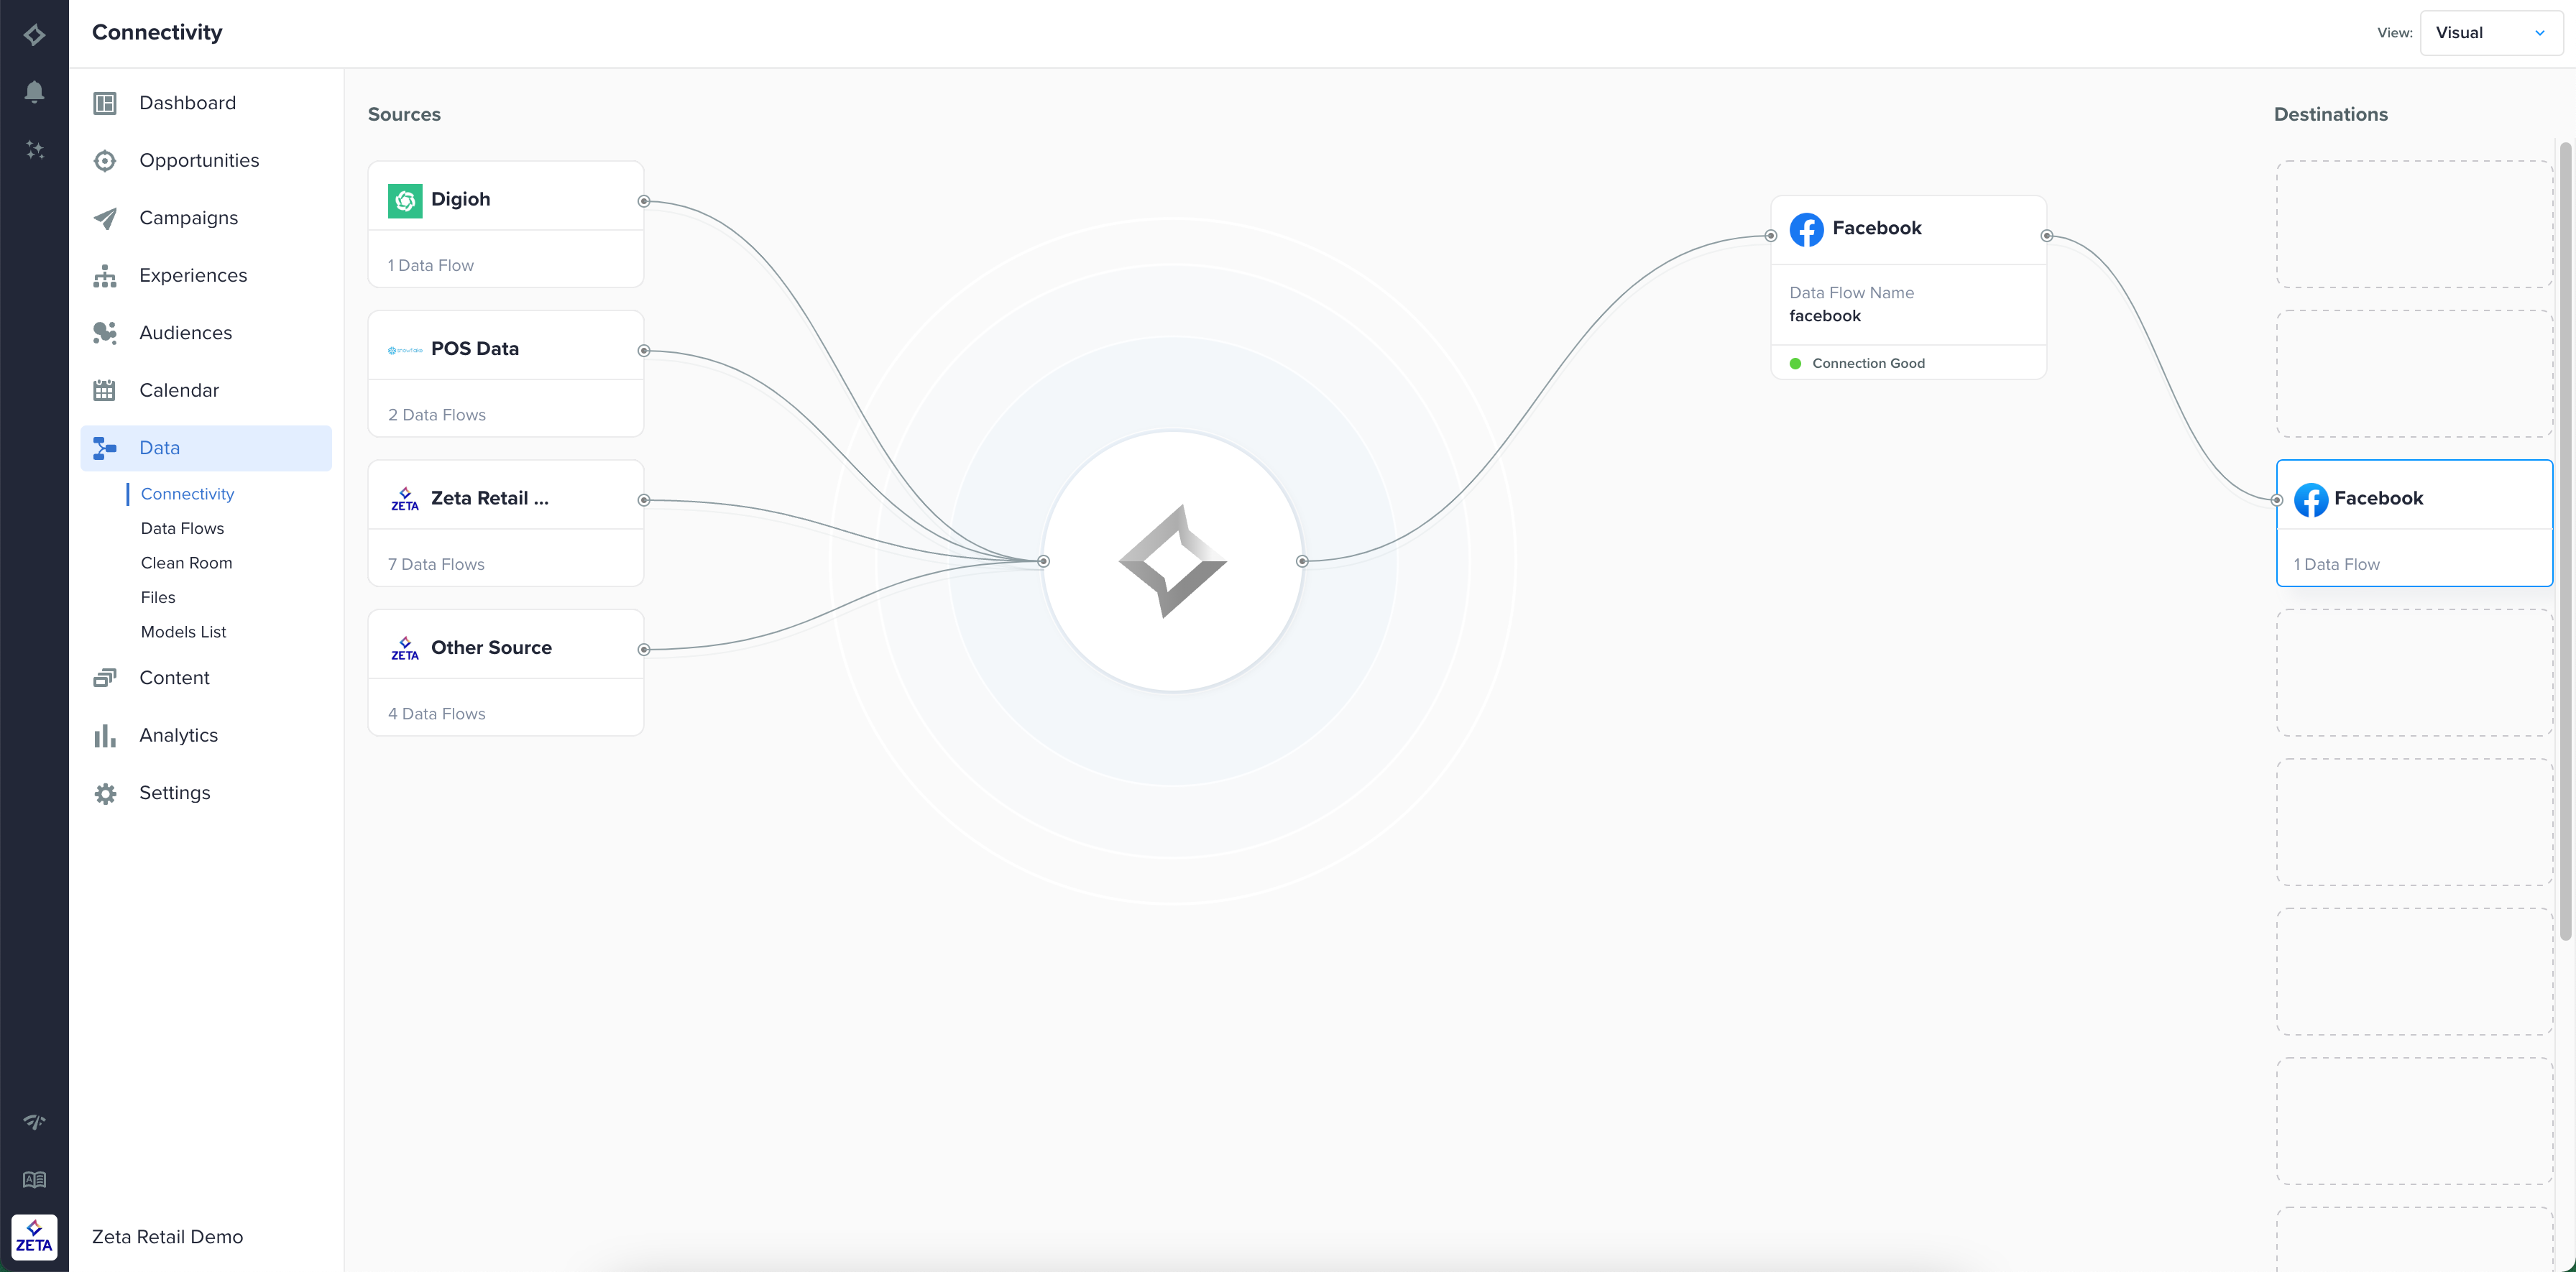
3. Channel Manager: Webhooks and File Channel
Select the company name and logo representing your vendor in your Channel Manager.
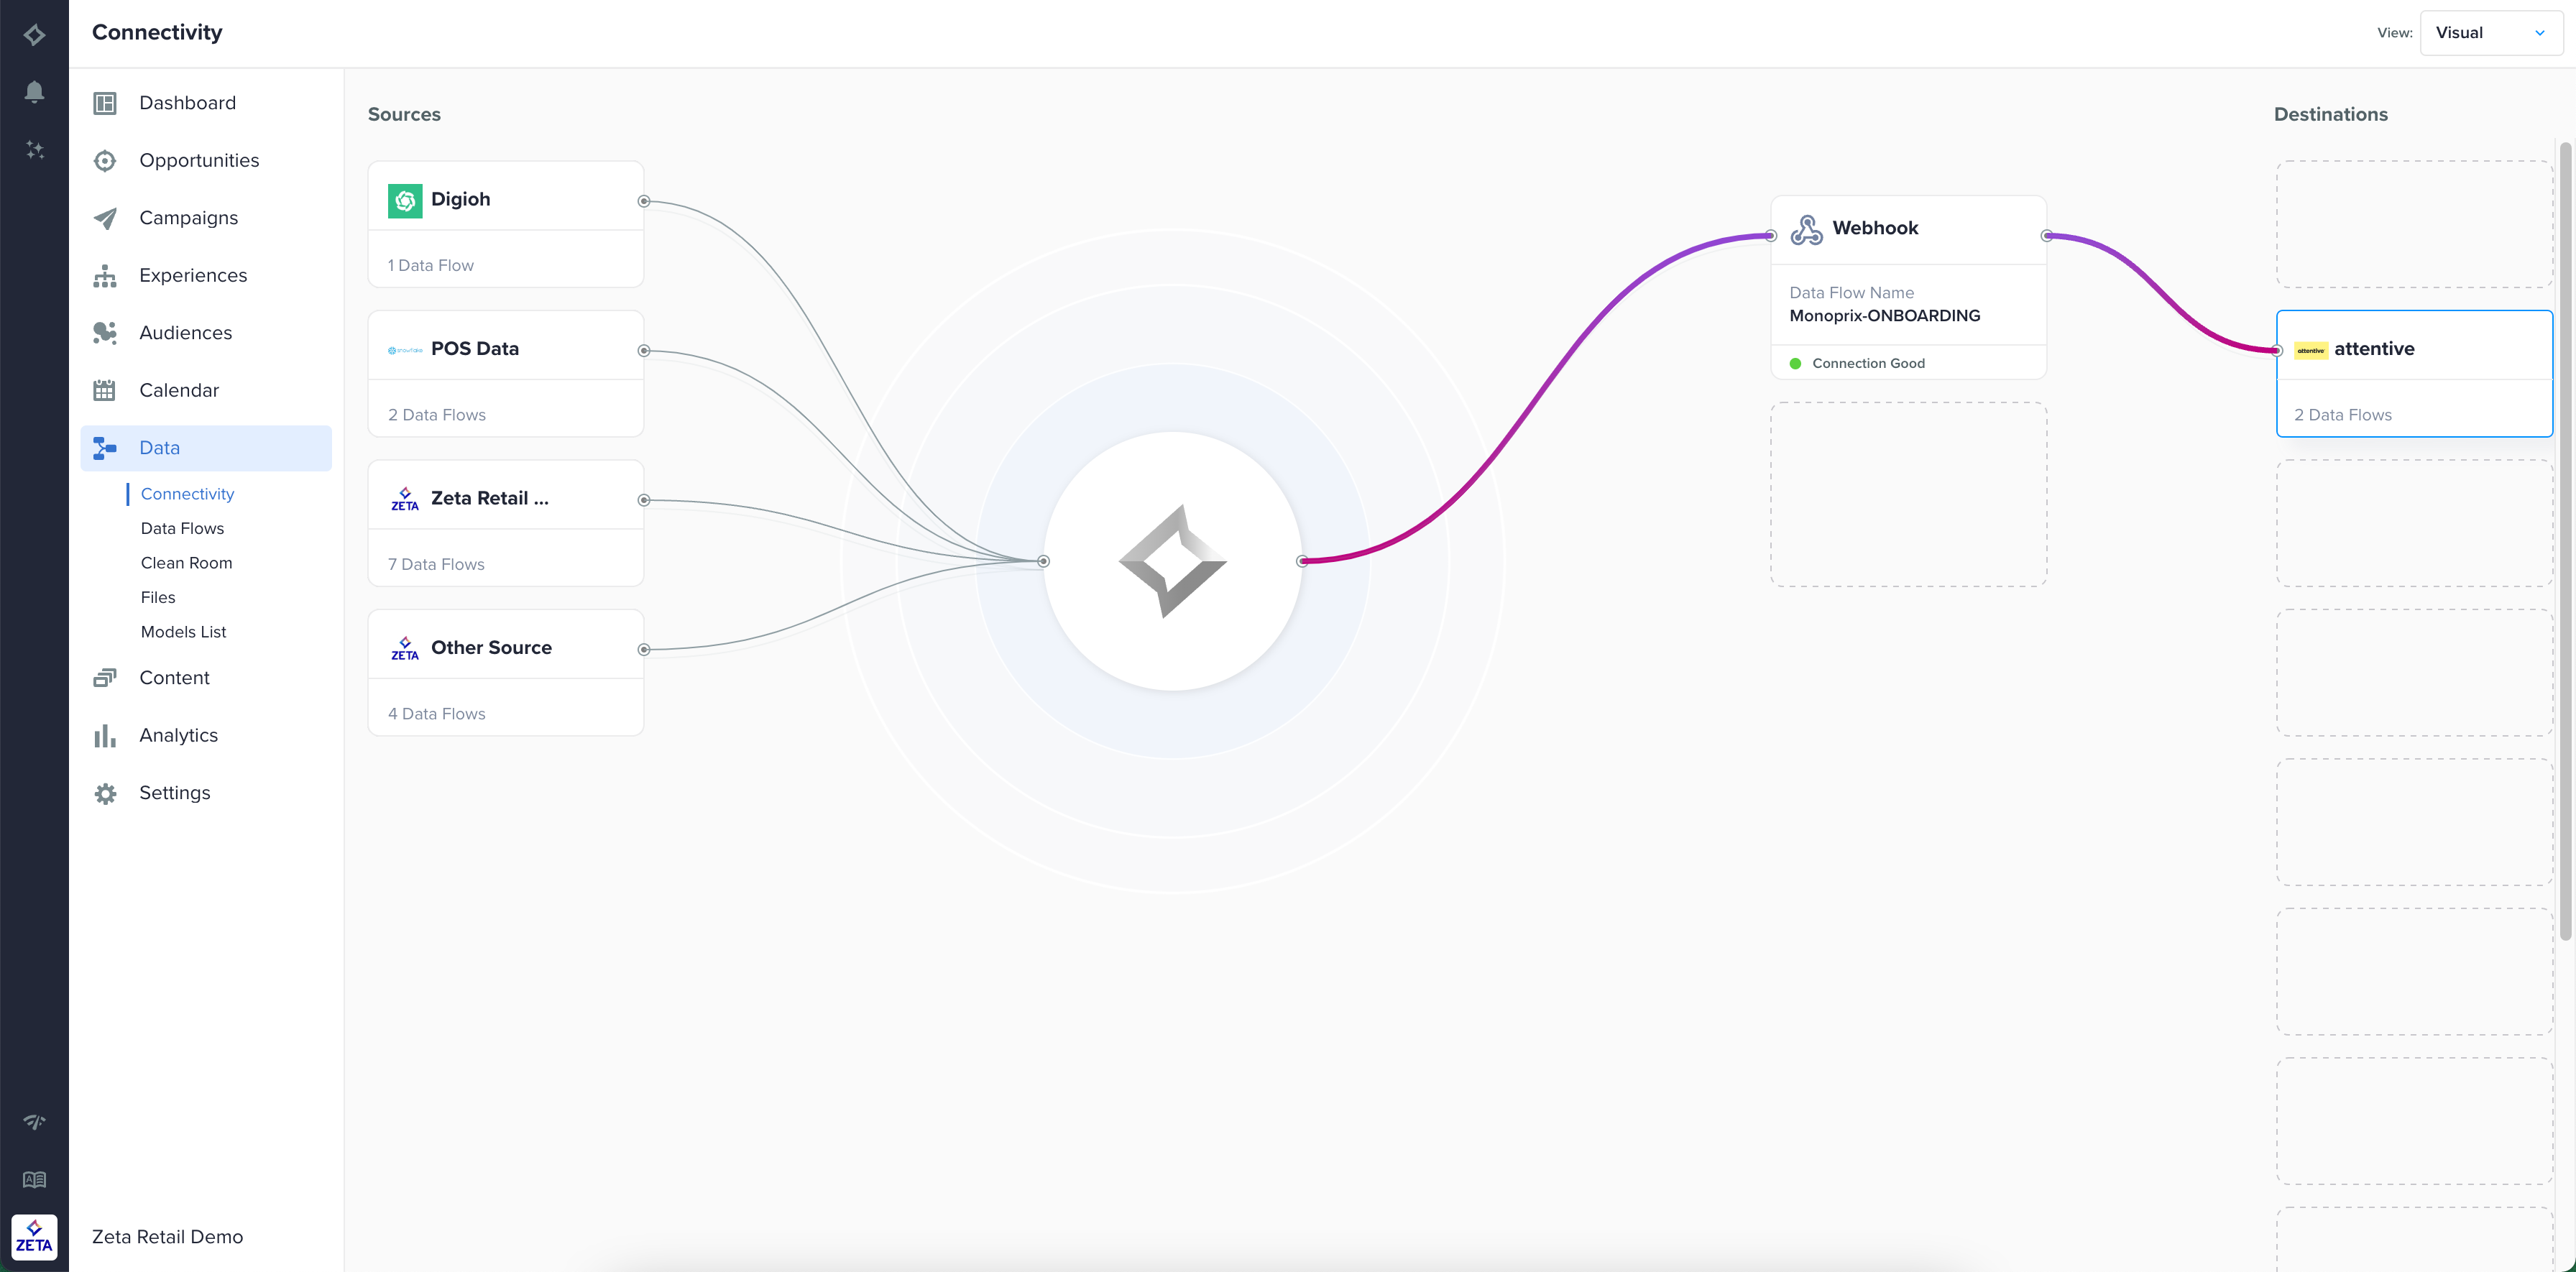
4. Data flows
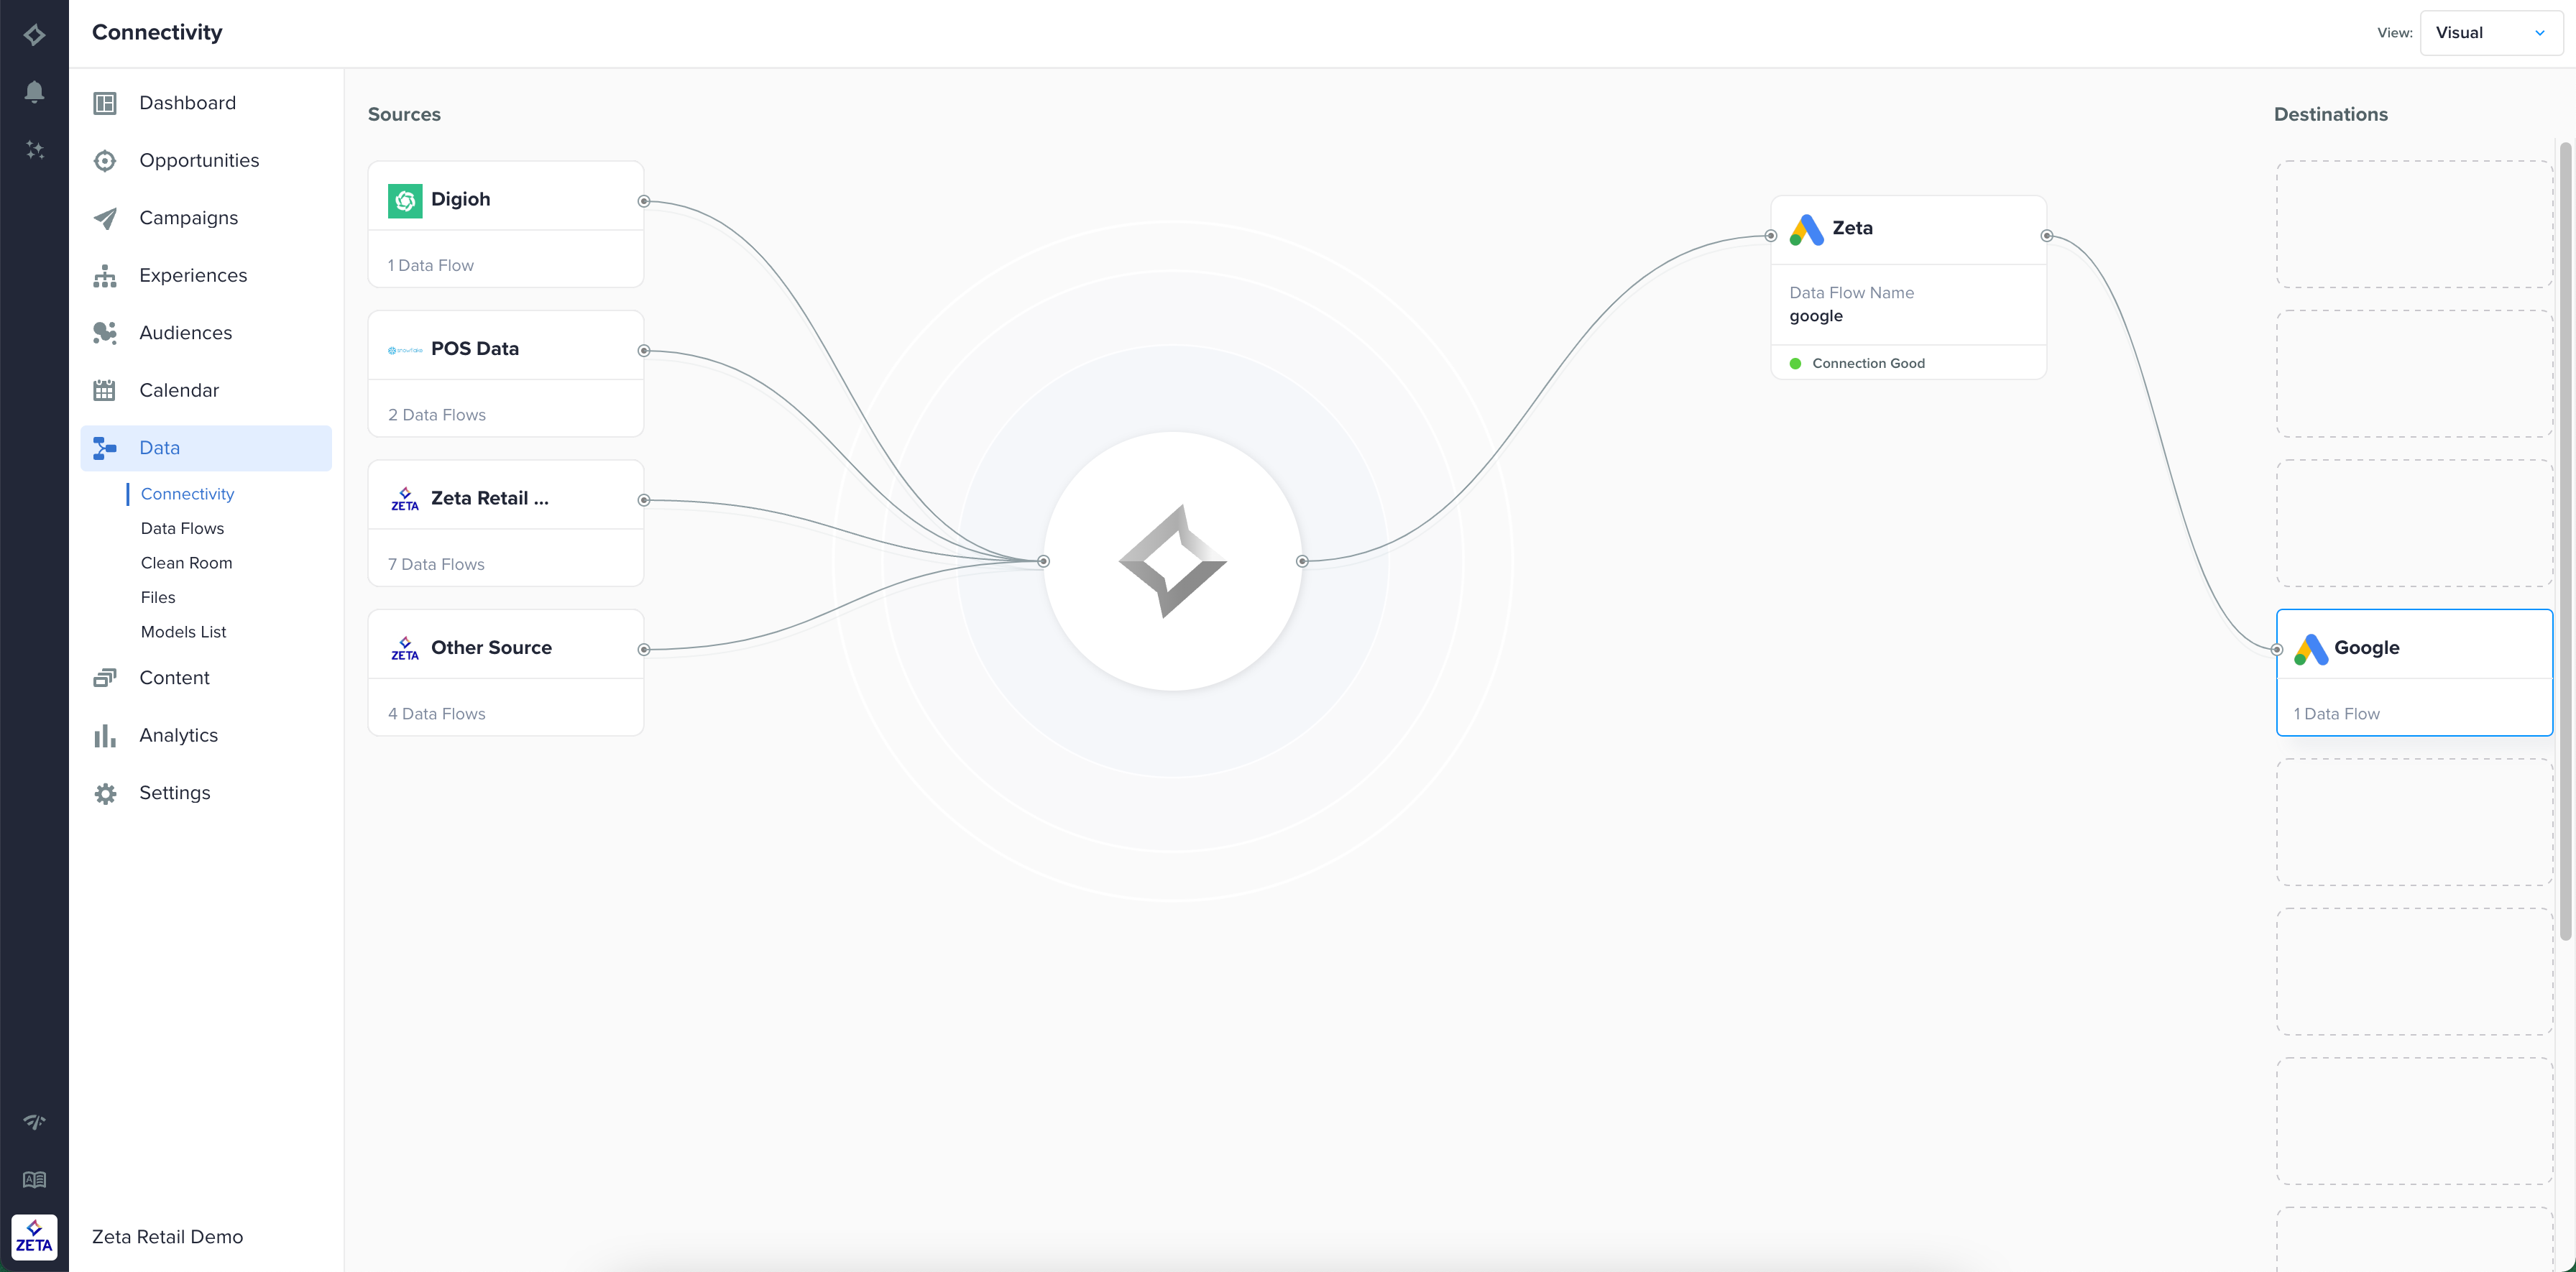
5. File Exports
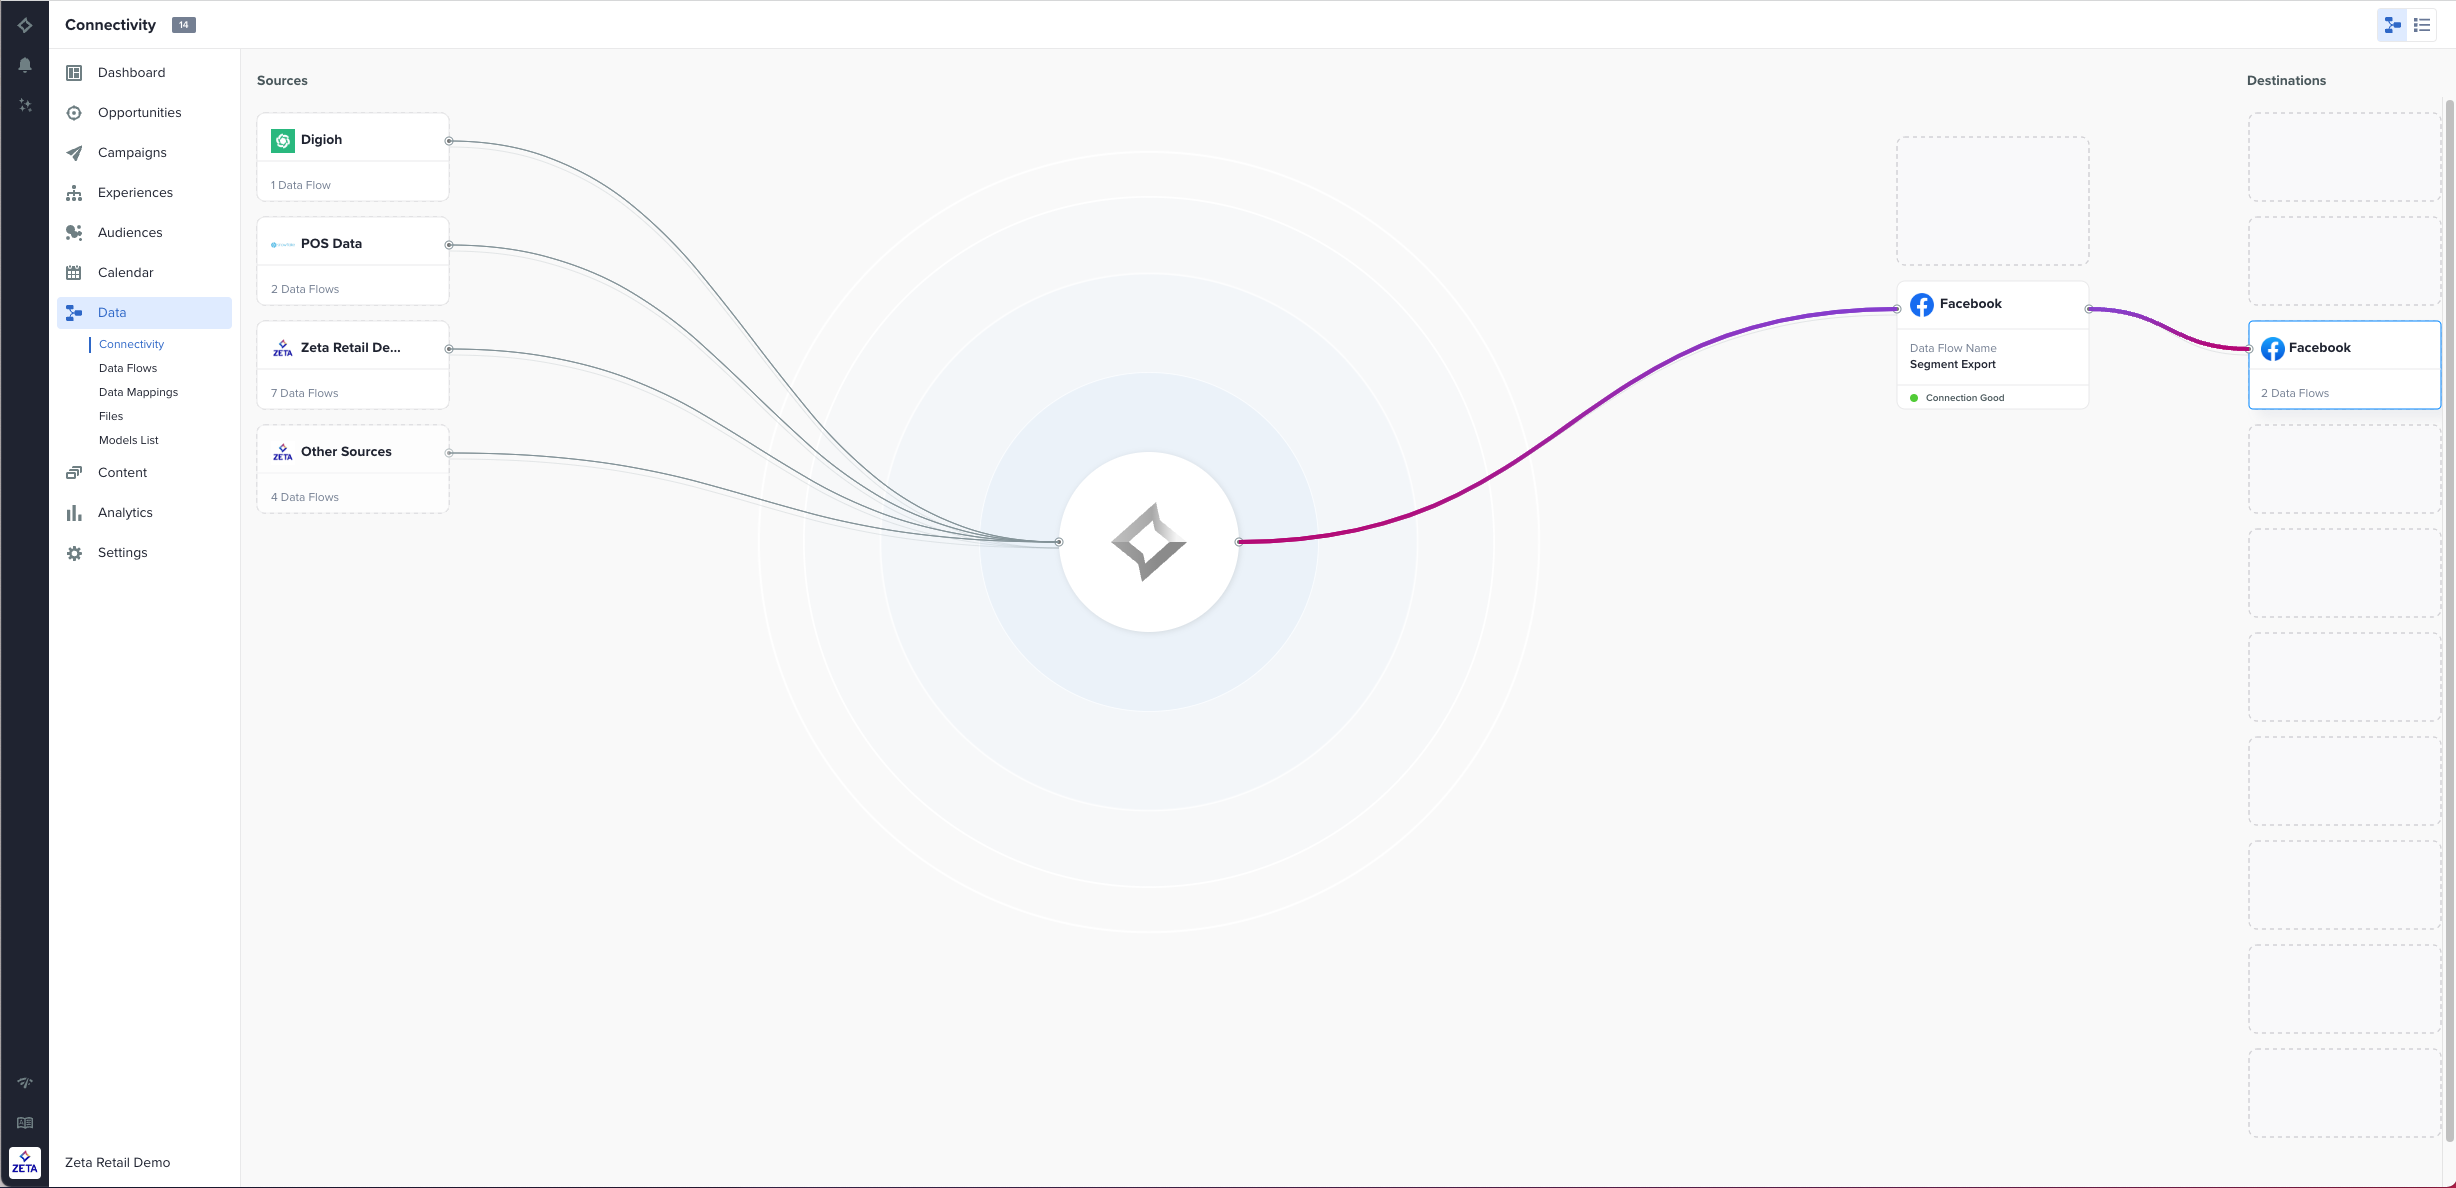
Audience exports that are triggered either manually or automatically in the platform are listed as row items under Data > Files > Exports tab. These exports can also be viewed visually under Data > Connectivity tab in both the “Visual” view as well as the “List” view as explained below.
Visual view | ||
|---|---|---|
Description | Each card positioned on the export side of the canvas, just before the destinations column, serves as a summary of all user/segment exports associated with that connection. In essence, these cards provide an aggregate view of all exports conducted on this specific connection. | |
Header | The header of the card represents the connection type that is receiving these exports. For example, Facebook, Amazon S3. | |
Data Flow Name (editable) | The Data Flow Name, editable from the List view, provides a handy way to name these aggregate exports. | |
Connection Status on each card | The connection status on the card is a Logical AND of the last 5 exports that occurred on that connection. A logical AND of at most five | |
|
| |
|
| |
 | ||
List view | ||
|---|---|---|
Description | A row is displayed for each of the cards in the visual view. | |
Column Names |
| |
Data Flow Name |
| |
Connection Type | The connection type where this export is being sent to, for example, Facebook or Amazon S3. | |
Created | The oldest | |
Side Panel |
|
|
| left empty by default | |
| The connection name this export is going to. To find more details on the Connection, click on the URL called | |
| The connection description that was set when the connection was created. To edit the description, click on the URL called | |
| User who sent the very first export to this connection | |
| The oldest | |
| The newest | |
|
| |
|
| |
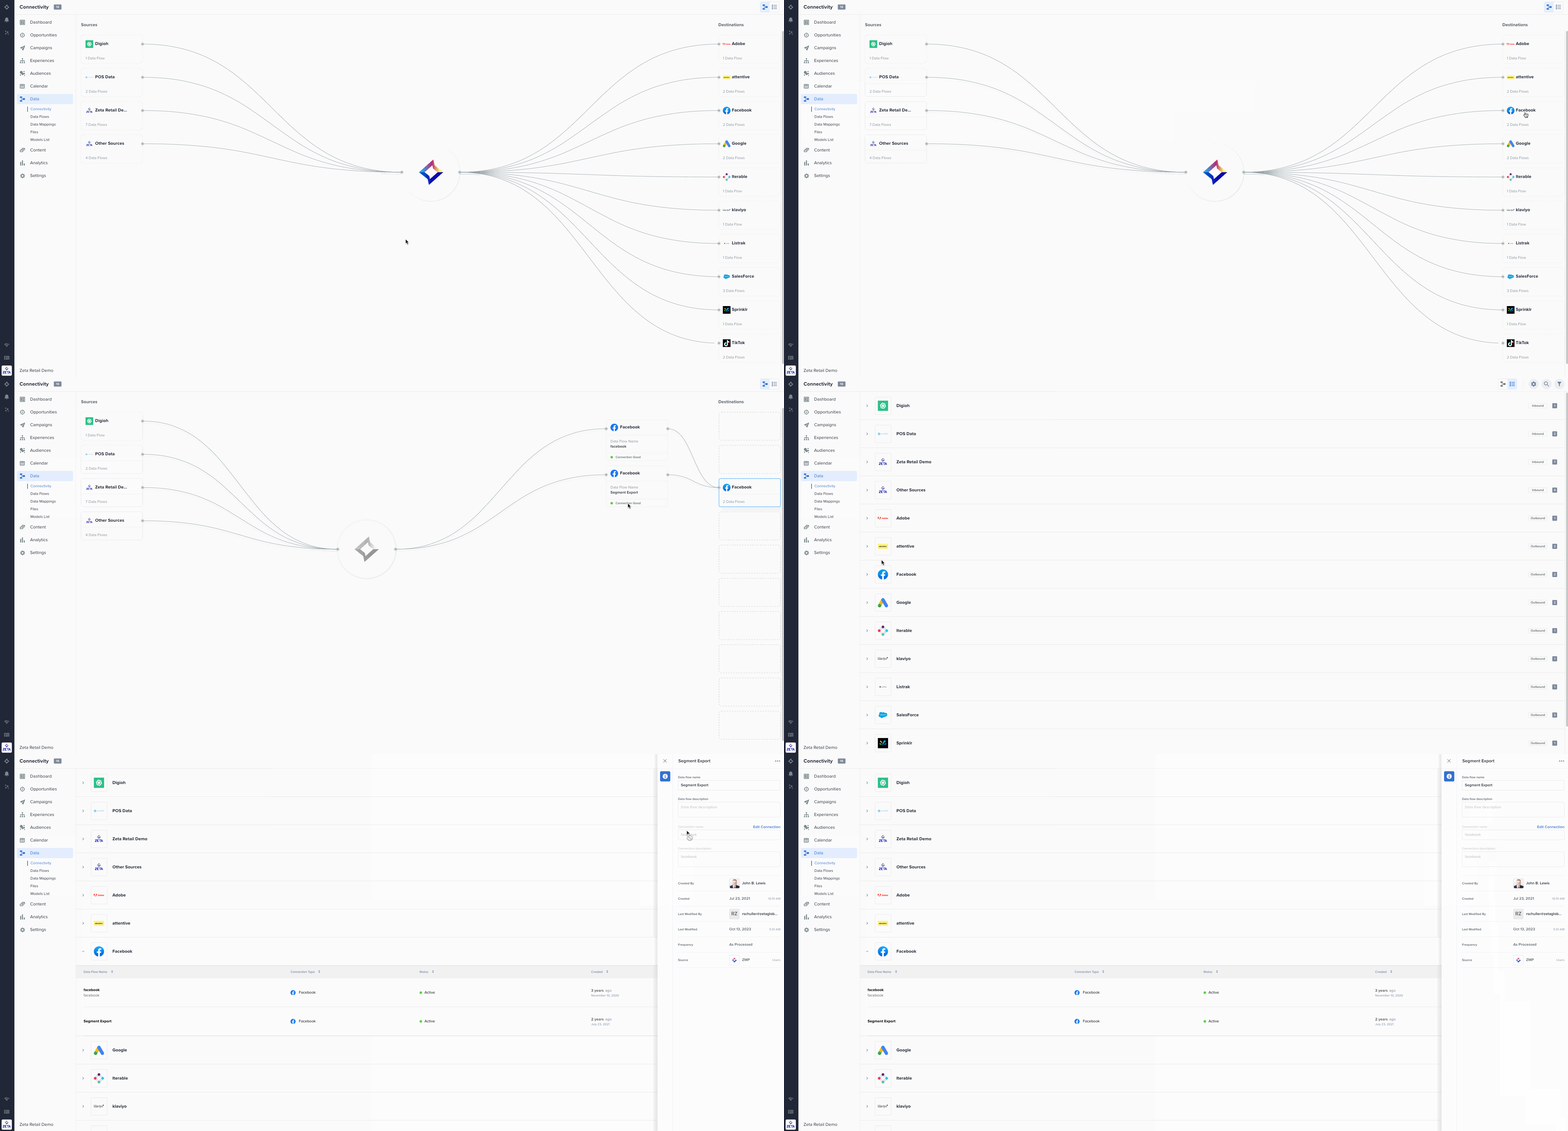 | ||
Table View
Navigate to View and select List from the dropdown to change the butterfly diagram into a List table.
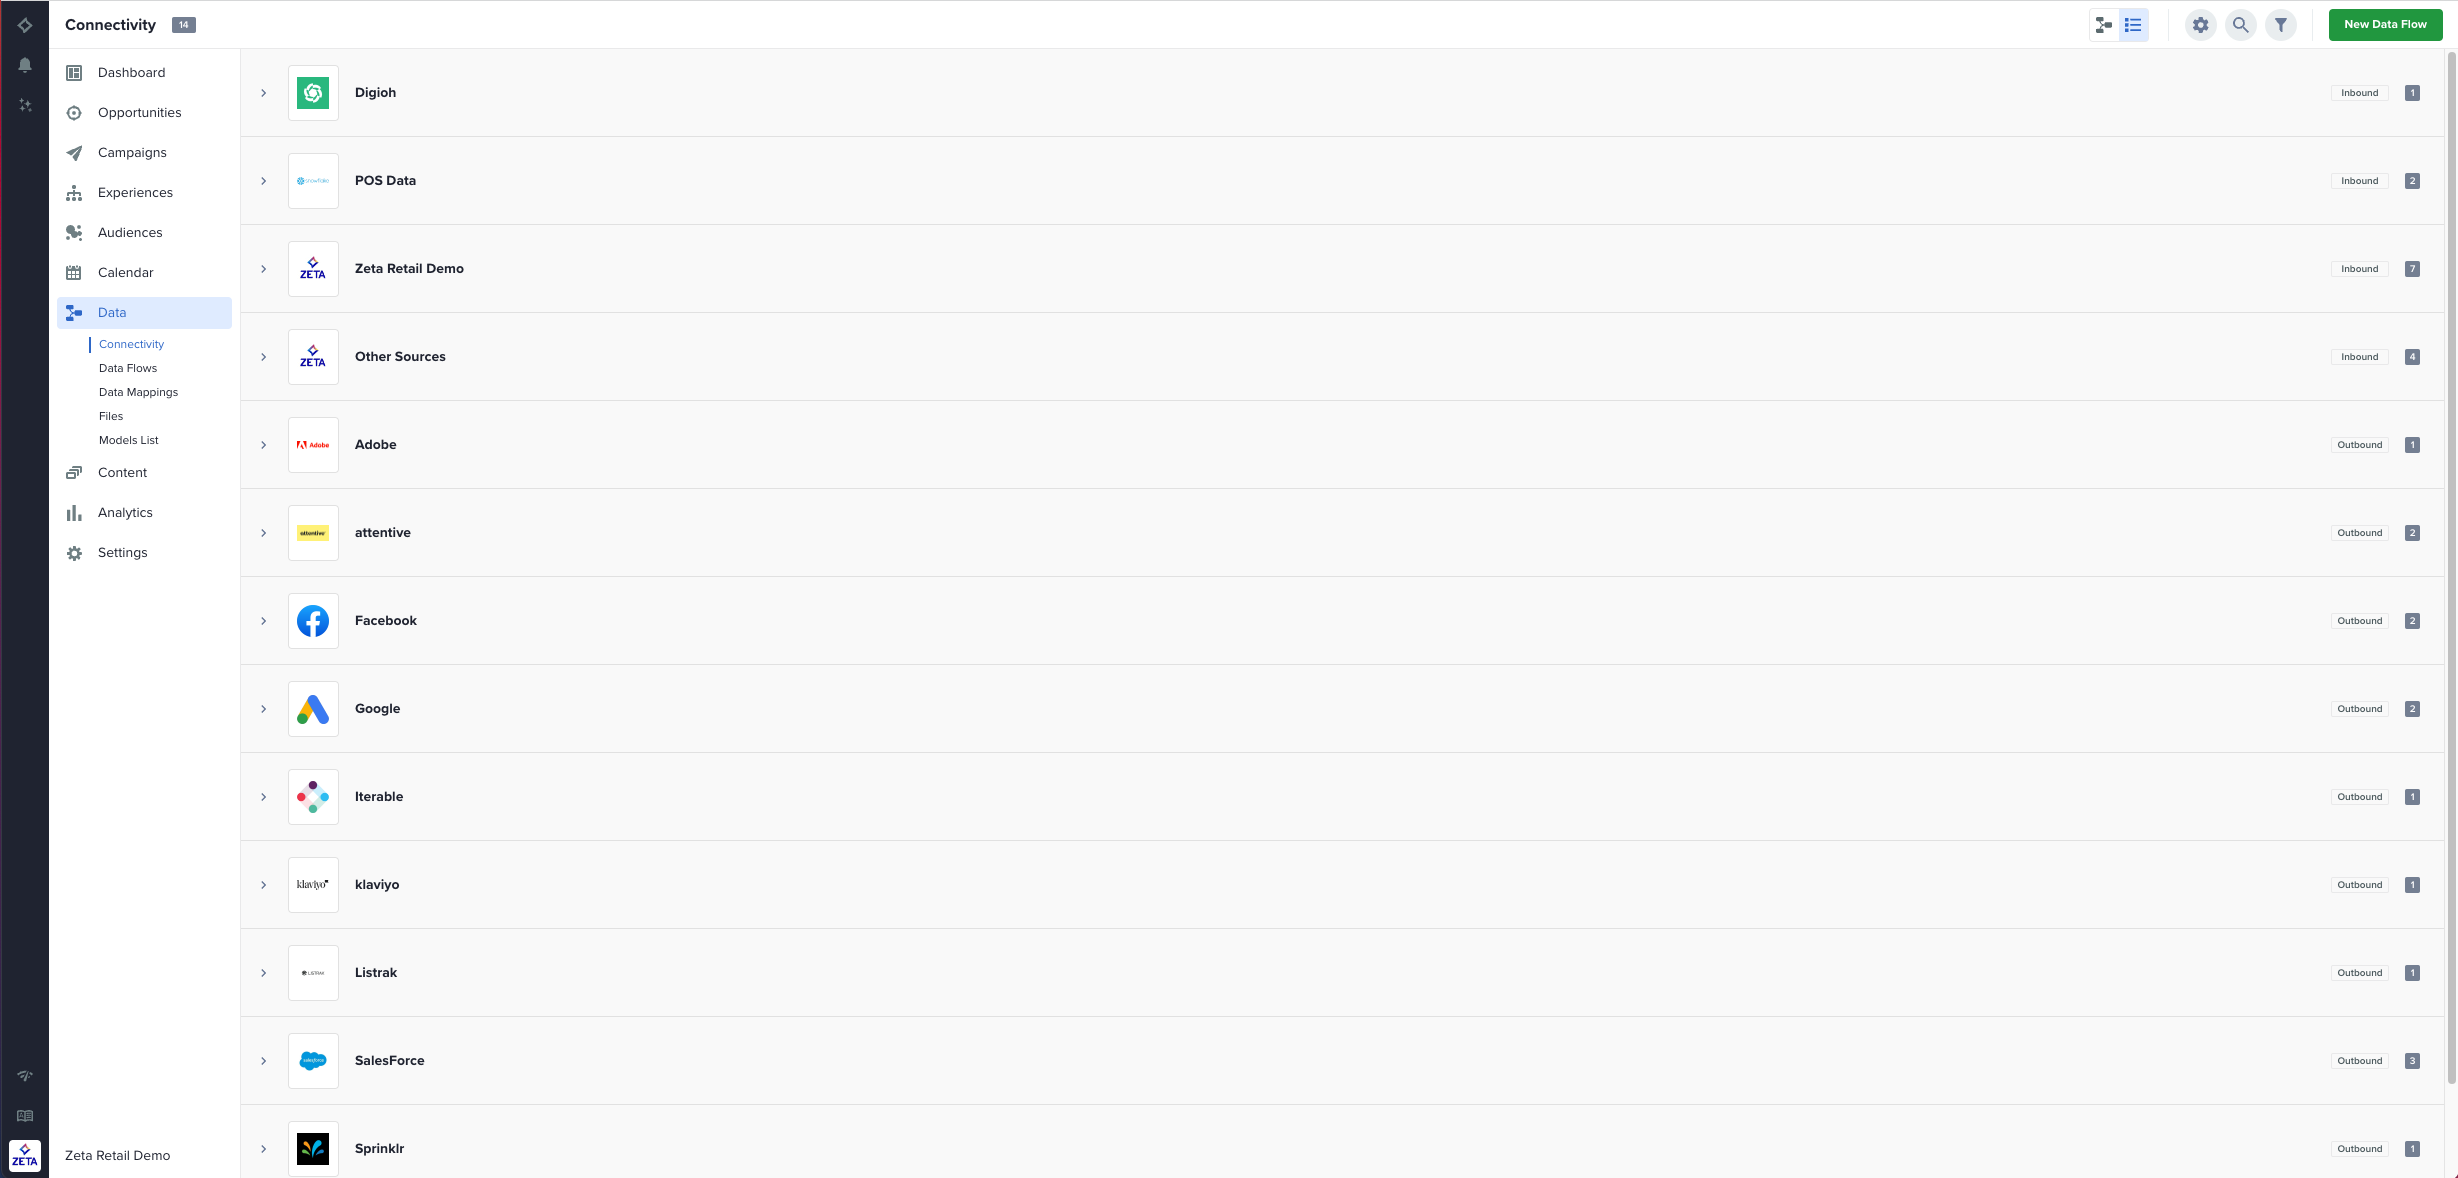
The total number of flows (on both the inbound and outbound sides) is shown as an integer on the top left.
The table lists ALL flows on the inbound and outbound sides, without limits.
You can also change the displayed columns and their order
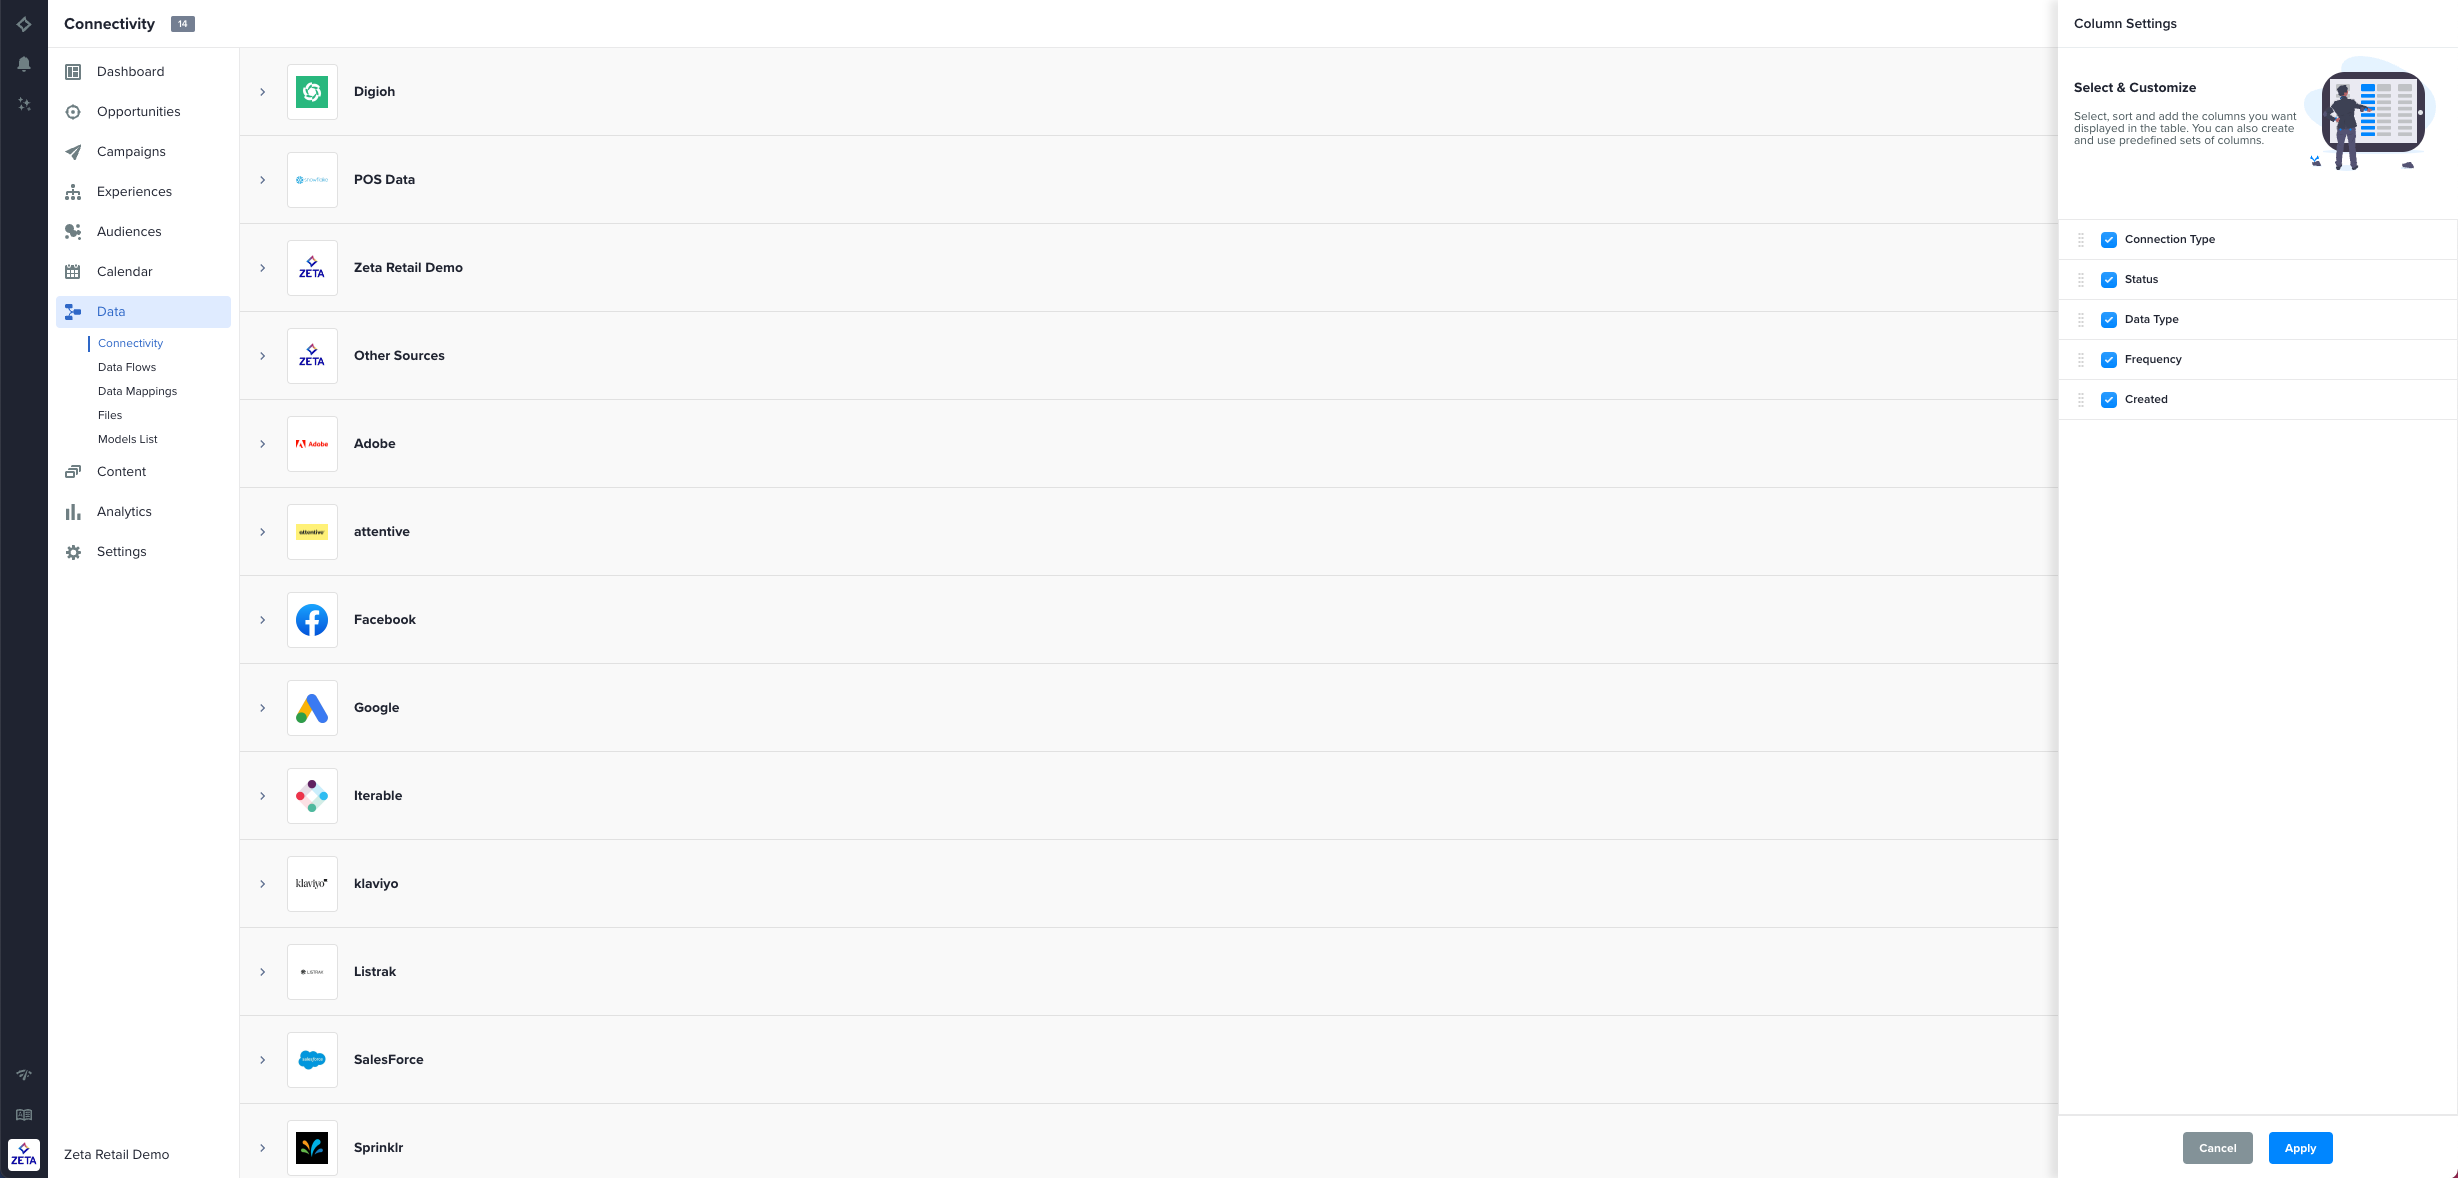
Click on the:
Data flow name to open the data flow canvas
Import Mapping to open the import mapping screen
API calls to open the API info page
Click on the action menu (…) against each flow will allow the following options:
Data Flows: Show the same action items as shown in the Data > Data Flows sub-menu
Channel Manager: Show the same action items as shown in each channel
Zeta Native Channels: Show the same action items as shown in each channel
3rd Party Ad Accounts: Show the same action items as shown in the Integration > Connections sub-menu
Creating New Data Flows
You can easily create new data flows from the connectivity visual or list diagram using the New Data Flow button at the top right. On activation, these data flows will start appearing in these diagrams.
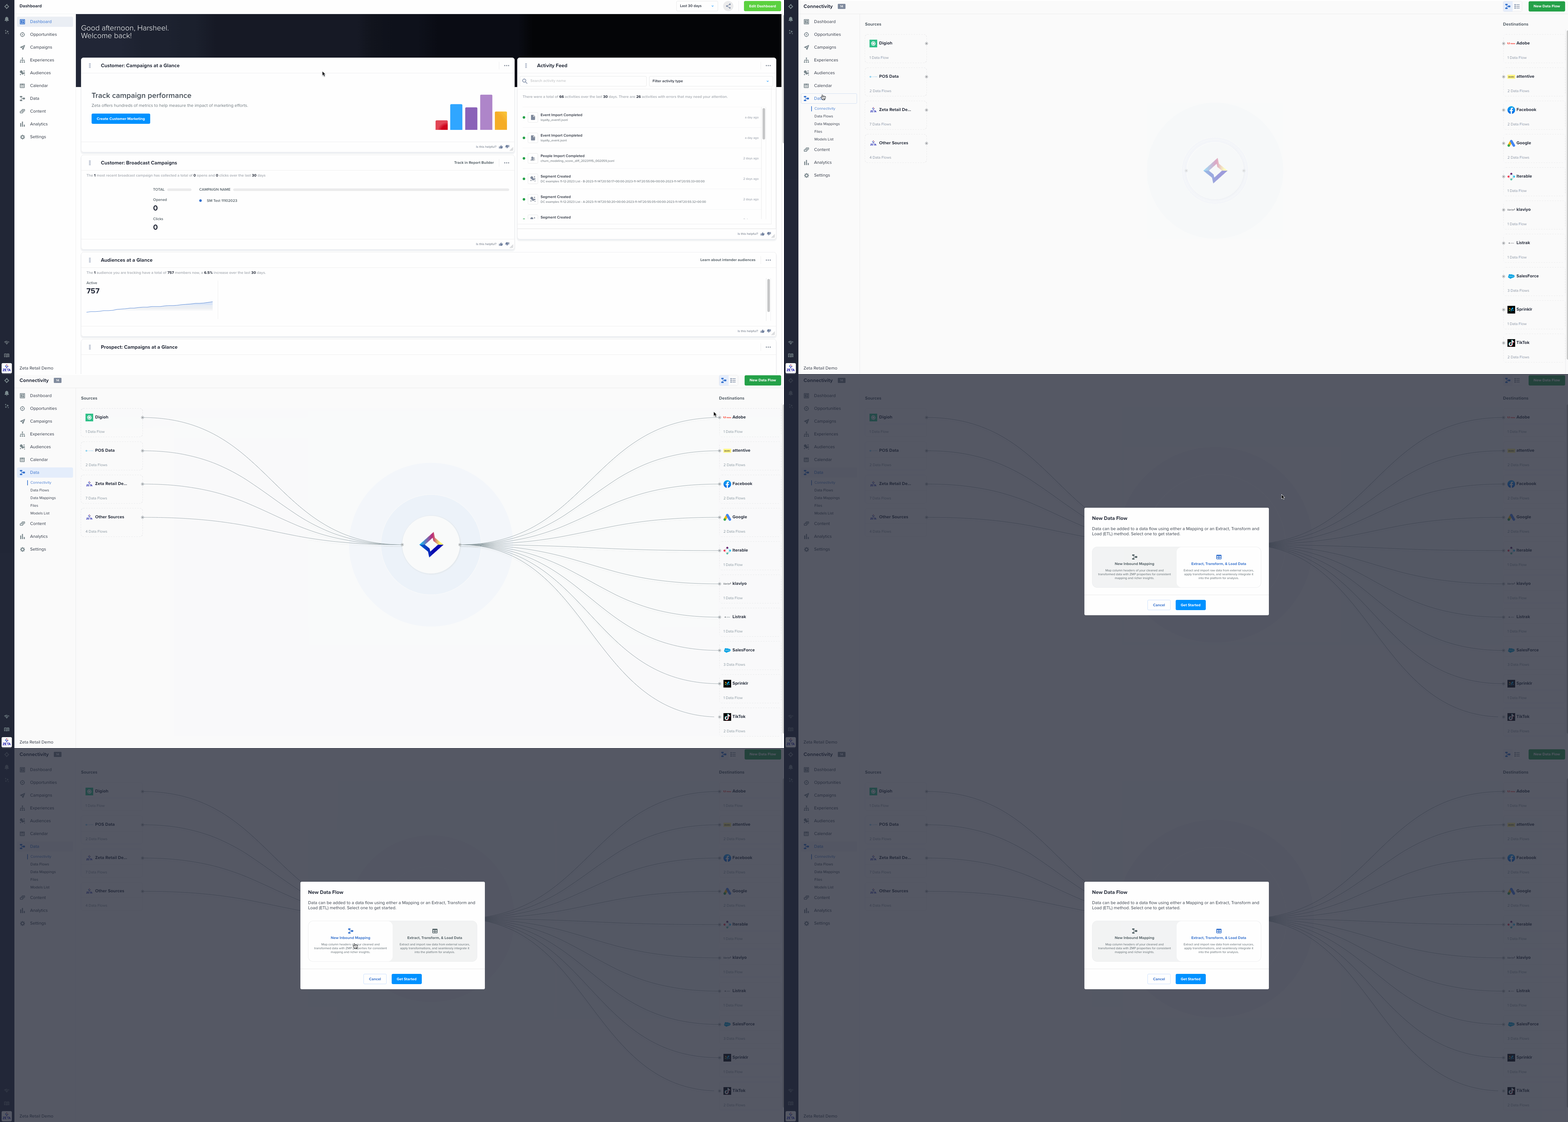
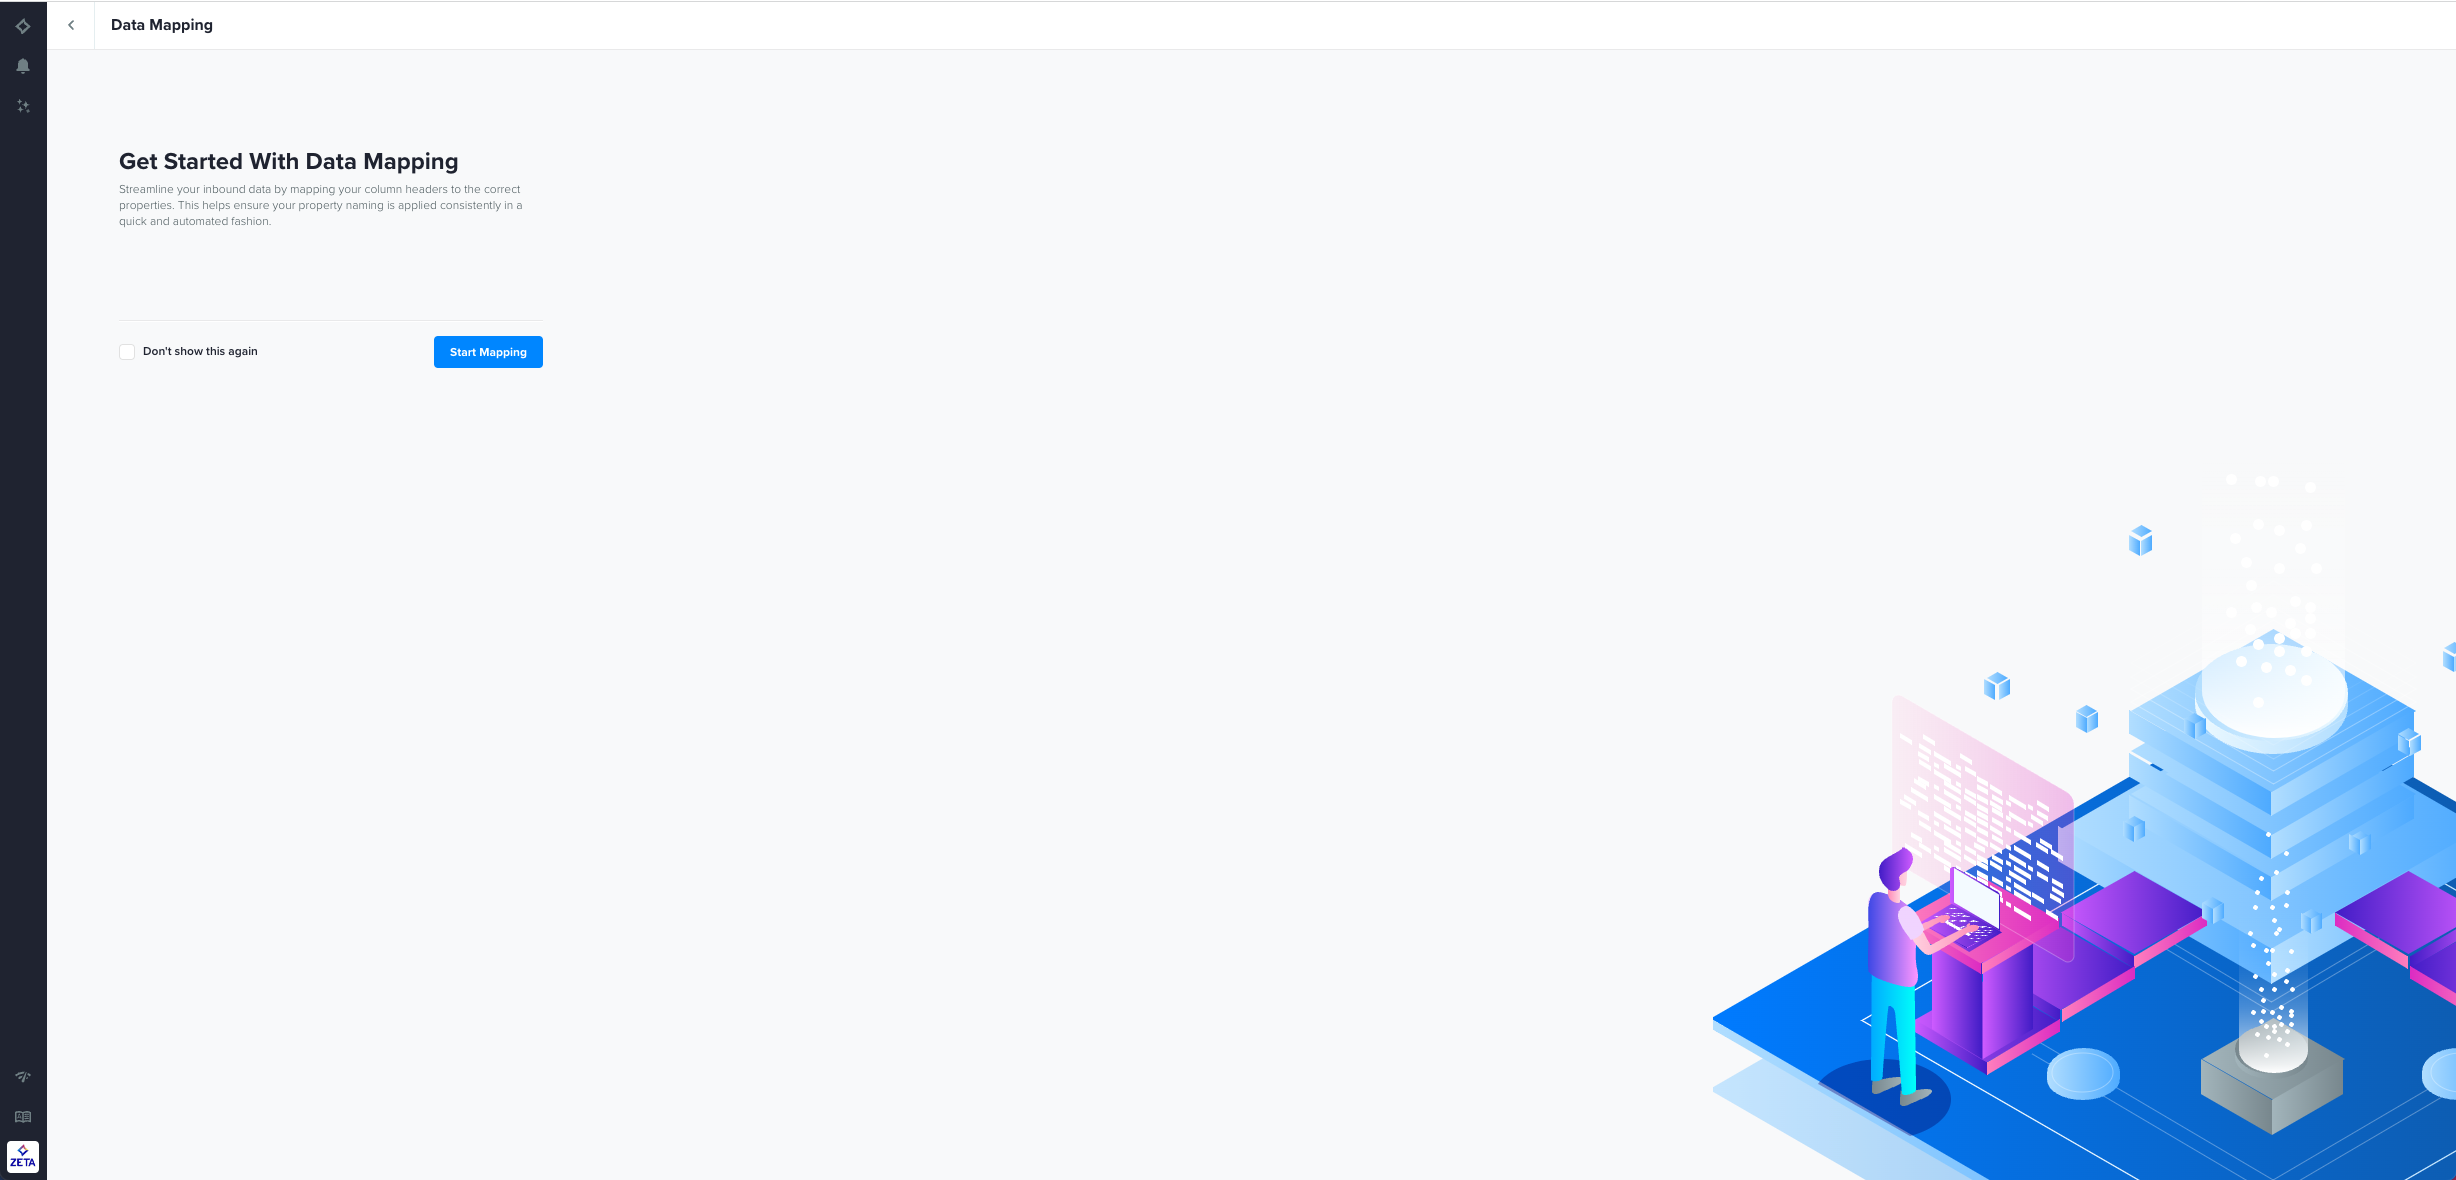
Upon clicking the button, will see 2 options to create a data flow. The new inbound mapping option is typically used when the data you want to ingest is already in a format that the ZMP can directly ingest. The mapping functionality allows you to conveniently map properties in your input data to properties that the ZMP account can understand. For example, fname to first_name or pay to income.
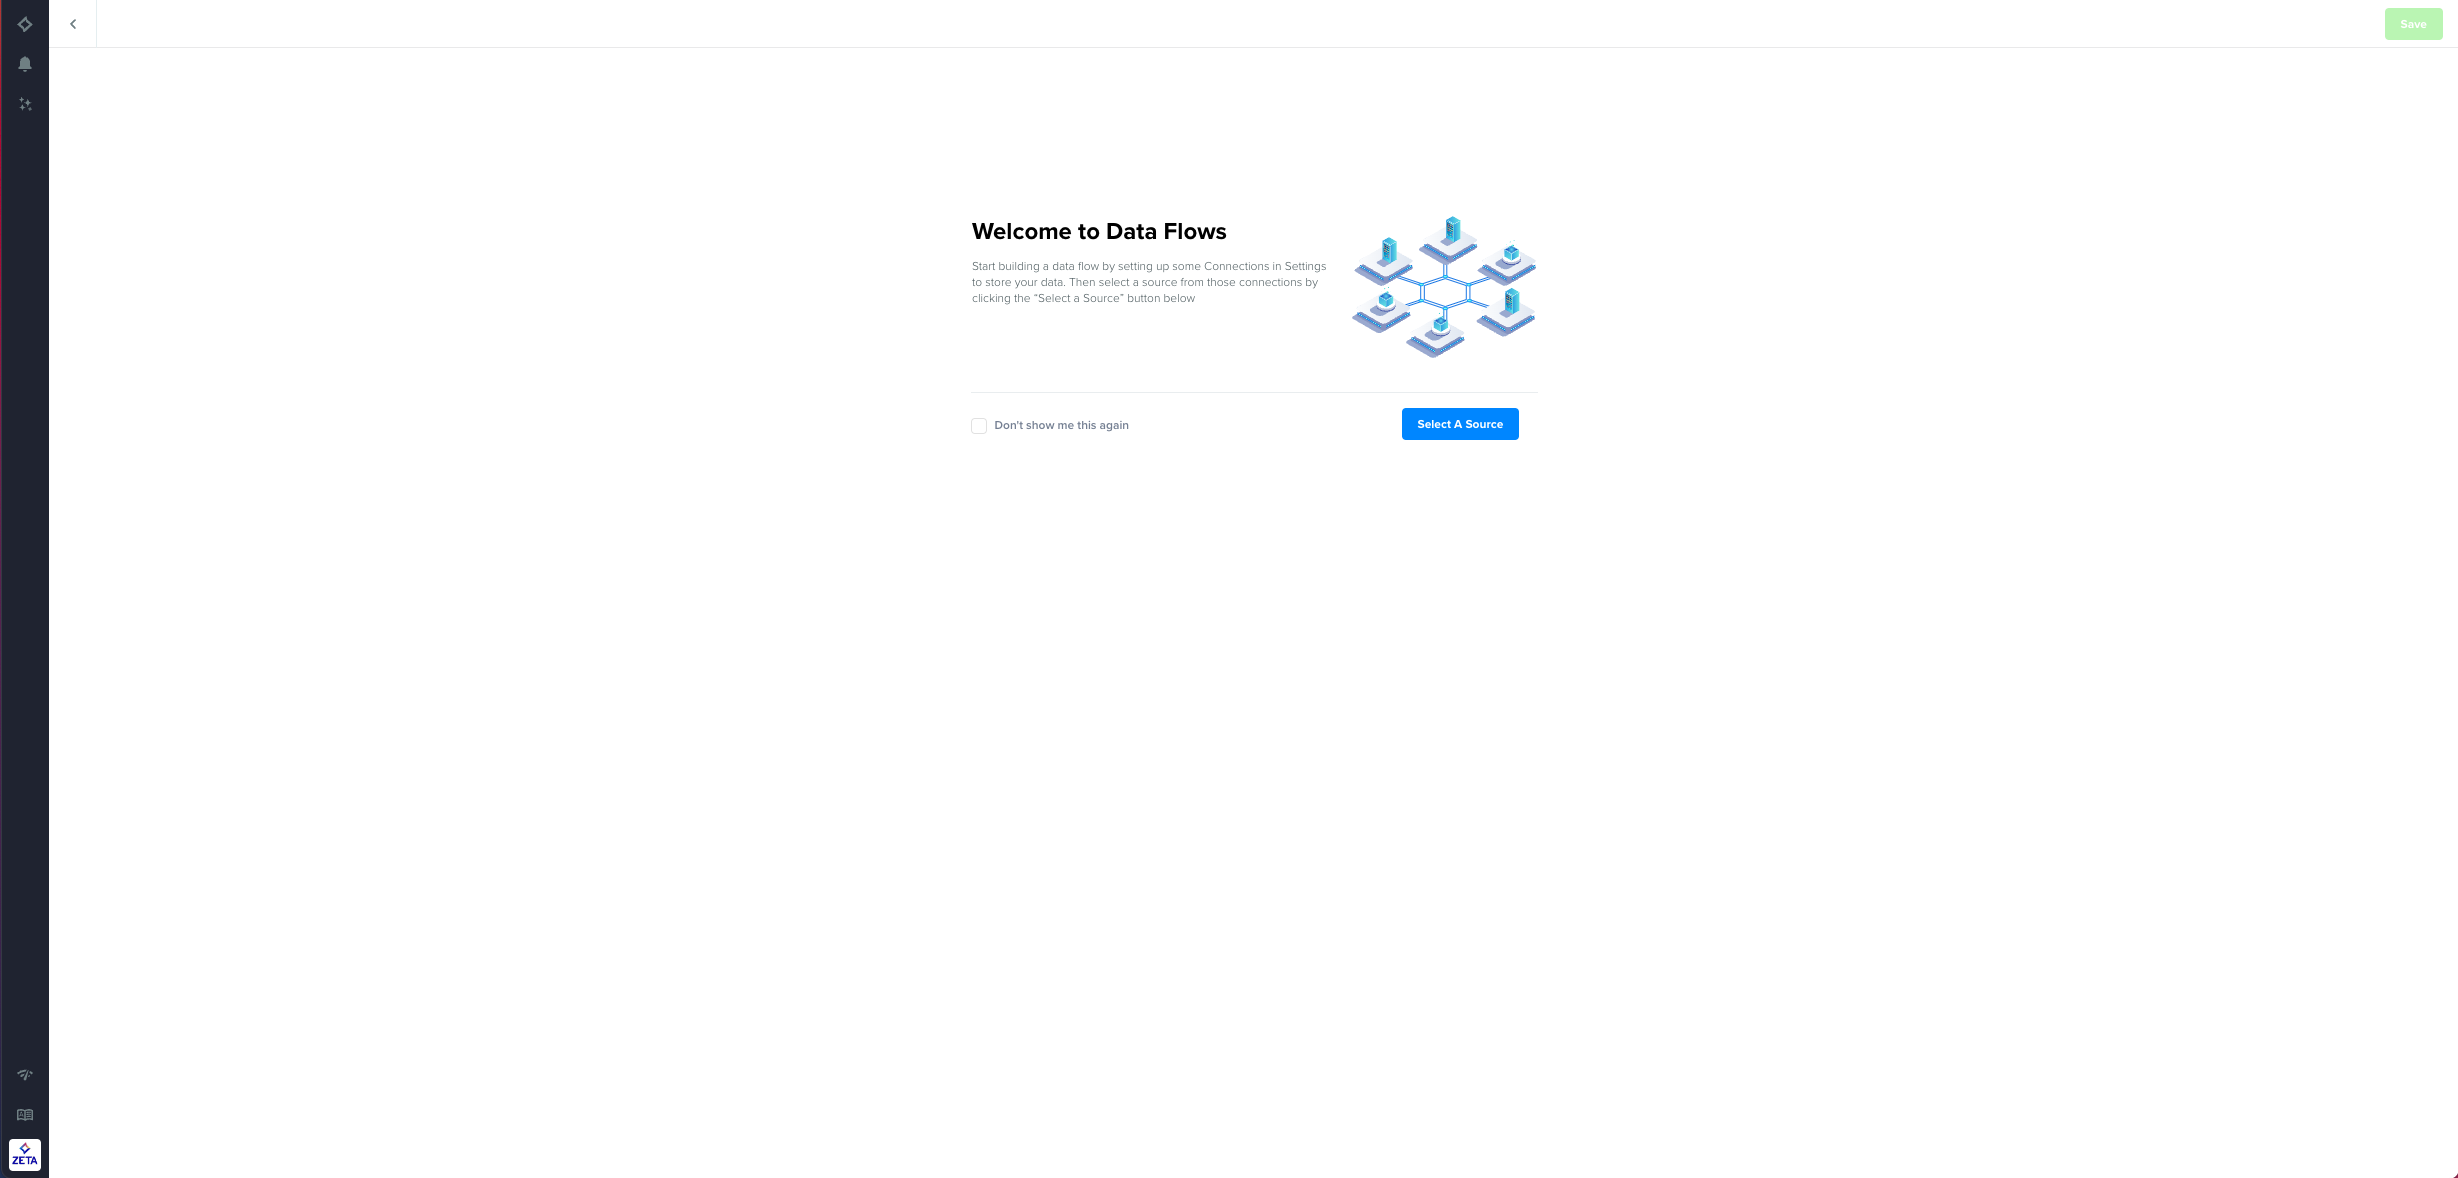
Alternatively, if your input data is not in a format that can be directly ingested, you can choose to cleanse and transform that data through an ETL flow and then ingest it in the ZMP.
Note:
You need the “Edit Data Mappings” role permission to allow you to select the “New Inbound Mapping” option.
You need the “Edit Data Flows” role permission to allow you to select the “Extract, Transform, & Load Data” option.
![]() The New Data Flow button will only be enabled if you have at least one of the above two permissions. Please contact your Account Administrator to get these permissions enabled for you.
The New Data Flow button will only be enabled if you have at least one of the above two permissions. Please contact your Account Administrator to get these permissions enabled for you.
For certain types of data flows shown on the connectivity canvas, you can navigate to the data flow from the Data Flow card itself. The following Data Flow types are supported: | |
Inbound Side | Outbound Side |
|
|
 | |
| |
