
AudiencePulse
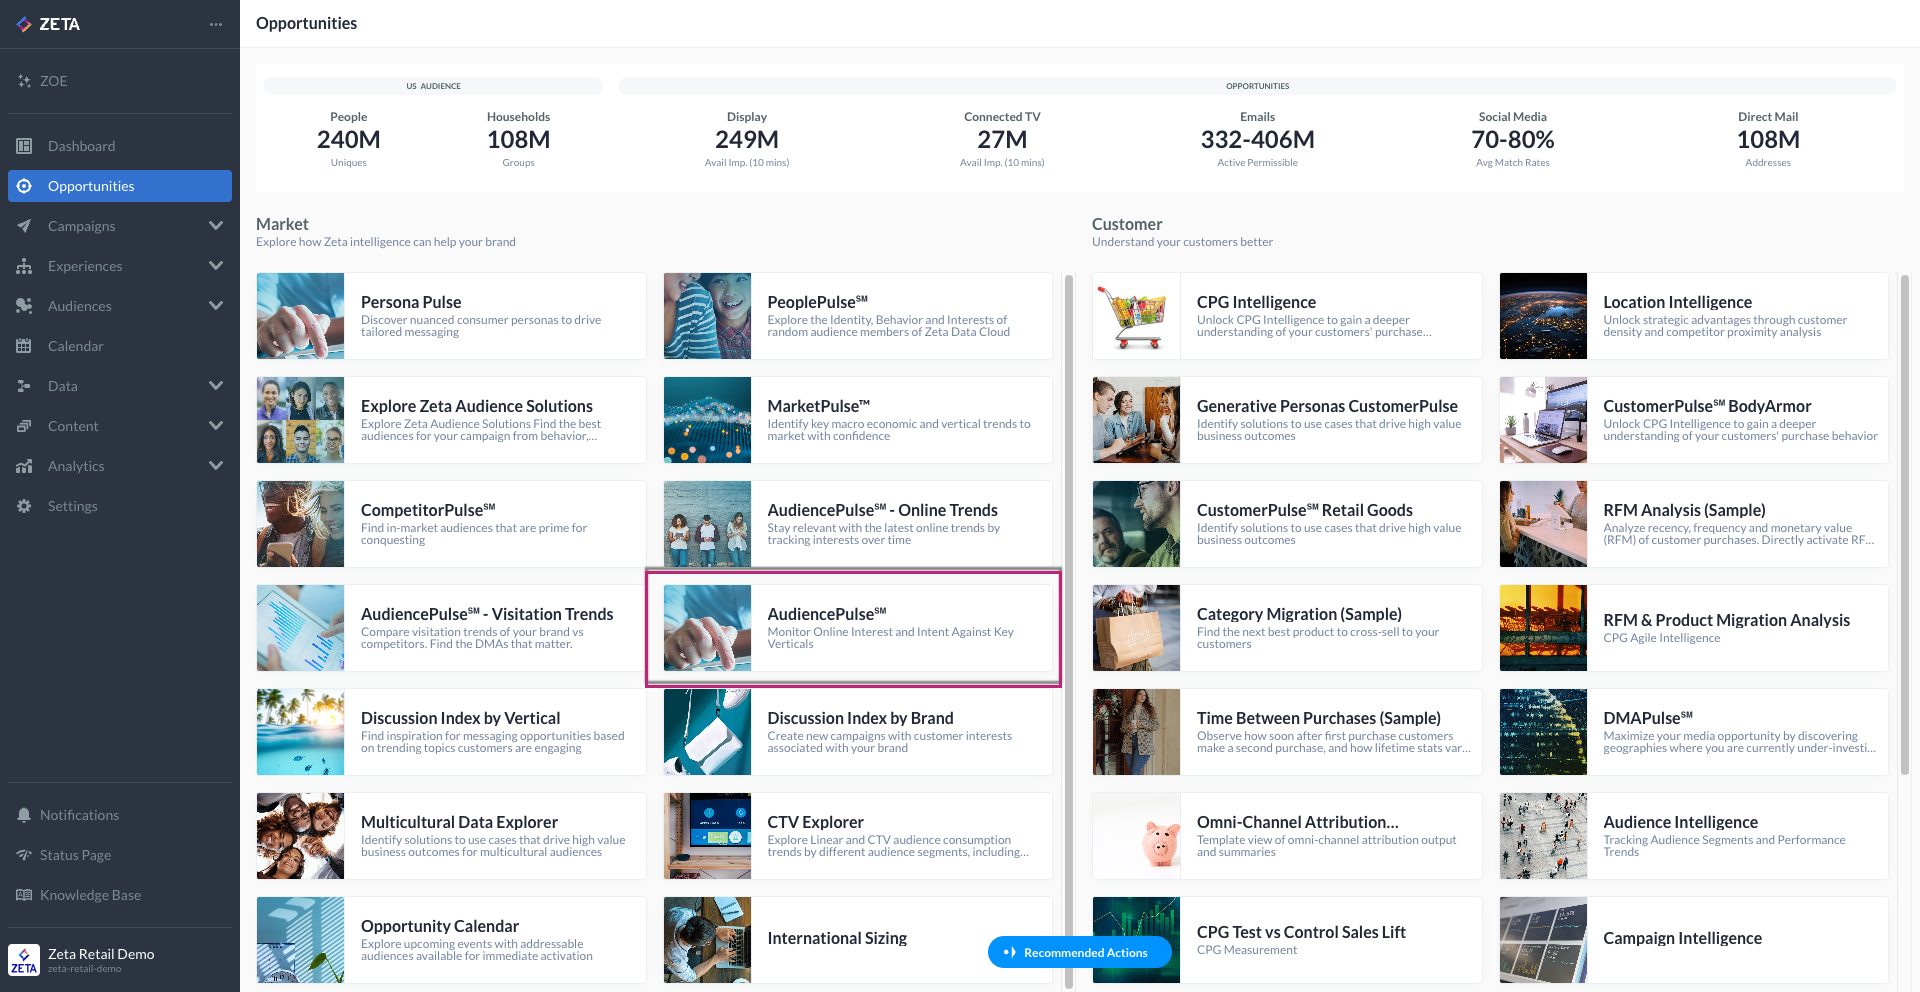
From the Opportunities page, navigate to the AudiencePulse tab under Market insights.
AudiencePulse: Online Trends
The Online Trends within AudiencePulse compares the varied levels of interest of the Zeta online content consumption audiences over time in the US. With AudiencePulse, we can compare the daily, weekly, and monthly trends of audience counts.
-20241014-100916.gif?inst-v=ee32691c-66ac-46c7-afdb-dc8f6e6bf200)
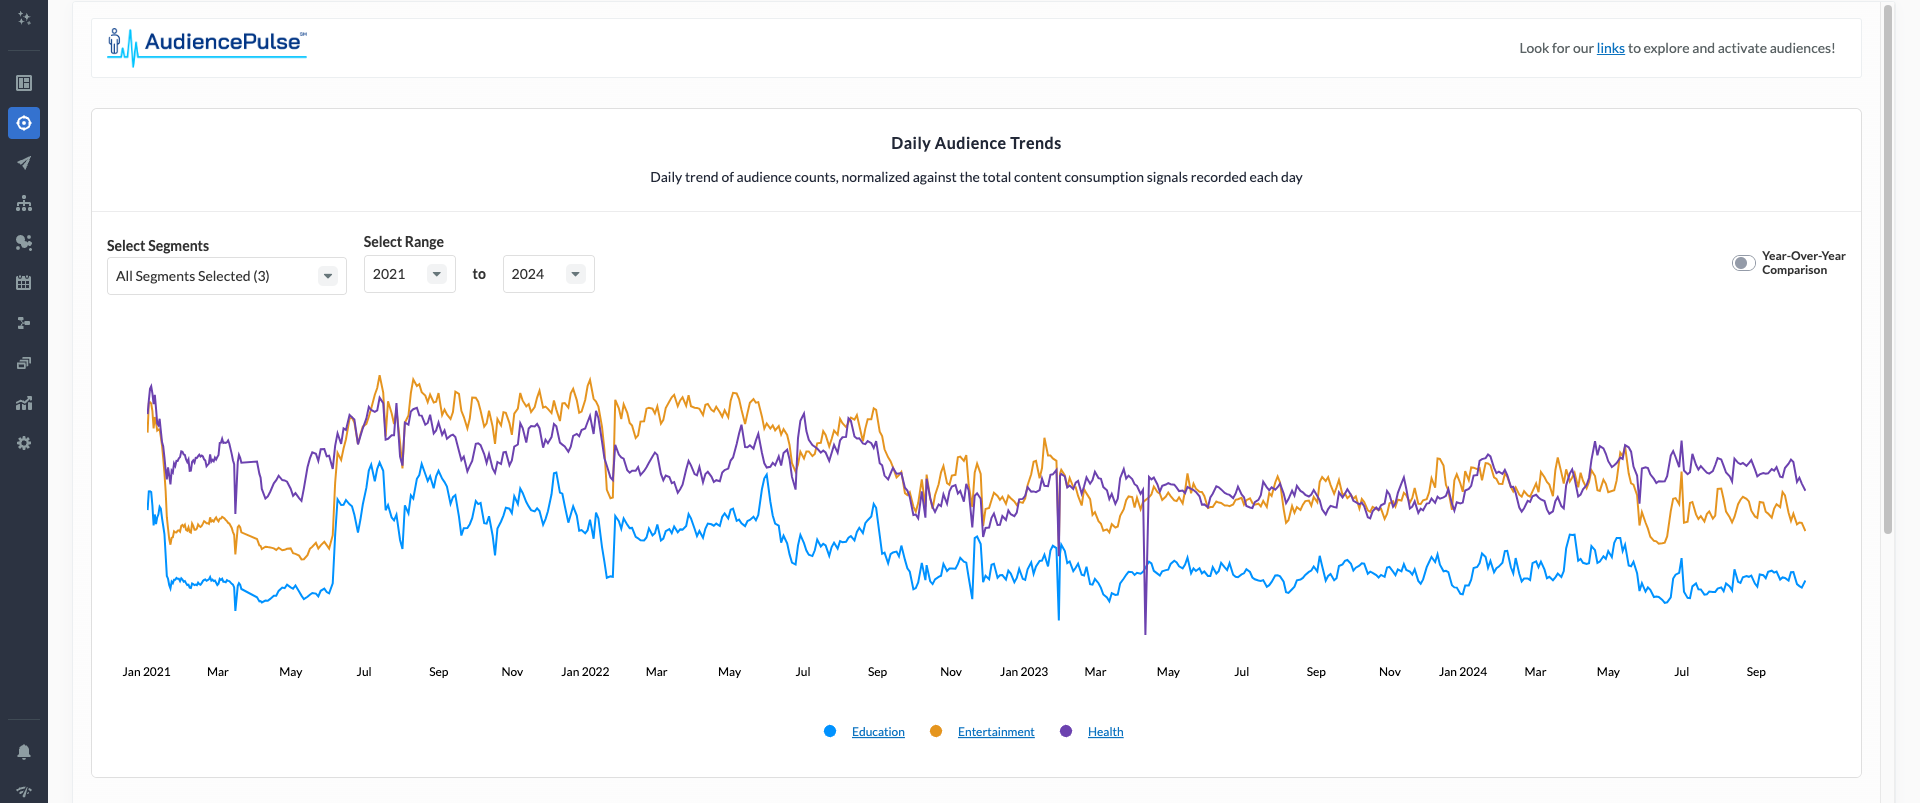
The daily audience trends show the audience counts, normalized against the total content consumption signals recorded each day.
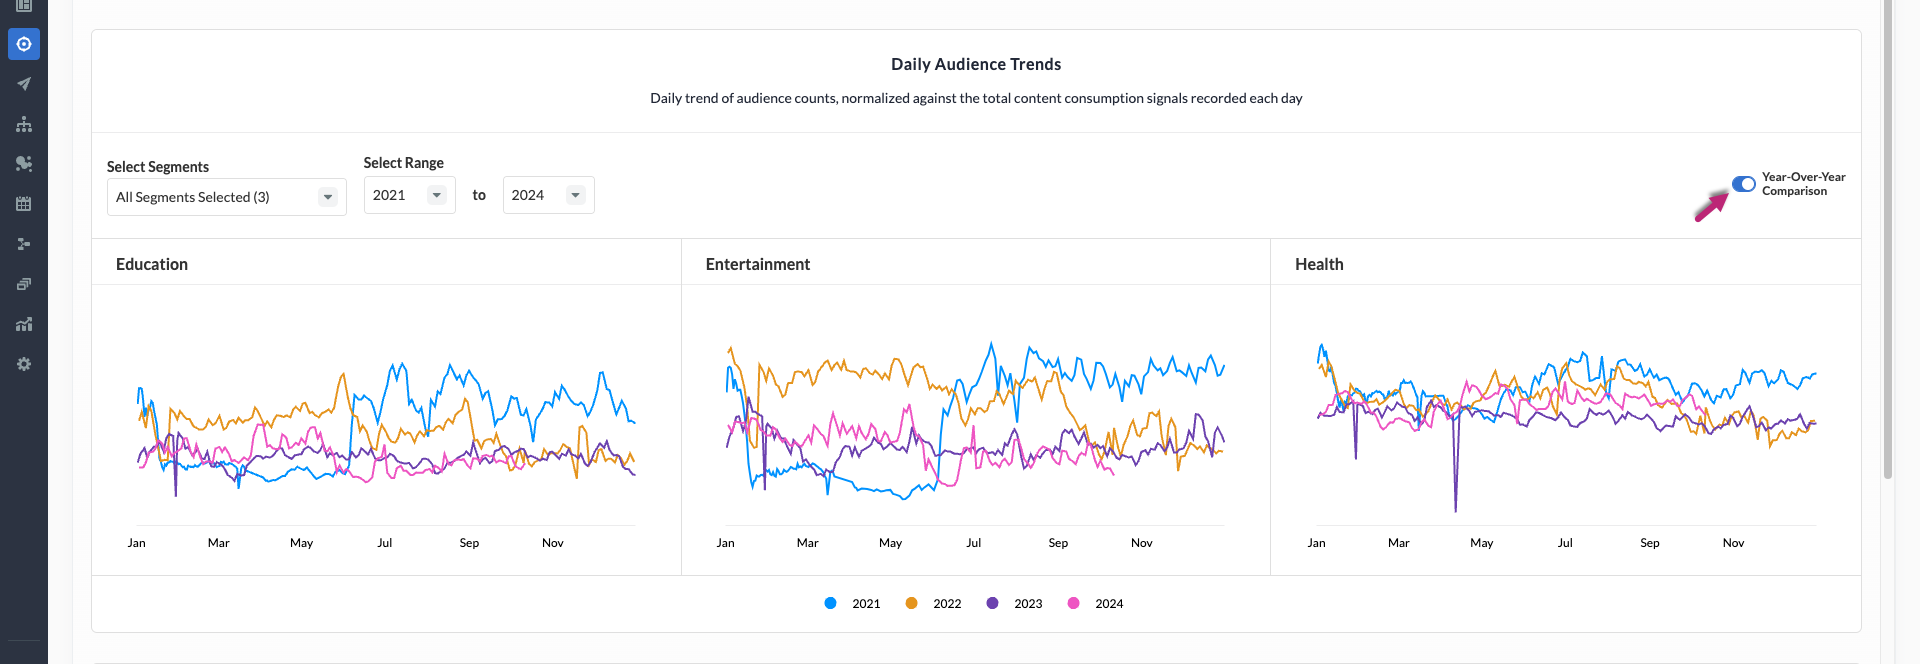
Turning the Year-Over-Year toggle also shows a yearly comparison of the audience trends across the segments selected:
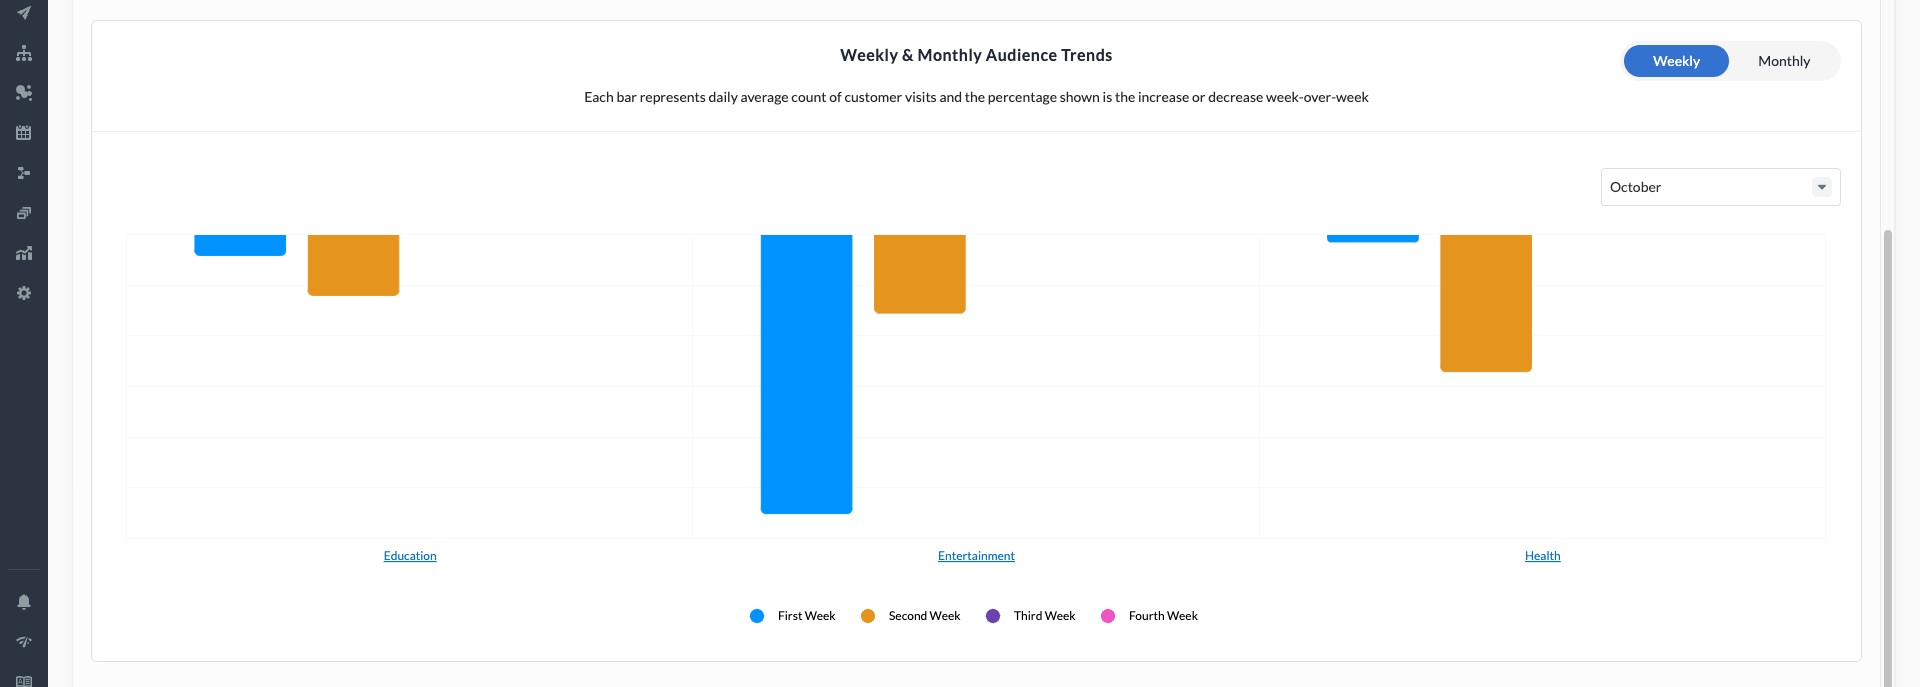
In the weekly trends, each bar represents the increase or decrease week-over-week.
In the monthly trends, each bar represents the increase or decrease month-over-month.
AudiencePulse: Visitation Trends
The Visitation Trends within AudiencePulse compares customer visit patterns to physical brand locations in the US. Visitation audiences are derived from visits to brand locations at the individual level.
-20241014-101411.gif?inst-v=ee32691c-66ac-46c7-afdb-dc8f6e6bf200)
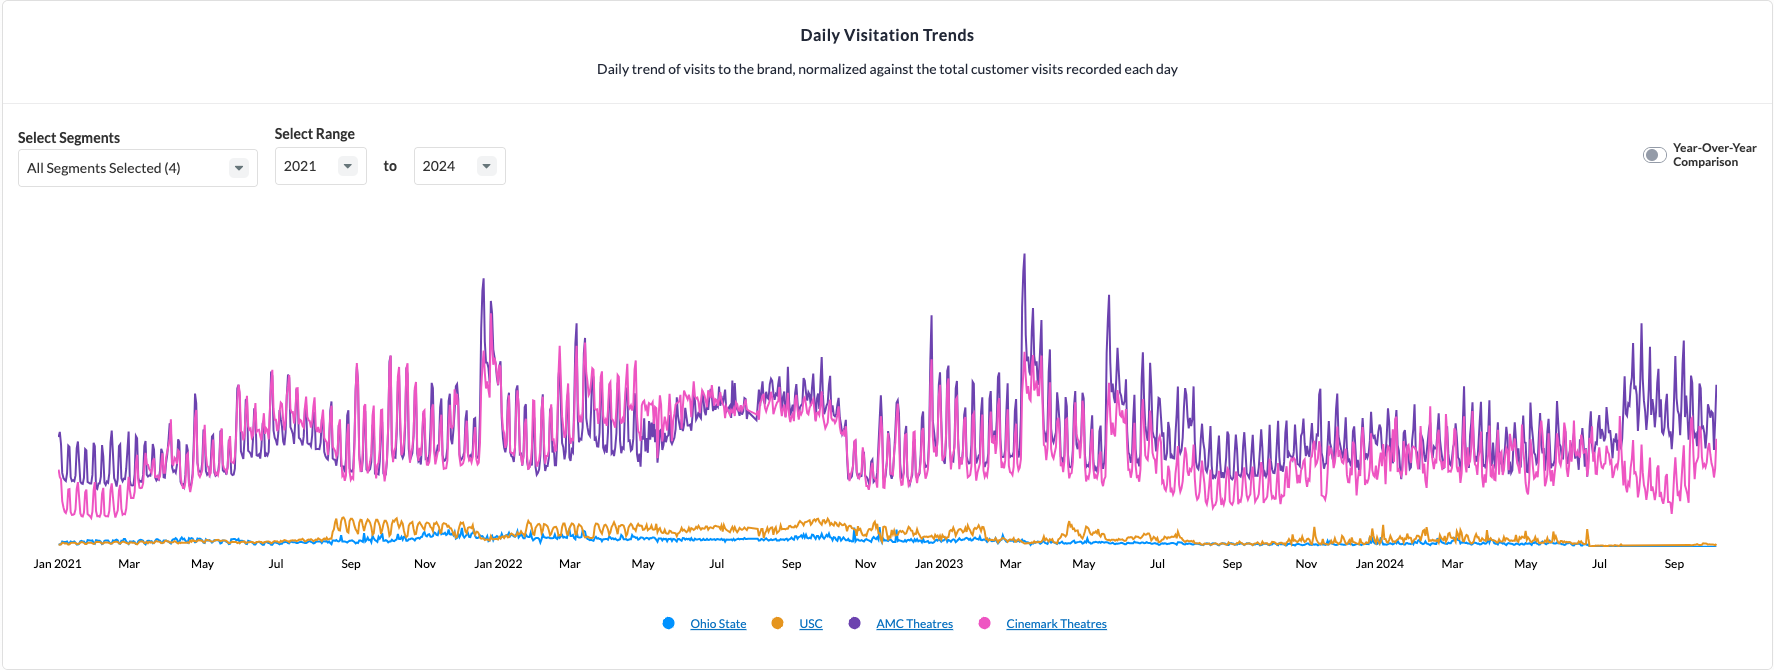
The daily visitation trend shows visits to the brand, normalized against the total customer visits recorded each day.
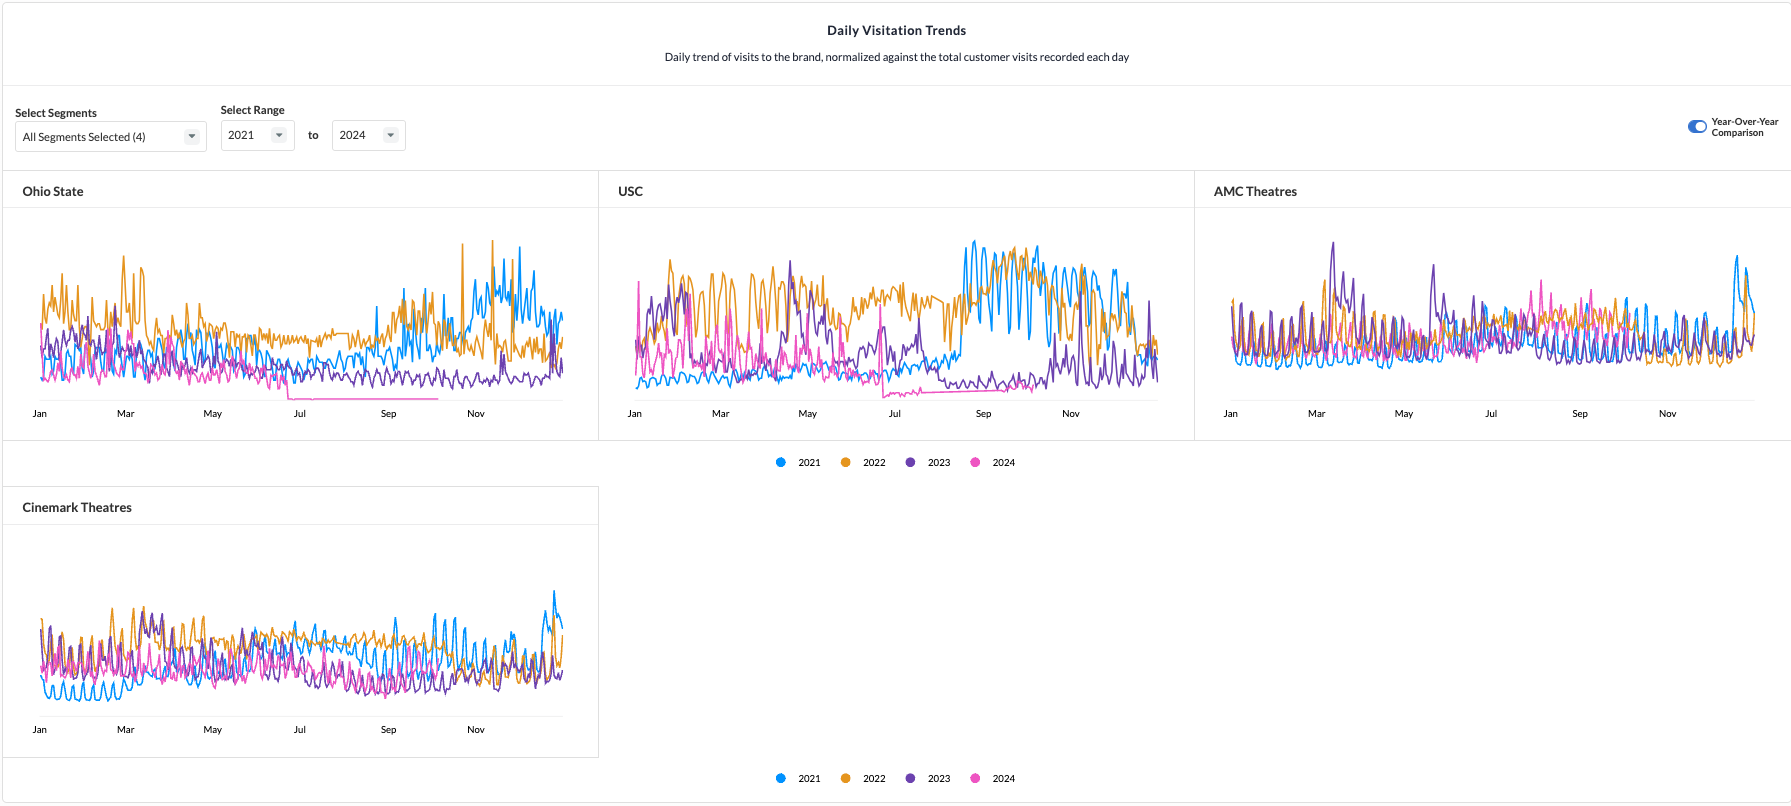
Turning the Year-Over-Year toggle also shows a yearly comparison of the audience trends across the segments selected:
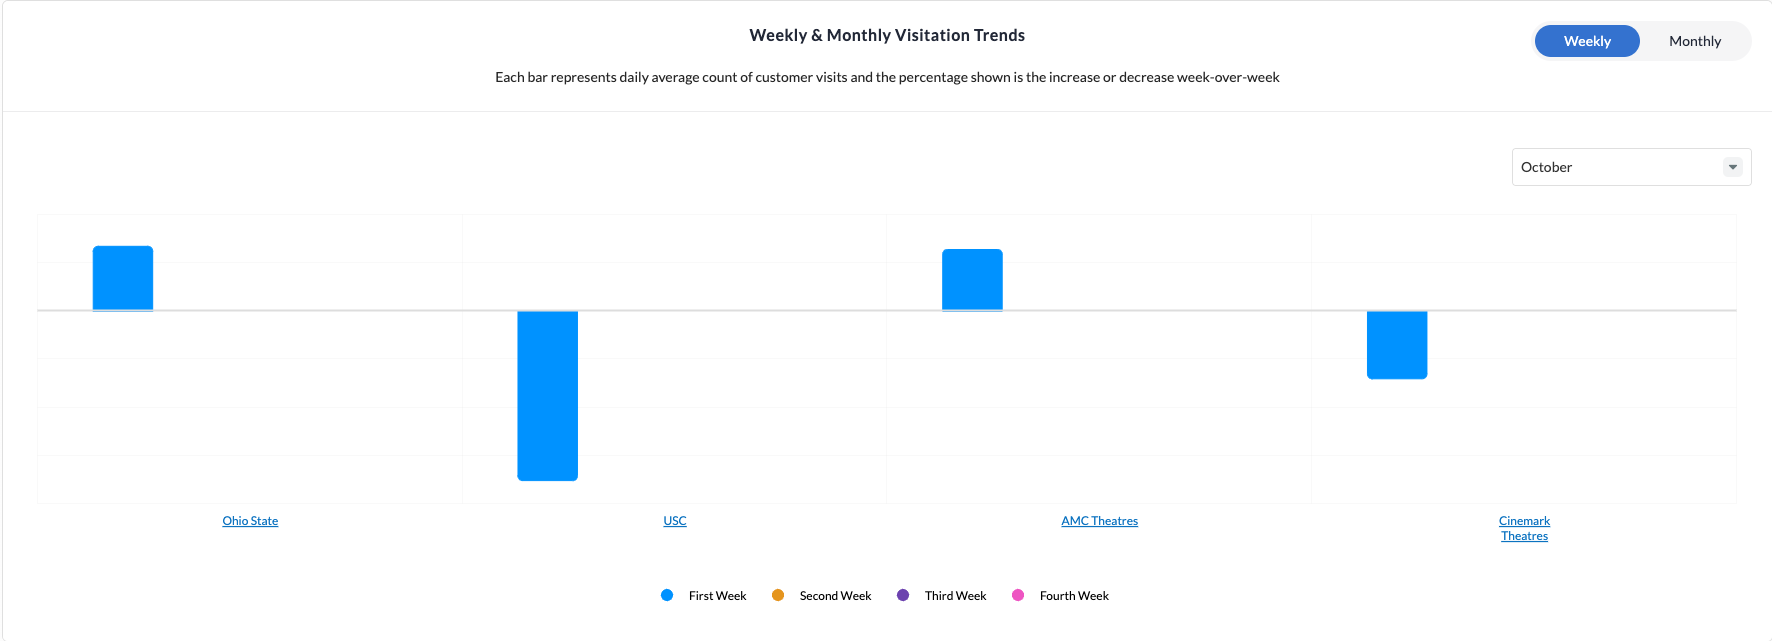
In the weekly and monthly visitation trends graph, each bar represents the increase or decrease week-over-week and month-over-month.
DMA Trends
Scroll down to view the weekly and monthly visitation trends by DMA to identify which markets are prime for conquesting.
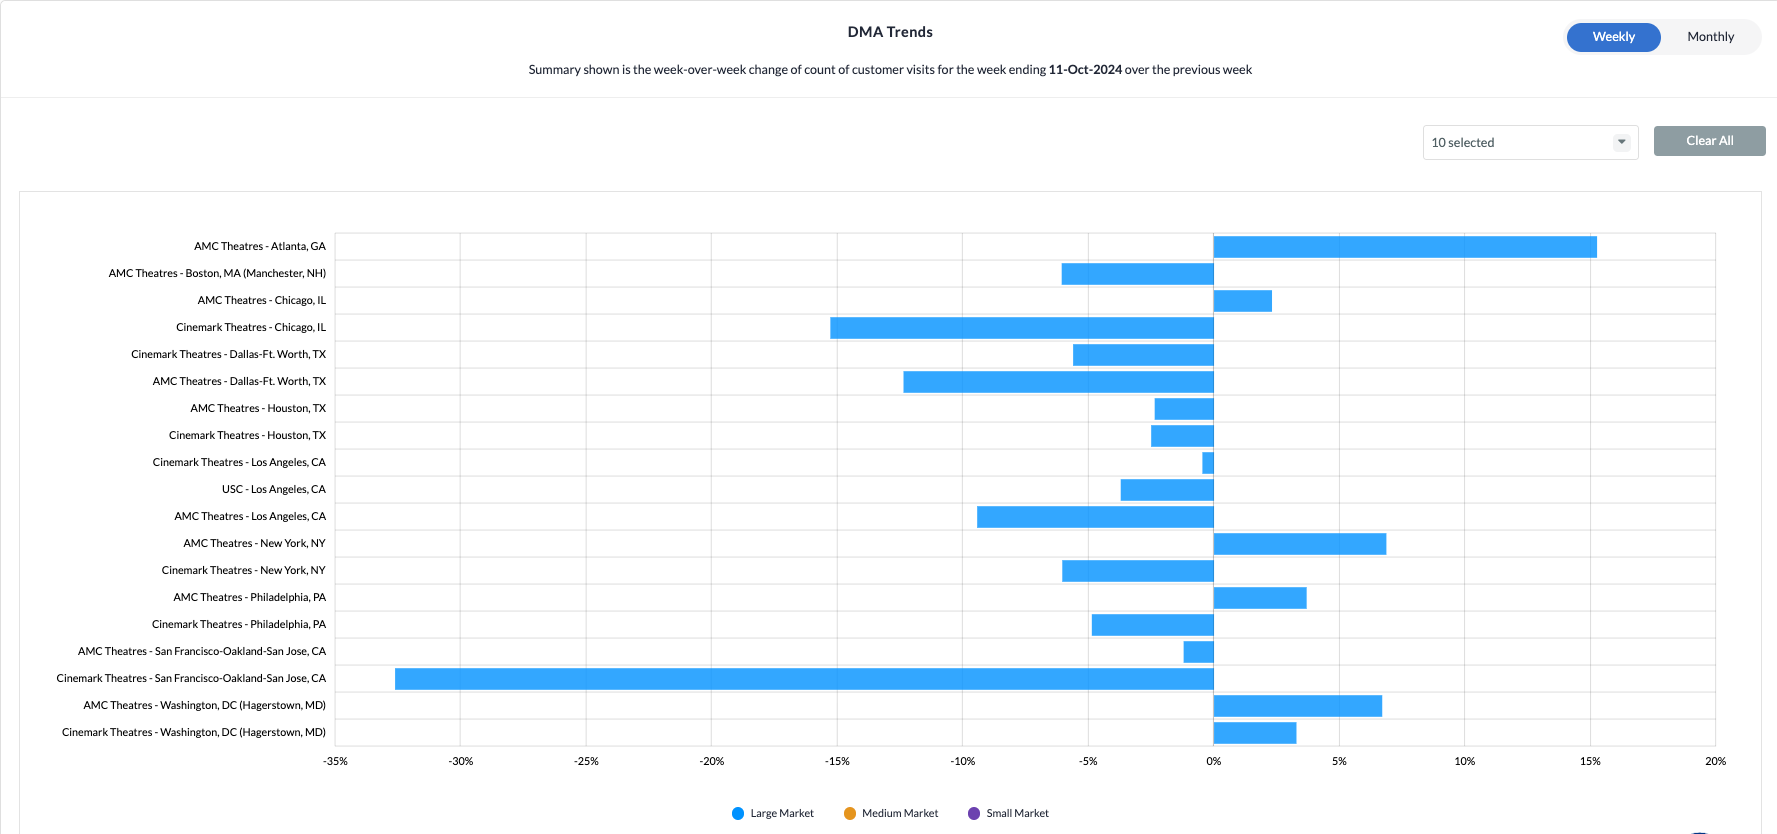
The summary shown in the weekly trend is the week-over-week change in counts of customer visits.
The summary shown in the monthly trend is the month-over-month change in counts of customer visits.
The 10 largest markets are selected by default, but other markets can be selected through the dropdown.