
Area Chart
For an Area Chart,
Add a chart name to label your visualization.
Enter Y-axis 1, Y-axis 2, X-axis, and metrics to define chart values.
Add additional tooltip info for richer context on hover.
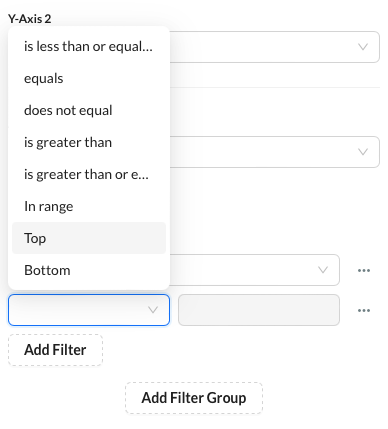
Apply local filters to refine dimensions and metrics.
Add filter groups for advanced filtering options.
-20250901-063759.gif?inst-v=c9ff232f-9ce9-47e4-b199-f6548f0817c1)
The Style tab for Area charts allows you to:
Customize the color palette to match your theme.
Edit caption names for clearer labels.
Refine style settings to adjust the overall look.
Adjust chart size to fit your viewing needs.
 |